mirror of
https://github.com/VictoriaMetrics/VictoriaMetrics.git
synced 2026-06-09 11:54:31 +03:00
Compare commits
65 Commits
v1.23.2-vi
...
make/use-g
| Author | SHA1 | Date | |
|---|---|---|---|
|
|
1d6340fe83 | ||
|
|
1334eee433 | ||
|
|
2d67e14d59 | ||
|
|
539498058e | ||
|
|
b3d22403eb | ||
|
|
0fce51e3b4 | ||
|
|
9e118fe1ee | ||
|
|
3553c60399 | ||
|
|
9b54bd6e8d | ||
|
|
a90edc71c7 | ||
|
|
83deddc84c | ||
|
|
434cb7028c | ||
|
|
107b6517b7 | ||
|
|
f68f5b3113 | ||
|
|
d49b4a7550 | ||
|
|
bd8b4eb78b | ||
|
|
41558066db | ||
|
|
af064ca65a | ||
|
|
eced71a96d | ||
|
|
23fd269ccf | ||
|
|
1f5d02e059 | ||
|
|
690aaf7d2d | ||
|
|
1e0f7f0d28 | ||
|
|
c7a16e1df6 | ||
|
|
2cb909022f | ||
|
|
fe70b963e4 | ||
|
|
9bb726751c | ||
|
|
3c85ffb1e6 | ||
|
|
65cb6468ac | ||
|
|
8e645ea708 | ||
|
|
b95bdb5781 | ||
|
|
5ecc5770c2 | ||
|
|
02c03793b3 | ||
|
|
c74c4b24d7 | ||
|
|
07be0c6129 | ||
|
|
826c408e0e | ||
|
|
913b64d9b5 | ||
|
|
6b76dead5a | ||
|
|
41991edb34 | ||
|
|
eb7c21bde5 | ||
|
|
3cc8013dd9 | ||
|
|
1209f33c6d | ||
|
|
3c87e361ba | ||
|
|
f5c9c5bf01 | ||
|
|
7712a34ba6 | ||
|
|
d890bf52fe | ||
|
|
f52478dac7 | ||
|
|
bcc2c85e53 | ||
|
|
001f9218b1 | ||
|
|
f7fc897f85 | ||
|
|
e58b512305 | ||
|
|
d33efbbd95 | ||
|
|
23cb0475e9 | ||
|
|
3d3fcf8fcb | ||
|
|
d99e3e52f3 | ||
|
|
bbcfc0ce59 | ||
|
|
d9ac6867cb | ||
|
|
00712b184b | ||
|
|
30ca617960 | ||
|
|
aba5205896 | ||
|
|
aef59d9281 | ||
|
|
b1582b3012 | ||
|
|
dd769d87c0 | ||
|
|
febe9a2882 | ||
|
|
337ccd7c62 |
2
.github/pull_request_template.md
vendored
2
.github/pull_request_template.md
vendored
@@ -6,4 +6,4 @@ Please provide a brief description of the changes you made. Be as specific as po
|
||||
|
||||
The following checks are **mandatory**:
|
||||
|
||||
- [ ] My change adheres to [VictoriaMetrics contributing guidelines](https://docs.victoriametrics.com/victoriametrics/contributing/).
|
||||
- [ ] My change adheres to [VictoriaMetrics contributing guidelines](https://docs.victoriametrics.com/victoriametrics/contributing/#pull-request-checklist).
|
||||
|
||||
32
Makefile
32
Makefile
@@ -195,6 +195,25 @@ vmutils-crossbuild: \
|
||||
vmutils-openbsd-amd64 \
|
||||
vmutils-windows-amd64
|
||||
|
||||
publish-latest:
|
||||
PKG_TAG=$(TAG) APP_NAME=victoria-metrics $(MAKE) publish-via-docker-latest && \
|
||||
PKG_TAG=$(TAG) APP_NAME=vmagent $(MAKE) publish-via-docker-latest && \
|
||||
PKG_TAG=$(TAG) APP_NAME=vmalert $(MAKE) publish-via-docker-latest && \
|
||||
PKG_TAG=$(TAG) APP_NAME=vmalert-tool $(MAKE) publish-via-docker-latest && \
|
||||
PKG_TAG=$(TAG) APP_NAME=vmauth $(MAKE) publish-via-docker-latest && \
|
||||
PKG_TAG=$(TAG) APP_NAME=vmbackup $(MAKE) publish-via-docker-latest && \
|
||||
PKG_TAG=$(TAG) APP_NAME=vmrestore $(MAKE) publish-via-docker-latest && \
|
||||
PKG_TAG=$(TAG) APP_NAME=vmctl $(MAKE) publish-via-docker-latest && \
|
||||
PKG_TAG=$(TAG)-cluster APP_NAME=vminsert $(MAKE) publish-via-docker-latest && \
|
||||
PKG_TAG=$(TAG)-cluster APP_NAME=vmselect $(MAKE) publish-via-docker-latest && \
|
||||
PKG_TAG=$(TAG)-cluster APP_NAME=vmstorage $(MAKE) publish-via-docker-latest && \
|
||||
PKG_TAG=$(TAG)-enterprise APP_NAME=vmgateway $(MAKE) publish-via-docker-latest
|
||||
PKG_TAG=$(TAG)-enterprise APP_NAME=vmbackupmanager $(MAKE) publish-via-docker-latest
|
||||
|
||||
publish-victoria-logs-latest:
|
||||
PKG_TAG=$(TAG) APP_NAME=victoria-logs $(MAKE) publish-via-docker-latest
|
||||
PKG_TAG=$(TAG) APP_NAME=vlogscli $(MAKE) publish-via-docker-latest
|
||||
|
||||
publish-release:
|
||||
rm -rf bin/*
|
||||
git checkout $(TAG) && $(MAKE) release && $(MAKE) publish && \
|
||||
@@ -509,8 +528,6 @@ vet:
|
||||
|
||||
check-all: fmt vet golangci-lint govulncheck
|
||||
|
||||
clean-checkers: remove-golangci-lint remove-govulncheck
|
||||
|
||||
test:
|
||||
GOEXPERIMENT=synctest go test ./lib/... ./app/...
|
||||
|
||||
@@ -526,7 +543,7 @@ test-full:
|
||||
test-full-386:
|
||||
GOEXPERIMENT=synctest GOARCH=386 go test -coverprofile=coverage.txt -covermode=atomic ./lib/... ./app/...
|
||||
|
||||
integration-test: victoria-metrics vmagent vmalert vmauth
|
||||
integration-test: victoria-metrics vmagent vmalert vmauth vmctl
|
||||
go test ./apptest/... -skip="^TestCluster.*"
|
||||
|
||||
benchmark:
|
||||
@@ -555,12 +572,11 @@ app-local-goos-goarch:
|
||||
app-local-windows-goarch:
|
||||
CGO_ENABLED=0 GOOS=windows GOARCH=$(GOARCH) go build $(RACE) -ldflags "$(GO_BUILDINFO)" -o bin/$(APP_NAME)-windows-$(GOARCH)$(RACE).exe $(PKG_PREFIX)/app/$(APP_NAME)
|
||||
|
||||
quicktemplate-gen: install-qtc
|
||||
qtc
|
||||
|
||||
install-qtc:
|
||||
which qtc || go install github.com/valyala/quicktemplate/qtc@latest
|
||||
quicktemplate-gen:
|
||||
go tool qtc
|
||||
|
||||
golangci-lint:
|
||||
GOEXPERIMENT=synctest go tool golangci-lint run
|
||||
|
||||
golangci-lint: install-golangci-lint
|
||||
GOEXPERIMENT=synctest golangci-lint run
|
||||
|
||||
@@ -101,9 +101,11 @@ func (lr *LineReader) readMoreData() bool {
|
||||
|
||||
bufLen := len(lr.buf)
|
||||
if bufLen >= MaxLineSizeBytes.IntN() {
|
||||
logger.Warnf("%s: the line length exceeds -insert.maxLineSizeBytes=%d; skipping it; line contents=%q", lr.name, MaxLineSizeBytes.IntN(), lr.buf)
|
||||
ok, skippedBytes := lr.skipUntilNextLine()
|
||||
logger.Warnf("%s: the line length exceeds -insert.maxLineSizeBytes=%d; skipping it; total skipped bytes=%d",
|
||||
lr.name, MaxLineSizeBytes.IntN(), skippedBytes)
|
||||
tooLongLinesSkipped.Inc()
|
||||
return lr.skipUntilNextLine()
|
||||
return ok
|
||||
}
|
||||
|
||||
lr.buf = slicesutil.SetLength(lr.buf, MaxLineSizeBytes.IntN())
|
||||
@@ -121,26 +123,35 @@ func (lr *LineReader) readMoreData() bool {
|
||||
|
||||
var tooLongLinesSkipped = metrics.NewCounter("vl_too_long_lines_skipped_total")
|
||||
|
||||
func (lr *LineReader) skipUntilNextLine() bool {
|
||||
func (lr *LineReader) skipUntilNextLine() (bool, int) {
|
||||
|
||||
// Initialize skipped bytes count with MaxLineSizeBytes because
|
||||
// we've already read that many bytes without encountering a newline,
|
||||
// indicating the line size exceeds the maximum allowed limit.
|
||||
skipSizeBytes := MaxLineSizeBytes.IntN()
|
||||
|
||||
for {
|
||||
lr.buf = slicesutil.SetLength(lr.buf, MaxLineSizeBytes.IntN())
|
||||
n, err := lr.r.Read(lr.buf)
|
||||
skipSizeBytes += n
|
||||
lr.buf = lr.buf[:n]
|
||||
if err != nil {
|
||||
if errors.Is(err, io.EOF) {
|
||||
lr.eofReached = true
|
||||
lr.buf = lr.buf[:0]
|
||||
return true
|
||||
return true, skipSizeBytes
|
||||
}
|
||||
lr.err = fmt.Errorf("cannot skip the current line: %s", err)
|
||||
return false
|
||||
return false, skipSizeBytes
|
||||
}
|
||||
if n := bytes.IndexByte(lr.buf, '\n'); n >= 0 {
|
||||
// Include skipped bytes before \n, including the newline itself.
|
||||
skipSizeBytes += n + 1 - len(lr.buf)
|
||||
// Include \n in the buf, so too long line is replaced with an empty line.
|
||||
// This is needed for maintaining synchorinzation consistency between lines
|
||||
// in protocols such as Elasticsearch bulk import.
|
||||
lr.buf = append(lr.buf[:0], lr.buf[n:]...)
|
||||
return true
|
||||
return true, skipSizeBytes
|
||||
}
|
||||
}
|
||||
}
|
||||
|
||||
@@ -1,7 +1,6 @@
|
||||
package internalinsert
|
||||
|
||||
import (
|
||||
"flag"
|
||||
"fmt"
|
||||
"net/http"
|
||||
"time"
|
||||
@@ -18,17 +17,11 @@ import (
|
||||
)
|
||||
|
||||
var (
|
||||
disableInsert = flag.Bool("internalinsert.disable", false, "Whether to disable /internal/insert HTTP endpoint")
|
||||
maxRequestSize = flagutil.NewBytes("internalinsert.maxRequestSize", 64*1024*1024, "The maximum size in bytes of a single request, which can be accepted at /internal/insert HTTP endpoint")
|
||||
)
|
||||
|
||||
// RequestHandler processes /internal/insert requests.
|
||||
func RequestHandler(w http.ResponseWriter, r *http.Request) {
|
||||
if *disableInsert {
|
||||
httpserver.Errorf(w, r, "requests to /internal/insert are disabled with -internalinsert.disable command-line flag")
|
||||
return
|
||||
}
|
||||
|
||||
startTime := time.Now()
|
||||
if r.Method != "POST" {
|
||||
w.WriteHeader(http.StatusMethodNotAllowed)
|
||||
|
||||
@@ -1,6 +1,7 @@
|
||||
package vlinsert
|
||||
|
||||
import (
|
||||
"flag"
|
||||
"fmt"
|
||||
"net/http"
|
||||
"strings"
|
||||
@@ -13,6 +14,12 @@ import (
|
||||
"github.com/VictoriaMetrics/VictoriaMetrics/app/vlinsert/loki"
|
||||
"github.com/VictoriaMetrics/VictoriaMetrics/app/vlinsert/opentelemetry"
|
||||
"github.com/VictoriaMetrics/VictoriaMetrics/app/vlinsert/syslog"
|
||||
"github.com/VictoriaMetrics/VictoriaMetrics/lib/httpserver"
|
||||
)
|
||||
|
||||
var (
|
||||
disableInsert = flag.Bool("insert.disable", false, "Whether to disable /insert/* HTTP endpoints")
|
||||
disableInternal = flag.Bool("internalinsert.disable", false, "Whether to disable /internal/insert HTTP endpoint")
|
||||
)
|
||||
|
||||
// Init initializes vlinsert
|
||||
@@ -27,19 +34,31 @@ func Stop() {
|
||||
|
||||
// RequestHandler handles insert requests for VictoriaLogs
|
||||
func RequestHandler(w http.ResponseWriter, r *http.Request) bool {
|
||||
path := r.URL.Path
|
||||
path := strings.ReplaceAll(r.URL.Path, "//", "/")
|
||||
|
||||
if strings.HasPrefix(path, "/insert/") {
|
||||
if *disableInsert {
|
||||
httpserver.Errorf(w, r, "requests to /insert/* are disabled with -insert.disable command-line flag")
|
||||
return true
|
||||
}
|
||||
|
||||
return insertHandler(w, r, path)
|
||||
}
|
||||
|
||||
if path == "/internal/insert" {
|
||||
if *disableInternal || *disableInsert {
|
||||
httpserver.Errorf(w, r, "requests to /internal/insert are disabled with -internalinsert.disable or -insert.disable command-line flag")
|
||||
return true
|
||||
}
|
||||
internalinsert.RequestHandler(w, r)
|
||||
return true
|
||||
}
|
||||
|
||||
if !strings.HasPrefix(path, "/insert/") {
|
||||
// Skip requests, which do not start with /insert/, since these aren't our requests.
|
||||
return false
|
||||
}
|
||||
return false
|
||||
}
|
||||
|
||||
func insertHandler(w http.ResponseWriter, r *http.Request, path string) bool {
|
||||
path = strings.TrimPrefix(path, "/insert")
|
||||
path = strings.ReplaceAll(path, "//", "/")
|
||||
|
||||
switch path {
|
||||
case "/jsonline":
|
||||
@@ -69,7 +88,7 @@ func RequestHandler(w http.ResponseWriter, r *http.Request) bool {
|
||||
case strings.HasPrefix(path, "/datadog/"):
|
||||
path = strings.TrimPrefix(path, "/datadog")
|
||||
return datadog.RequestHandler(path, w, r)
|
||||
default:
|
||||
return false
|
||||
}
|
||||
|
||||
return false
|
||||
}
|
||||
|
||||
@@ -2,7 +2,6 @@ package internalselect
|
||||
|
||||
import (
|
||||
"context"
|
||||
"flag"
|
||||
"fmt"
|
||||
"net/http"
|
||||
"strconv"
|
||||
@@ -22,15 +21,8 @@ import (
|
||||
"github.com/VictoriaMetrics/VictoriaMetrics/lib/netutil"
|
||||
)
|
||||
|
||||
var disableSelect = flag.Bool("internalselect.disable", false, "Whether to disable /internal/select/* HTTP endpoints")
|
||||
|
||||
// RequestHandler processes requests to /internal/select/*
|
||||
func RequestHandler(ctx context.Context, w http.ResponseWriter, r *http.Request) {
|
||||
if *disableSelect {
|
||||
httpserver.Errorf(w, r, "requests to /internal/select/* are disabled with -internalselect.disable command-line flag")
|
||||
return
|
||||
}
|
||||
|
||||
startTime := time.Now()
|
||||
|
||||
path := r.URL.Path
|
||||
|
||||
@@ -55,7 +55,10 @@ func ProcessFacetsRequest(ctx context.Context, w http.ResponseWriter, r *http.Re
|
||||
}
|
||||
keepConstFields := httputil.GetBool(r, "keep_const_fields")
|
||||
|
||||
// Pipes must be dropped, since it is expected facets are obtained
|
||||
// from the real logs stored in the database.
|
||||
q.DropAllPipes()
|
||||
|
||||
q.AddFacetsPipe(limit, maxValuesPerField, maxValueLen, keepConstFields)
|
||||
|
||||
var mLock sync.Mutex
|
||||
@@ -156,8 +159,10 @@ func ProcessHitsRequest(ctx context.Context, w http.ResponseWriter, r *http.Requ
|
||||
fieldsLimit = 0
|
||||
}
|
||||
|
||||
// Prepare the query for hits count.
|
||||
// Pipes must be dropped, since it is expected hits are obtained
|
||||
// from the real logs stored in the database.
|
||||
q.DropAllPipes()
|
||||
|
||||
q.AddCountByTimePipe(int64(step), int64(offset), fields)
|
||||
|
||||
var mLock sync.Mutex
|
||||
@@ -290,6 +295,10 @@ func ProcessFieldNamesRequest(ctx context.Context, w http.ResponseWriter, r *htt
|
||||
return
|
||||
}
|
||||
|
||||
// Pipes must be dropped, since it is expected field names are obtained
|
||||
// from the real logs stored in the database.
|
||||
q.DropAllPipes()
|
||||
|
||||
// Obtain field names for the given query
|
||||
fieldNames, err := vlstorage.GetFieldNames(ctx, tenantIDs, q)
|
||||
if err != nil {
|
||||
@@ -329,6 +338,10 @@ func ProcessFieldValuesRequest(ctx context.Context, w http.ResponseWriter, r *ht
|
||||
limit = 0
|
||||
}
|
||||
|
||||
// Pipes must be dropped, since it is expected field values are obtained
|
||||
// from the real logs stored in the database.
|
||||
q.DropAllPipes()
|
||||
|
||||
// Obtain unique values for the given field
|
||||
values, err := vlstorage.GetFieldValues(ctx, tenantIDs, q, fieldName, uint64(limit))
|
||||
if err != nil {
|
||||
@@ -351,6 +364,10 @@ func ProcessStreamFieldNamesRequest(ctx context.Context, w http.ResponseWriter,
|
||||
return
|
||||
}
|
||||
|
||||
// Pipes must be dropped, since it is expected stream field names are obtained
|
||||
// from the real logs stored in the database.
|
||||
q.DropAllPipes()
|
||||
|
||||
// Obtain stream field names for the given query
|
||||
names, err := vlstorage.GetStreamFieldNames(ctx, tenantIDs, q)
|
||||
if err != nil {
|
||||
@@ -389,6 +406,10 @@ func ProcessStreamFieldValuesRequest(ctx context.Context, w http.ResponseWriter,
|
||||
limit = 0
|
||||
}
|
||||
|
||||
// Pipes must be dropped, since it is expected stream field values are obtained
|
||||
// from the real logs stored in the database.
|
||||
q.DropAllPipes()
|
||||
|
||||
// Obtain stream field values for the given query and the given fieldName
|
||||
values, err := vlstorage.GetStreamFieldValues(ctx, tenantIDs, q, fieldName, uint64(limit))
|
||||
if err != nil {
|
||||
@@ -420,6 +441,10 @@ func ProcessStreamIDsRequest(ctx context.Context, w http.ResponseWriter, r *http
|
||||
limit = 0
|
||||
}
|
||||
|
||||
// Pipes must be dropped, since it is expected stream ids are obtained
|
||||
// from the real logs stored in the database.
|
||||
q.DropAllPipes()
|
||||
|
||||
// Obtain streamIDs for the given query
|
||||
streamIDs, err := vlstorage.GetStreamIDs(ctx, tenantIDs, q, uint64(limit))
|
||||
if err != nil {
|
||||
@@ -451,6 +476,10 @@ func ProcessStreamsRequest(ctx context.Context, w http.ResponseWriter, r *http.R
|
||||
limit = 0
|
||||
}
|
||||
|
||||
// Pipes must be dropped, since it is expected stream are obtained
|
||||
// from the real logs stored in the database.
|
||||
q.DropAllPipes()
|
||||
|
||||
// Obtain streams for the given query
|
||||
streams, err := vlstorage.GetStreams(ctx, tenantIDs, q, uint64(limit))
|
||||
if err != nil {
|
||||
@@ -551,7 +580,7 @@ var liveTailRequests = metrics.NewCounter(`vl_live_tailing_requests`)
|
||||
const tailOffsetNsecs = 5e9
|
||||
|
||||
type logRow struct {
|
||||
timestamp string
|
||||
timestamp int64
|
||||
fields []logstorage.Field
|
||||
}
|
||||
|
||||
@@ -567,7 +596,7 @@ type tailProcessor struct {
|
||||
mu sync.Mutex
|
||||
|
||||
perStreamRows map[string][]logRow
|
||||
lastTimestamps map[string]string
|
||||
lastTimestamps map[string]int64
|
||||
|
||||
err error
|
||||
}
|
||||
@@ -577,7 +606,7 @@ func newTailProcessor(cancel func()) *tailProcessor {
|
||||
cancel: cancel,
|
||||
|
||||
perStreamRows: make(map[string][]logRow),
|
||||
lastTimestamps: make(map[string]string),
|
||||
lastTimestamps: make(map[string]int64),
|
||||
}
|
||||
}
|
||||
|
||||
@@ -594,7 +623,7 @@ func (tp *tailProcessor) writeBlock(_ uint, db *logstorage.DataBlock) {
|
||||
}
|
||||
|
||||
// Make sure columns contain _time field, since it is needed for proper tail work.
|
||||
timestamps, ok := db.GetTimestamps()
|
||||
timestamps, ok := db.GetTimestamps(nil)
|
||||
if !ok {
|
||||
tp.err = fmt.Errorf("missing _time field")
|
||||
tp.cancel()
|
||||
@@ -1043,9 +1072,7 @@ func getLastNQueryResults(ctx context.Context, tenantIDs []logstorage.TenantID,
|
||||
}
|
||||
|
||||
func getLastNRows(rows []logRow, limit int) []logRow {
|
||||
sort.Slice(rows, func(i, j int) bool {
|
||||
return rows[i].timestamp < rows[j].timestamp
|
||||
})
|
||||
sortLogRows(rows)
|
||||
if len(rows) > limit {
|
||||
rows = rows[len(rows)-limit:]
|
||||
}
|
||||
@@ -1070,7 +1097,7 @@ func getQueryResultsWithLimit(ctx context.Context, tenantIDs []logstorage.Tenant
|
||||
clonedColumnNames[i] = strings.Clone(c.Name)
|
||||
}
|
||||
|
||||
timestamps, ok := db.GetTimestamps()
|
||||
timestamps, ok := db.GetTimestamps(nil)
|
||||
if !ok {
|
||||
missingTimeColumn.Store(true)
|
||||
cancel()
|
||||
|
||||
@@ -25,6 +25,9 @@ var (
|
||||
maxQueueDuration = flag.Duration("search.maxQueueDuration", 10*time.Second, "The maximum time the search request waits for execution when -search.maxConcurrentRequests "+
|
||||
"limit is reached; see also -search.maxQueryDuration")
|
||||
maxQueryDuration = flag.Duration("search.maxQueryDuration", time.Second*30, "The maximum duration for query execution. It can be overridden to a smaller value on a per-query basis via 'timeout' query arg")
|
||||
|
||||
disableSelect = flag.Bool("select.disable", false, "Whether to disable /select/* HTTP endpoints")
|
||||
disableInternal = flag.Bool("internalselect.disable", false, "Whether to disable /internal/select/* HTTP endpoints")
|
||||
)
|
||||
|
||||
func getDefaultMaxConcurrentRequests() int {
|
||||
@@ -71,13 +74,31 @@ var vmuiFileServer = http.FileServer(http.FS(vmuiFiles))
|
||||
|
||||
// RequestHandler handles select requests for VictoriaLogs
|
||||
func RequestHandler(w http.ResponseWriter, r *http.Request) bool {
|
||||
path := r.URL.Path
|
||||
path := strings.ReplaceAll(r.URL.Path, "//", "/")
|
||||
|
||||
if !strings.HasPrefix(path, "/select/") && !strings.HasPrefix(path, "/internal/select/") {
|
||||
// Skip requests, which do not start with /select/, since these aren't our requests.
|
||||
return false
|
||||
if strings.HasPrefix(path, "/select/") {
|
||||
if *disableSelect {
|
||||
httpserver.Errorf(w, r, "requests to /select/* are disabled with -select.disable command-line flag")
|
||||
return true
|
||||
}
|
||||
|
||||
return selectHandler(w, r, path)
|
||||
}
|
||||
path = strings.ReplaceAll(path, "//", "/")
|
||||
|
||||
if strings.HasPrefix(path, "/internal/select/") {
|
||||
if *disableInternal || *disableSelect {
|
||||
httpserver.Errorf(w, r, "requests to /internal/select/* are disabled with -internalselect.disable or -select.disable command-line flag")
|
||||
return true
|
||||
}
|
||||
internalselect.RequestHandler(r.Context(), w, r)
|
||||
return true
|
||||
}
|
||||
|
||||
return false
|
||||
}
|
||||
|
||||
func selectHandler(w http.ResponseWriter, r *http.Request, path string) bool {
|
||||
ctx := r.Context()
|
||||
|
||||
if path == "/select/vmui" {
|
||||
// VMUI access via incomplete url without `/` in the end. Redirect to complete url.
|
||||
@@ -100,7 +121,6 @@ func RequestHandler(w http.ResponseWriter, r *http.Request) bool {
|
||||
return true
|
||||
}
|
||||
|
||||
ctx := r.Context()
|
||||
if path == "/select/logsql/tail" {
|
||||
logsqlTailRequests.Inc()
|
||||
// Process live tailing request without timeout, since it is OK to run live tailing requests for very long time.
|
||||
@@ -120,13 +140,6 @@ func RequestHandler(w http.ResponseWriter, r *http.Request) bool {
|
||||
}
|
||||
defer decRequestConcurrency()
|
||||
|
||||
if strings.HasPrefix(path, "/internal/select/") {
|
||||
// Process internal request from vlselect without timeout (e.g. use ctx instead of ctxWithTimeout),
|
||||
// since the timeout must be controlled by the vlselect.
|
||||
internalselect.RequestHandler(ctx, w, r)
|
||||
return true
|
||||
}
|
||||
|
||||
ok := processSelectRequest(ctxWithTimeout, w, r, path)
|
||||
if !ok {
|
||||
return false
|
||||
|
||||
@@ -248,6 +248,9 @@ func (sn *storageNode) executeRequestAt(ctx context.Context, path string, args u
|
||||
if err != nil {
|
||||
logger.Panicf("BUG: unexpected error when creating a request: %s", err)
|
||||
}
|
||||
if err := sn.ac.SetHeaders(req, true); err != nil {
|
||||
return nil, fmt.Errorf("cannot set auth headers for %q: %w", reqURL, err)
|
||||
}
|
||||
|
||||
// send the request to the storage node
|
||||
resp, err := sn.c.Do(req)
|
||||
|
||||
@@ -120,6 +120,9 @@ func normalizeURL(uOrig *url.URL) *url.URL {
|
||||
u := *uOrig
|
||||
// Prevent from attacks with using `..` in r.URL.Path
|
||||
u.Path = path.Clean(u.Path)
|
||||
if u.Path == "." {
|
||||
u.Path = "/"
|
||||
}
|
||||
if !strings.HasSuffix(u.Path, "/") && strings.HasSuffix(uOrig.Path, "/") {
|
||||
// The path.Clean() removes trailing slash.
|
||||
// Return it back if needed.
|
||||
|
||||
@@ -128,7 +128,40 @@ func TestCreateTargetURLSuccess(t *testing.T) {
|
||||
// Simple routing with `url_prefix`
|
||||
f(&UserInfo{
|
||||
URLPrefix: mustParseURL("http://foo.bar"),
|
||||
}, "", "http://foo.bar/.", "", "", nil, "least_loaded", 0)
|
||||
}, "", "http://foo.bar", "", "", nil, "least_loaded", 0)
|
||||
f(&UserInfo{
|
||||
URLPrefix: mustParseURL("http://foo.bar"),
|
||||
}, "/", "http://foo.bar", "", "", nil, "least_loaded", 0)
|
||||
f(&UserInfo{
|
||||
URLPrefix: mustParseURL("http://foo.bar"),
|
||||
}, "http://aaa///", "http://foo.bar", "", "", nil, "least_loaded", 0)
|
||||
f(&UserInfo{
|
||||
URLPrefix: mustParseURL("http://foo.bar/"),
|
||||
}, "/", "http://foo.bar/", "", "", nil, "least_loaded", 0)
|
||||
f(&UserInfo{
|
||||
URLPrefix: mustParseURL("http://foo.bar/"),
|
||||
}, "/x", "http://foo.bar/x", "", "", nil, "least_loaded", 0)
|
||||
f(&UserInfo{
|
||||
URLPrefix: mustParseURL("http://foo.bar/"),
|
||||
}, "/x/", "http://foo.bar/x/", "", "", nil, "least_loaded", 0)
|
||||
f(&UserInfo{
|
||||
URLPrefix: mustParseURL("http://foo.bar/"),
|
||||
}, "http://abc///x/", "http://foo.bar/x/", "", "", nil, "least_loaded", 0)
|
||||
f(&UserInfo{
|
||||
URLPrefix: mustParseURL("http://foo.bar/"),
|
||||
}, "http://foo//x", "http://foo.bar/x", "", "", nil, "least_loaded", 0)
|
||||
f(&UserInfo{
|
||||
URLPrefix: mustParseURL("http://foo.bar/baz"),
|
||||
}, "", "http://foo.bar/baz", "", "", nil, "least_loaded", 0)
|
||||
f(&UserInfo{
|
||||
URLPrefix: mustParseURL("http://foo.bar/baz"),
|
||||
}, "/", "http://foo.bar/baz", "", "", nil, "least_loaded", 0)
|
||||
f(&UserInfo{
|
||||
URLPrefix: mustParseURL("http://foo.bar/x/"),
|
||||
}, "/abc", "http://foo.bar/x/abc", "", "", nil, "least_loaded", 0)
|
||||
f(&UserInfo{
|
||||
URLPrefix: mustParseURL("http://foo.bar/x/"),
|
||||
}, "/abc/", "http://foo.bar/x/abc/", "", "", nil, "least_loaded", 0)
|
||||
f(&UserInfo{
|
||||
URLPrefix: mustParseURL("http://foo.bar"),
|
||||
HeadersConf: HeadersConf{
|
||||
@@ -149,6 +182,12 @@ func TestCreateTargetURLSuccess(t *testing.T) {
|
||||
f(&UserInfo{
|
||||
URLPrefix: mustParseURL("http://foo.bar"),
|
||||
}, "a/b?c=d", "http://foo.bar/a/b?c=d", "", "", nil, "least_loaded", 0)
|
||||
f(&UserInfo{
|
||||
URLPrefix: mustParseURL("http://foo.bar"),
|
||||
}, "/a/b?c=d", "http://foo.bar/a/b?c=d", "", "", nil, "least_loaded", 0)
|
||||
f(&UserInfo{
|
||||
URLPrefix: mustParseURL("http://foo.bar/"),
|
||||
}, "/a/b?c=d", "http://foo.bar/a/b?c=d", "", "", nil, "least_loaded", 0)
|
||||
f(&UserInfo{
|
||||
URLPrefix: mustParseURL("https://sss:3894/x/y"),
|
||||
}, "/z", "https://sss:3894/x/y/z", "", "", nil, "least_loaded", 0)
|
||||
|
||||
@@ -19,6 +19,7 @@ import (
|
||||
"github.com/VictoriaMetrics/VictoriaMetrics/app/vmctl/barpool"
|
||||
"github.com/VictoriaMetrics/VictoriaMetrics/app/vmctl/native"
|
||||
"github.com/VictoriaMetrics/VictoriaMetrics/app/vmctl/remoteread"
|
||||
"github.com/VictoriaMetrics/VictoriaMetrics/lib/netutil"
|
||||
|
||||
"github.com/VictoriaMetrics/VictoriaMetrics/app/vmctl/influx"
|
||||
"github.com/VictoriaMetrics/VictoriaMetrics/app/vmctl/opentsdb"
|
||||
@@ -44,6 +45,7 @@ func main() {
|
||||
if c.Bool(globalDisableProgressBar) {
|
||||
barpool.Disable(true)
|
||||
}
|
||||
netutil.EnableIPv6()
|
||||
return nil
|
||||
}
|
||||
app := &cli.App{
|
||||
|
||||
@@ -1,215 +0,0 @@
|
||||
package main
|
||||
|
||||
import (
|
||||
"context"
|
||||
"fmt"
|
||||
"log"
|
||||
"os"
|
||||
"testing"
|
||||
"time"
|
||||
|
||||
"github.com/prometheus/prometheus/model/labels"
|
||||
"github.com/prometheus/prometheus/storage"
|
||||
"github.com/prometheus/prometheus/tsdb"
|
||||
"github.com/prometheus/prometheus/tsdb/chunkenc"
|
||||
|
||||
"github.com/VictoriaMetrics/VictoriaMetrics/app/vmctl/backoff"
|
||||
"github.com/VictoriaMetrics/VictoriaMetrics/app/vmctl/barpool"
|
||||
"github.com/VictoriaMetrics/VictoriaMetrics/app/vmctl/prometheus"
|
||||
remote_read_integration "github.com/VictoriaMetrics/VictoriaMetrics/app/vmctl/testdata/servers_integration_test"
|
||||
"github.com/VictoriaMetrics/VictoriaMetrics/app/vmctl/vm"
|
||||
"github.com/VictoriaMetrics/VictoriaMetrics/app/vmselect/promql"
|
||||
"github.com/VictoriaMetrics/VictoriaMetrics/app/vmstorage"
|
||||
)
|
||||
|
||||
const (
|
||||
testSnapshot = "./testdata/snapshots/20250118T124506Z-59d1b952d7eaf547"
|
||||
blockData = "./testdata/snapshots/20250118T124506Z-59d1b952d7eaf547/01JHWQ445Y2P1TDYB05AEKD6MC"
|
||||
)
|
||||
|
||||
// This test simulates close process if user abort it
|
||||
func TestPrometheusProcessorRun(t *testing.T) {
|
||||
|
||||
f := func(startStr, endStr string, numOfSeries int, resultExpected []vm.TimeSeries) {
|
||||
t.Helper()
|
||||
|
||||
dst := remote_read_integration.NewRemoteWriteServer(t)
|
||||
|
||||
defer func() {
|
||||
dst.Close()
|
||||
}()
|
||||
|
||||
dst.Series(resultExpected)
|
||||
dst.ExpectedSeries(resultExpected)
|
||||
|
||||
if err := fillStorage(resultExpected); err != nil {
|
||||
t.Fatalf("cannot fill storage: %s", err)
|
||||
}
|
||||
|
||||
isSilent = true
|
||||
defer func() { isSilent = false }()
|
||||
|
||||
bf, err := backoff.New(1, 1.8, time.Second*2)
|
||||
if err != nil {
|
||||
t.Fatalf("cannot create backoff: %s", err)
|
||||
}
|
||||
|
||||
importerCfg := vm.Config{
|
||||
Addr: dst.URL(),
|
||||
Transport: nil,
|
||||
Concurrency: 1,
|
||||
Backoff: bf,
|
||||
}
|
||||
|
||||
ctx := context.Background()
|
||||
importer, err := vm.NewImporter(ctx, importerCfg)
|
||||
if err != nil {
|
||||
t.Fatalf("cannot create importer: %s", err)
|
||||
}
|
||||
defer importer.Close()
|
||||
|
||||
matchName := "__name__"
|
||||
matchValue := ".*"
|
||||
filter := prometheus.Filter{
|
||||
TimeMin: startStr,
|
||||
TimeMax: endStr,
|
||||
Label: matchName,
|
||||
LabelValue: matchValue,
|
||||
}
|
||||
|
||||
runner, err := prometheus.NewClient(prometheus.Config{
|
||||
Snapshot: testSnapshot,
|
||||
Filter: filter,
|
||||
})
|
||||
if err != nil {
|
||||
t.Fatalf("cannot create prometheus client: %s", err)
|
||||
}
|
||||
p := &prometheusProcessor{
|
||||
cl: runner,
|
||||
im: importer,
|
||||
cc: 1,
|
||||
}
|
||||
|
||||
if err := p.run(); err != nil {
|
||||
t.Fatalf("run() error: %s", err)
|
||||
}
|
||||
|
||||
collectedTs := dst.GetCollectedTimeSeries()
|
||||
t.Logf("collected timeseries: %d; expected timeseries: %d", len(collectedTs), len(resultExpected))
|
||||
if len(collectedTs) != len(resultExpected) {
|
||||
t.Fatalf("unexpected number of collected time series; got %d; want %d", len(collectedTs), numOfSeries)
|
||||
}
|
||||
|
||||
deleted, err := deleteSeries(matchName, matchValue)
|
||||
if err != nil {
|
||||
t.Fatalf("cannot delete series: %s", err)
|
||||
}
|
||||
if deleted != numOfSeries {
|
||||
t.Fatalf("unexpected number of deleted series; got %d; want %d", deleted, numOfSeries)
|
||||
}
|
||||
}
|
||||
|
||||
processFlags()
|
||||
vmstorage.Init(promql.ResetRollupResultCacheIfNeeded)
|
||||
defer func() {
|
||||
vmstorage.Stop()
|
||||
if err := os.RemoveAll(storagePath); err != nil {
|
||||
log.Fatalf("cannot remove %q: %s", storagePath, err)
|
||||
}
|
||||
}()
|
||||
|
||||
barpool.Disable(true)
|
||||
defer func() {
|
||||
barpool.Disable(false)
|
||||
}()
|
||||
|
||||
b, err := tsdb.OpenBlock(nil, blockData, nil, nil)
|
||||
if err != nil {
|
||||
t.Fatalf("cannot open block: %s", err)
|
||||
}
|
||||
// timestamp is equal to minTime and maxTime from meta.json
|
||||
ss, err := readBlock(b, 1737204082361, 1737204302539)
|
||||
if err != nil {
|
||||
t.Fatalf("cannot read block: %s", err)
|
||||
}
|
||||
|
||||
resultExpected, err := prepareExpectedData(ss)
|
||||
if err != nil {
|
||||
t.Fatalf("cannot prepare expected data: %s", err)
|
||||
}
|
||||
|
||||
f("2025-01-18T12:40:00Z", "2025-01-18T12:46:00Z", 2792, resultExpected)
|
||||
}
|
||||
|
||||
func readBlock(b tsdb.BlockReader, timeMin int64, timeMax int64) (storage.SeriesSet, error) {
|
||||
minTime, maxTime := b.Meta().MinTime, b.Meta().MaxTime
|
||||
|
||||
if timeMin != 0 {
|
||||
minTime = timeMin
|
||||
}
|
||||
if timeMax != 0 {
|
||||
maxTime = timeMax
|
||||
}
|
||||
|
||||
q, err := tsdb.NewBlockQuerier(b, minTime, maxTime)
|
||||
if err != nil {
|
||||
return nil, err
|
||||
}
|
||||
matchName := "__name__"
|
||||
matchValue := ".*"
|
||||
ctx := context.Background()
|
||||
ss := q.Select(ctx, false, nil, labels.MustNewMatcher(labels.MatchRegexp, matchName, matchValue))
|
||||
return ss, nil
|
||||
}
|
||||
|
||||
func prepareExpectedData(ss storage.SeriesSet) ([]vm.TimeSeries, error) {
|
||||
var expectedSeriesSet []vm.TimeSeries
|
||||
var it chunkenc.Iterator
|
||||
for ss.Next() {
|
||||
var name string
|
||||
var labelPairs []vm.LabelPair
|
||||
series := ss.At()
|
||||
|
||||
for _, label := range series.Labels() {
|
||||
if label.Name == "__name__" {
|
||||
name = label.Value
|
||||
continue
|
||||
}
|
||||
labelPairs = append(labelPairs, vm.LabelPair{
|
||||
Name: label.Name,
|
||||
Value: label.Value,
|
||||
})
|
||||
}
|
||||
if name == "" {
|
||||
return nil, fmt.Errorf("failed to find `__name__` label in labelset for block")
|
||||
}
|
||||
|
||||
var timestamps []int64
|
||||
var values []float64
|
||||
it = series.Iterator(it)
|
||||
for {
|
||||
typ := it.Next()
|
||||
if typ == chunkenc.ValNone {
|
||||
break
|
||||
}
|
||||
if typ != chunkenc.ValFloat {
|
||||
// Skip unsupported values
|
||||
continue
|
||||
}
|
||||
t, v := it.At()
|
||||
timestamps = append(timestamps, t)
|
||||
values = append(values, v)
|
||||
}
|
||||
if err := it.Err(); err != nil {
|
||||
return nil, err
|
||||
}
|
||||
ts := vm.TimeSeries{
|
||||
Name: name,
|
||||
LabelPairs: labelPairs,
|
||||
Timestamps: timestamps,
|
||||
Values: values,
|
||||
}
|
||||
expectedSeriesSet = append(expectedSeriesSet, ts)
|
||||
}
|
||||
return expectedSeriesSet, nil
|
||||
}
|
||||
Binary file not shown.
Binary file not shown.
@@ -1,17 +0,0 @@
|
||||
{
|
||||
"ulid": "01JHWQ445Y2P1TDYB05AEKD6MC",
|
||||
"minTime": 1737204082361,
|
||||
"maxTime": 1737204302539,
|
||||
"stats": {
|
||||
"numSamples": 60275,
|
||||
"numSeries": 2792,
|
||||
"numChunks": 2792
|
||||
},
|
||||
"compaction": {
|
||||
"level": 1,
|
||||
"sources": [
|
||||
"01JHWQ445Y2P1TDYB05AEKD6MC"
|
||||
]
|
||||
},
|
||||
"version": 1
|
||||
}
|
||||
@@ -5,8 +5,10 @@ import (
|
||||
"strings"
|
||||
"unsafe"
|
||||
|
||||
"github.com/VictoriaMetrics/VictoriaMetrics/app/vmselect/netstorage"
|
||||
"github.com/VictoriaMetrics/metricsql"
|
||||
|
||||
"github.com/VictoriaMetrics/VictoriaMetrics/app/vmselect/netstorage"
|
||||
"github.com/VictoriaMetrics/VictoriaMetrics/lib/atomicutil"
|
||||
)
|
||||
|
||||
// callbacks for optimized incremental calculations for aggregate functions
|
||||
@@ -66,9 +68,8 @@ var incrementalAggrFuncCallbacksMap = map[string]*incrementalAggrFuncCallbacks{
|
||||
type incrementalAggrContextMap struct {
|
||||
m map[string]*incrementalAggrContext
|
||||
|
||||
// The padding prevents false sharing on widespread platforms with
|
||||
// 128 mod (cache line size) = 0 .
|
||||
_ [128 - unsafe.Sizeof(map[string]*incrementalAggrContext{})%128]byte
|
||||
// The padding prevents false sharing
|
||||
_ [atomicutil.CacheLineSize - unsafe.Sizeof(map[string]*incrementalAggrContext{})%atomicutil.CacheLineSize]byte
|
||||
}
|
||||
|
||||
type incrementalAggrFuncContext struct {
|
||||
|
||||
@@ -17,6 +17,7 @@ import (
|
||||
|
||||
"github.com/VictoriaMetrics/VictoriaMetrics/app/vmselect/netstorage"
|
||||
"github.com/VictoriaMetrics/VictoriaMetrics/app/vmselect/searchutil"
|
||||
"github.com/VictoriaMetrics/VictoriaMetrics/lib/atomicutil"
|
||||
"github.com/VictoriaMetrics/VictoriaMetrics/lib/bytesutil"
|
||||
"github.com/VictoriaMetrics/VictoriaMetrics/lib/cgroup"
|
||||
"github.com/VictoriaMetrics/VictoriaMetrics/lib/decimal"
|
||||
@@ -1885,9 +1886,8 @@ func doRollupForTimeseries(funcName string, keepMetricNames bool, rc *rollupConf
|
||||
type timeseriesWithPadding struct {
|
||||
tss []*timeseries
|
||||
|
||||
// The padding prevents false sharing on widespread platforms with
|
||||
// 128 mod (cache line size) = 0 .
|
||||
_ [128 - unsafe.Sizeof([]*timeseries{})%128]byte
|
||||
// The padding prevents false sharing
|
||||
_ [atomicutil.CacheLineSize - unsafe.Sizeof([]*timeseries{})%atomicutil.CacheLineSize]byte
|
||||
}
|
||||
|
||||
type timeseriesByWorkerID struct {
|
||||
|
||||
@@ -10,6 +10,8 @@ import { useSearchParams } from "react-router-dom";
|
||||
import throttle from "lodash/throttle";
|
||||
import GroupLogsItem from "../../../GroupLogs/GroupLogsItem";
|
||||
import LiveTailingSettings from "./LiveTailingSettings";
|
||||
import Alert from "../../../../../components/Main/Alert/Alert";
|
||||
import { isDecreasing } from "../../../../../utils/array";
|
||||
|
||||
const SCROLL_THRESHOLD = 100;
|
||||
const scrollToBottom = () => window.scrollTo({
|
||||
@@ -36,7 +38,8 @@ const LiveTailingView: FC<ViewProps> = ({ settingsRef }) => {
|
||||
stopLiveTailing,
|
||||
pauseLiveTailing,
|
||||
resumeLiveTailing,
|
||||
clearLogs
|
||||
clearLogs,
|
||||
isLimitedLogsPerUpdate
|
||||
} = useLiveTailingLogs(query, rowsPerPage);
|
||||
|
||||
const displayFieldsString = searchParams.get(LOGS_URL_PARAMS.DISPLAY_FIELDS) || LOGS_DISPLAY_FIELDS;
|
||||
@@ -64,13 +67,17 @@ const LiveTailingView: FC<ViewProps> = ({ settingsRef }) => {
|
||||
const container = containerRef.current;
|
||||
if (!container) return;
|
||||
|
||||
let prevScrollTop: number[] = [];
|
||||
const handleScroll = () => {
|
||||
const { scrollTop, scrollHeight, clientHeight } = document.documentElement;
|
||||
const isBottom = Math.abs(scrollHeight - scrollTop - clientHeight) < SCROLL_THRESHOLD;
|
||||
|
||||
setIsAtBottom(isBottom);
|
||||
prevScrollTop.push(scrollTop);
|
||||
prevScrollTop = prevScrollTop.slice(-3);
|
||||
const isMoveToTop = isDecreasing(prevScrollTop);
|
||||
|
||||
if (!isBottom && !isPaused) {
|
||||
if (!isBottom && !isPaused && isMoveToTop) {
|
||||
pauseLiveTailing();
|
||||
}
|
||||
};
|
||||
@@ -89,8 +96,6 @@ const LiveTailingView: FC<ViewProps> = ({ settingsRef }) => {
|
||||
handleResumeLiveTailing();
|
||||
}, [rowsPerPage]);
|
||||
|
||||
|
||||
|
||||
if (error) {
|
||||
return <div className="vm-live-tailing-view__error">{error}</div>;
|
||||
}
|
||||
@@ -138,6 +143,7 @@ const LiveTailingView: FC<ViewProps> = ({ settingsRef }) => {
|
||||
</div>
|
||||
)}
|
||||
</div>
|
||||
{isLimitedLogsPerUpdate && (<Alert variant="warning">Too many logs per second detected. Large volumes of log data are difficult to process and may impact performance. We recommend adding filters to your query for better analysis and system performance.</Alert>)}
|
||||
</>
|
||||
);
|
||||
};
|
||||
|
||||
@@ -34,9 +34,9 @@
|
||||
width: 100%;
|
||||
height: 100%;
|
||||
overflow: auto;
|
||||
padding: $padding-global;
|
||||
min-height: 200px;
|
||||
font-family: $font-family-monospace;
|
||||
padding-bottom: $padding-medium;
|
||||
}
|
||||
|
||||
&__empty {
|
||||
|
||||
@@ -0,0 +1,147 @@
|
||||
import { act, renderHook } from "@testing-library/preact";
|
||||
import { useLiveTailingLogs } from "./useLiveTailingLogs";
|
||||
import { vi } from "vitest";
|
||||
|
||||
vi.mock("../../../../../state/common/StateContext", () => ({
|
||||
useAppState: () => ({ serverUrl: "http://localhost:8080" }),
|
||||
}));
|
||||
|
||||
vi.mock("../../../../../hooks/useTenant", () => ({
|
||||
useTenant: () => ({}),
|
||||
}));
|
||||
|
||||
// Mock dependencies
|
||||
const mockFetch = vi.fn();
|
||||
global.fetch = mockFetch;
|
||||
|
||||
const createMockStreamResponse = (logs: string[], sendCount: number = 1) => ({
|
||||
ok: true,
|
||||
body: new ReadableStream({
|
||||
async start(controller) {
|
||||
for (let i = 0; i < sendCount; i++) {
|
||||
logs.forEach((log) => {
|
||||
controller.enqueue(new TextEncoder().encode(log + "\n"));
|
||||
});
|
||||
await new Promise((resolve) => setTimeout(resolve, 1000));
|
||||
}
|
||||
|
||||
controller.close();
|
||||
},
|
||||
}),
|
||||
text: async () => logs.join("\n"),
|
||||
});
|
||||
|
||||
describe("useLiveTailingLogs", () => {
|
||||
afterEach(() => {
|
||||
vi.restoreAllMocks();
|
||||
vi.clearAllMocks();
|
||||
});
|
||||
|
||||
it("should start live tailing and process logs", async () => {
|
||||
const query = "*";
|
||||
const limit = 10;
|
||||
const { result } = renderHook(() => useLiveTailingLogs(query, limit));
|
||||
|
||||
mockFetch.mockResolvedValue(createMockStreamResponse(["{\"logs\":\"test log\"}"]));
|
||||
|
||||
await act(async () => {
|
||||
const started = await result.current.startLiveTailing();
|
||||
expect(started).toBe(true);
|
||||
});
|
||||
|
||||
expect(mockFetch).toHaveBeenCalledTimes(1);
|
||||
expect(mockFetch).toHaveBeenCalledWith(
|
||||
"http://localhost:8080/select/logsql/tail",
|
||||
expect.objectContaining({
|
||||
method: "POST",
|
||||
body: new URLSearchParams({
|
||||
query: query.trim(),
|
||||
}),
|
||||
})
|
||||
);
|
||||
});
|
||||
|
||||
it("should pause and resume live tailing", () => {
|
||||
const query = "*";
|
||||
const limit = 10;
|
||||
const { result } = renderHook(() => useLiveTailingLogs(query, limit));
|
||||
|
||||
act(() => {
|
||||
result.current.pauseLiveTailing();
|
||||
});
|
||||
|
||||
expect(result.current.isPaused).toBe(true);
|
||||
|
||||
act(() => {
|
||||
result.current.resumeLiveTailing();
|
||||
});
|
||||
|
||||
expect(result.current.isPaused).toBe(false);
|
||||
});
|
||||
|
||||
it("should stop live tailing", async () => {
|
||||
const query = "*";
|
||||
const limit = 10;
|
||||
const { result } = renderHook(() => useLiveTailingLogs(query, limit));
|
||||
|
||||
act(() => {
|
||||
result.current.stopLiveTailing();
|
||||
});
|
||||
|
||||
expect(result.current.logs).toHaveLength(0);
|
||||
});
|
||||
|
||||
it("should clear logs", () => {
|
||||
const query = "*";
|
||||
const limit = 10;
|
||||
const { result } = renderHook(() => useLiveTailingLogs(query, limit));
|
||||
|
||||
act(() => {
|
||||
result.current.clearLogs();
|
||||
});
|
||||
|
||||
expect(result.current.logs).toEqual([]);
|
||||
});
|
||||
|
||||
it("should handle errors during live tailing", async () => {
|
||||
const query = "*";
|
||||
const limit = 10;
|
||||
const { result } = renderHook(() => useLiveTailingLogs(query, limit));
|
||||
|
||||
mockFetch.mockRejectedValue(new Error("Network error"));
|
||||
|
||||
await act(async () => {
|
||||
const started = await result.current.startLiveTailing();
|
||||
expect(started).toBe(false);
|
||||
});
|
||||
|
||||
expect(result.current.error).toBe("Error: Network error");
|
||||
expect(result.current.logs).toHaveLength(0);
|
||||
});
|
||||
|
||||
it("should process high load of logs incoming at 100k logs per second", async () => {
|
||||
const query = "*";
|
||||
const limit = 1000;
|
||||
const logCount = 10000; // High log rate
|
||||
const logs = Array.from({ length: logCount }, (_, i) => `{"log": "log message ${i}"}`);
|
||||
const { result } = renderHook(() => useLiveTailingLogs(query, limit));
|
||||
|
||||
mockFetch.mockResolvedValue(createMockStreamResponse(logs, 7));
|
||||
|
||||
await act(async () => {
|
||||
const started = await result.current.startLiveTailing();
|
||||
expect(started).toBe(true);
|
||||
});
|
||||
|
||||
// Wait for logs to process
|
||||
await new Promise((resolve) => setTimeout(resolve, 7000));
|
||||
|
||||
// Verify logs are limited and processed correctly
|
||||
expect(result.current.logs.length).toBeLessThanOrEqual(limit);
|
||||
// After setting flag isLimitedLogsPerUpdate when more than 200 logs received 5 times in a row,
|
||||
// we take only the last 200 logs, so we get 800 older logs (9200 - 9999) and 200 new logs (9800-9999)
|
||||
expect(result.current.logs[0].log).toStrictEqual("log message 9200");
|
||||
expect(result.current.logs[799].log).toStrictEqual("log message 9999");
|
||||
expect(result.current.isLimitedLogsPerUpdate).toBeTruthy();
|
||||
}, { timeout: 9000 });
|
||||
});
|
||||
@@ -2,22 +2,161 @@ import { useCallback, useEffect, useRef, useState } from "preact/compat";
|
||||
import { ErrorTypes } from "../../../../../types";
|
||||
import { Logs } from "../../../../../api/types";
|
||||
import { useAppState } from "../../../../../state/common/StateContext";
|
||||
import { useSearchParams } from "react-router-dom";
|
||||
import useBoolean from "../../../../../hooks/useBoolean";
|
||||
import { useTenant } from "../../../../../hooks/useTenant";
|
||||
|
||||
/**
|
||||
* Defines the maximum number of consecutive times logs can be fetched above the threshold
|
||||
* before showing a warning notification, and vice versa:
|
||||
* - If logs are fetched above a threshold this many times in a row -> show warning
|
||||
* - If warning is shown, it won't disappear until logs are fetched below a threshold
|
||||
* this many times in a row
|
||||
*
|
||||
* This threshold helps optimize log display performance when dealing with large volumes of logs.
|
||||
* If the threshold is consistently exceeded, users will be prompted to add filters to their query
|
||||
* for better system performance and more focused log analysis.
|
||||
*/
|
||||
const MAX_ATTEMPTS_FETCH_LOGS_PER_SECOND = 5;
|
||||
/**
|
||||
* Defines the log's threshold, after which will be shown a warning notification
|
||||
*/
|
||||
const LOGS_THRESHOLD = 200;
|
||||
const CONNECTION_TIMEOUT_MS = 5000;
|
||||
const PROCESSING_INTERVAL_MS = 1000;
|
||||
|
||||
const createStreamProcessor = (
|
||||
bufferRef: React.MutableRefObject<string>,
|
||||
bufferLinesRef: React.MutableRefObject<string[]>,
|
||||
setError: (error: string) => void,
|
||||
restartTailing: () => Promise<boolean>
|
||||
) => {
|
||||
return async (reader: ReadableStreamDefaultReader<Uint8Array>) => {
|
||||
let lastDataTime = Date.now();
|
||||
|
||||
const connectionCheckInterval = setInterval(() => {
|
||||
const timeSinceLastData = Date.now() - lastDataTime;
|
||||
if (timeSinceLastData > CONNECTION_TIMEOUT_MS) {
|
||||
clearInterval(connectionCheckInterval);
|
||||
restartTailing();
|
||||
return;
|
||||
}
|
||||
}, CONNECTION_TIMEOUT_MS);
|
||||
|
||||
try {
|
||||
while (true) {
|
||||
const { done, value } = await reader.read();
|
||||
if (done) break;
|
||||
lastDataTime = Date.now();
|
||||
|
||||
const chunk = new TextDecoder().decode(value);
|
||||
const lines = (bufferRef.current + chunk).split("\n");
|
||||
bufferRef.current = lines.pop() || "";
|
||||
bufferLinesRef.current = [...bufferLinesRef.current, ...lines];
|
||||
}
|
||||
} catch (e) {
|
||||
if (e instanceof Error && e.name !== "AbortError") {
|
||||
console.error("Stream processing error:", e);
|
||||
setError(String(e));
|
||||
}
|
||||
} finally {
|
||||
clearInterval(connectionCheckInterval);
|
||||
}
|
||||
};
|
||||
};
|
||||
|
||||
const updateLimitModeTracking = (
|
||||
linesCount: number,
|
||||
attemptsFetchLimitRef: React.MutableRefObject<number>,
|
||||
attemptsFetchLowRef: React.MutableRefObject<number>,
|
||||
isLimitedLogsPerUpdate: boolean,
|
||||
) => {
|
||||
if (linesCount > LOGS_THRESHOLD) {
|
||||
attemptsFetchLimitRef.current++;
|
||||
attemptsFetchLowRef.current = 0;
|
||||
} else {
|
||||
attemptsFetchLowRef.current++;
|
||||
attemptsFetchLimitRef.current = 0;
|
||||
}
|
||||
|
||||
if (attemptsFetchLimitRef.current > MAX_ATTEMPTS_FETCH_LOGS_PER_SECOND) {
|
||||
return true;
|
||||
}
|
||||
|
||||
if (attemptsFetchLowRef.current > MAX_ATTEMPTS_FETCH_LOGS_PER_SECOND) {
|
||||
return false;
|
||||
}
|
||||
|
||||
return isLimitedLogsPerUpdate;
|
||||
};
|
||||
|
||||
const parseLogLines = (lines: string[], counterRef: React.MutableRefObject<bigint>): Logs[] => {
|
||||
return lines
|
||||
.map(line => {
|
||||
try {
|
||||
const parsedLine = line && JSON.parse(line);
|
||||
parsedLine._log_id = counterRef.current++;
|
||||
return parsedLine;
|
||||
} catch (e) {
|
||||
console.error(`Failed to parse "${line}" to JSON\n`, e);
|
||||
return null;
|
||||
}
|
||||
})
|
||||
.filter(Boolean) as Logs[];
|
||||
};
|
||||
|
||||
interface ProcessBufferedLogsParams {
|
||||
lines: string[];
|
||||
limit: number;
|
||||
counterRef: React.MutableRefObject<bigint>;
|
||||
attemptsFetchLimitRef: React.MutableRefObject<number>;
|
||||
attemptsFetchLowRef: React.MutableRefObject<number>;
|
||||
setIsLimitedLogsPerUpdate: (isLimited: boolean) => void;
|
||||
setLogs: React.Dispatch<React.SetStateAction<Logs[]>>;
|
||||
bufferLinesRef: React.MutableRefObject<string[]>;
|
||||
isLimitedLogsPerUpdate: boolean;
|
||||
}
|
||||
|
||||
const processBufferedLogs = ({
|
||||
lines,
|
||||
limit,
|
||||
counterRef,
|
||||
attemptsFetchLimitRef,
|
||||
attemptsFetchLowRef,
|
||||
setIsLimitedLogsPerUpdate,
|
||||
setLogs,
|
||||
bufferLinesRef,
|
||||
isLimitedLogsPerUpdate
|
||||
}: ProcessBufferedLogsParams) => {
|
||||
|
||||
const isLimitLogsMode = updateLimitModeTracking(lines.length, attemptsFetchLimitRef, attemptsFetchLowRef, isLimitedLogsPerUpdate);
|
||||
const limitedLines = isLimitLogsMode && lines.length > LOGS_THRESHOLD ? lines.slice(-LOGS_THRESHOLD) : lines;
|
||||
const newLogs = parseLogLines(limitedLines, counterRef);
|
||||
|
||||
setIsLimitedLogsPerUpdate(isLimitLogsMode);
|
||||
setLogs(prevLogs => {
|
||||
const combinedLogs = [...prevLogs, ...newLogs];
|
||||
return combinedLogs.length > limit ? combinedLogs.slice(-limit) : combinedLogs;
|
||||
});
|
||||
bufferLinesRef.current = [];
|
||||
};
|
||||
|
||||
export const useLiveTailingLogs = (query: string, limit: number) => {
|
||||
const { serverUrl } = useAppState();
|
||||
const [searchParams] = useSearchParams();
|
||||
|
||||
const [logs, setLogs] = useState<Logs[]>([]);
|
||||
const { value: isPaused, setTrue: pauseLiveTailing, setFalse: resumeLiveTailing } = useBoolean(false);
|
||||
const tenant = useTenant();
|
||||
const [error, setError] = useState<ErrorTypes | string>();
|
||||
const [isLimitedLogsPerUpdate, setIsLimitedLogsPerUpdate] = useState(false);
|
||||
|
||||
const counterRef = useRef<bigint>(0n);
|
||||
const abortControllerRef = useRef(new AbortController());
|
||||
const readerRef = useRef<ReadableStreamDefaultReader<Uint8Array> | null>(null);
|
||||
const intervalRef = useRef<ReturnType<typeof setInterval> | null>(null);
|
||||
const bufferRef = useRef<string>("");
|
||||
const bufferLinesRef = useRef<string[]>([]);
|
||||
const attemptsFetchLimitLogsPerSecondCountRef = useRef<number>(0);
|
||||
const attemptsFetchLowLogsPerSecondCountRef = useRef<number>(0);
|
||||
|
||||
const stopLiveTailing = useCallback(() => {
|
||||
if (readerRef.current) {
|
||||
@@ -40,13 +179,8 @@ export const useLiveTailingLogs = (query: string, limit: number) => {
|
||||
const { signal } = abortControllerRef.current;
|
||||
|
||||
setError(undefined);
|
||||
setLogs([]);
|
||||
|
||||
try {
|
||||
const tenant = {
|
||||
AccountID: searchParams.get("accountID") || "0",
|
||||
ProjectID: searchParams.get("projectID") || "0"
|
||||
};
|
||||
const response = await fetch(`${serverUrl}/select/logsql/tail`, {
|
||||
signal,
|
||||
method: "POST",
|
||||
@@ -68,25 +202,14 @@ export const useLiveTailingLogs = (query: string, limit: number) => {
|
||||
const reader = response.body.getReader();
|
||||
readerRef.current = reader;
|
||||
|
||||
const processStream = async () => {
|
||||
try {
|
||||
while (true) {
|
||||
const { done, value } = await reader.read();
|
||||
if (done) break;
|
||||
const processStream = createStreamProcessor(
|
||||
bufferRef,
|
||||
bufferLinesRef,
|
||||
setError,
|
||||
startLiveTailing
|
||||
);
|
||||
|
||||
// Convert the Uint8Array to a string
|
||||
const chunk = new TextDecoder().decode(value);
|
||||
bufferRef.current += chunk;
|
||||
}
|
||||
} catch (e) {
|
||||
if (e instanceof Error && e.name !== "AbortError") {
|
||||
console.error("Stream processing error:", e);
|
||||
setError(String(e));
|
||||
}
|
||||
}
|
||||
};
|
||||
|
||||
processStream();
|
||||
processStream(reader);
|
||||
return true;
|
||||
} catch (e) {
|
||||
if (e instanceof Error && e.name !== "AbortError") {
|
||||
@@ -98,42 +221,35 @@ export const useLiveTailingLogs = (query: string, limit: number) => {
|
||||
}
|
||||
}, [query, stopLiveTailing]);
|
||||
|
||||
|
||||
useEffect(() => {
|
||||
if (isPaused) return;
|
||||
if (isPaused) {
|
||||
const pauseTimerId = setInterval(() => {
|
||||
if (bufferLinesRef.current.length > limit) {
|
||||
bufferLinesRef.current = bufferLinesRef.current.slice(-limit);
|
||||
}
|
||||
}, PROCESSING_INTERVAL_MS);
|
||||
return () => {
|
||||
clearInterval(pauseTimerId);
|
||||
};
|
||||
}
|
||||
|
||||
/**
|
||||
* Process incoming log data at a throttled rate (every 1s)
|
||||
* This interval-based approach prevents CPU overload by:
|
||||
* 1. Batching log processing instead of processing each chunk immediately
|
||||
* 2. Limiting UI updates to a reasonable frequency (1/sec) even when data streams in rapidly
|
||||
* 3. Reducing performance impact when handling large volumes of incoming logs
|
||||
* 4. Allowing efficient garbage collection between processing cycles
|
||||
*/
|
||||
const timerId = setInterval(() => {
|
||||
const lines = bufferRef.current.split("\n");
|
||||
bufferRef.current = lines.pop() || "";
|
||||
|
||||
const newLogs = lines
|
||||
.map(line => {
|
||||
try {
|
||||
const parsedLine = line && JSON.parse(line);
|
||||
parsedLine._log_id = counterRef.current++;
|
||||
return parsedLine;
|
||||
} catch (e) {
|
||||
console.error(`Failed to parse "${line}" to JSON\n`, e);
|
||||
return null;
|
||||
}
|
||||
})
|
||||
.filter(Boolean) as Logs[];
|
||||
|
||||
setLogs(prevLogs => {
|
||||
const combinedLogs = [...prevLogs, ...newLogs];
|
||||
return combinedLogs.length > limit ? combinedLogs.slice(-limit) : combinedLogs;
|
||||
const lines = bufferLinesRef.current;
|
||||
processBufferedLogs({
|
||||
lines,
|
||||
limit,
|
||||
counterRef,
|
||||
attemptsFetchLimitRef: attemptsFetchLimitLogsPerSecondCountRef,
|
||||
attemptsFetchLowRef: attemptsFetchLowLogsPerSecondCountRef,
|
||||
setIsLimitedLogsPerUpdate,
|
||||
isLimitedLogsPerUpdate,
|
||||
setLogs,
|
||||
bufferLinesRef
|
||||
});
|
||||
}, 1000);
|
||||
}, PROCESSING_INTERVAL_MS);
|
||||
|
||||
return () => clearInterval(timerId);
|
||||
}, [limit, isPaused]);
|
||||
}, [limit, isPaused, isLimitedLogsPerUpdate]);
|
||||
|
||||
const clearLogs = useCallback(() => {
|
||||
setLogs([]);
|
||||
@@ -147,6 +263,7 @@ export const useLiveTailingLogs = (query: string, limit: number) => {
|
||||
stopLiveTailing,
|
||||
pauseLiveTailing,
|
||||
resumeLiveTailing,
|
||||
clearLogs
|
||||
clearLogs,
|
||||
isLimitedLogsPerUpdate
|
||||
};
|
||||
};
|
||||
};
|
||||
|
||||
@@ -154,13 +154,13 @@ const Relabel: FC = () => {
|
||||
<div className="vm-relabeling-steps-item__row">
|
||||
<span>Input Labels:</span>
|
||||
<code>
|
||||
<pre dangerouslySetInnerHTML={{ __html: step.inLabels }}/>
|
||||
<pre dangerouslySetInnerHTML={{ __html: step.errors?.inLabels || step.inLabels }}/>
|
||||
</code>
|
||||
</div>
|
||||
<div className="vm-relabeling-steps-item__row">
|
||||
<span>Output labels:</span>
|
||||
<code>
|
||||
<pre dangerouslySetInnerHTML={{ __html: step.outLabels }}/>
|
||||
<pre dangerouslySetInnerHTML={{ __html: step.errors?.outLabels || step.outLabels }}/>
|
||||
</code>
|
||||
</div>
|
||||
</div>
|
||||
|
||||
@@ -138,6 +138,10 @@ export interface RelabelStep {
|
||||
rule: string;
|
||||
inLabels: string;
|
||||
outLabels: string;
|
||||
errors: {
|
||||
inLabels: string;
|
||||
outLabels: string;
|
||||
}
|
||||
}
|
||||
|
||||
export interface RelabelData {
|
||||
|
||||
36
app/vmui/packages/vmui/src/utils/array.test.ts
Normal file
36
app/vmui/packages/vmui/src/utils/array.test.ts
Normal file
@@ -0,0 +1,36 @@
|
||||
import { describe, expect, it } from "vitest";
|
||||
import { isDecreasing } from "./array";
|
||||
|
||||
describe("isDecreasing", () => {
|
||||
it("should return true for an array with strictly decreasing numbers", () => {
|
||||
expect(isDecreasing([5, 4, 3, 2, 1])).toBe(true);
|
||||
});
|
||||
|
||||
it("should return false for an array with increasing numbers", () => {
|
||||
expect(isDecreasing([1, 2, 3, 4, 5])).toBe(false);
|
||||
});
|
||||
|
||||
it("should return false for an array with equal consecutive numbers", () => {
|
||||
expect(isDecreasing([5, 5, 4, 3, 2])).toBe(false);
|
||||
});
|
||||
|
||||
it("should return false for an empty array", () => {
|
||||
expect(isDecreasing([])).toBe(false);
|
||||
});
|
||||
|
||||
it("should return false for an array with a single element", () => {
|
||||
expect(isDecreasing([1])).toBe(false);
|
||||
});
|
||||
|
||||
it("should return false for an array with both increasing and decreasing numbers", () => {
|
||||
expect(isDecreasing([5, 3, 4, 2, 1])).toBe(false);
|
||||
});
|
||||
|
||||
it("should return true for an array with negative strictly decreasing numbers", () => {
|
||||
expect(isDecreasing([-1, -2, -3, -4])).toBe(true);
|
||||
});
|
||||
|
||||
it("should return false for an array with a mix of positive and negative numbers that do not strictly decrease", () => {
|
||||
expect(isDecreasing([3, 2, -1, -1])).toBe(false);
|
||||
});
|
||||
});
|
||||
@@ -1,4 +1,4 @@
|
||||
export const arrayEquals = (a: (string|number)[], b: (string|number)[]) => {
|
||||
export const arrayEquals = (a: (string | number)[], b: (string | number)[]) => {
|
||||
return a.length === b.length && a.every((val, index) => val === b[index]);
|
||||
};
|
||||
|
||||
@@ -17,3 +17,8 @@ export function groupByMultipleKeys<T>(items: T[], keys: (keyof T)[]): { keys: s
|
||||
}));
|
||||
}
|
||||
|
||||
export const isDecreasing = (arr: number[]): boolean => {
|
||||
if (arr.length < 2) return false;
|
||||
|
||||
return arr.every((v, i) => i === 0 || v < arr[i - 1]);
|
||||
};
|
||||
|
||||
@@ -31,6 +31,7 @@ type app struct {
|
||||
binary string
|
||||
flags []string
|
||||
process *os.Process
|
||||
wait bool
|
||||
}
|
||||
|
||||
// appOptions holds the optional configuration of an app, such as default flags
|
||||
@@ -38,6 +39,7 @@ type app struct {
|
||||
type appOptions struct {
|
||||
defaultFlags map[string]string
|
||||
extractREs []*regexp.Regexp
|
||||
wait bool
|
||||
}
|
||||
|
||||
// startApp starts an instance of an app using the app binary file path and
|
||||
@@ -73,6 +75,7 @@ func startApp(instance string, binary string, flags []string, opts *appOptions)
|
||||
binary: binary,
|
||||
flags: flags,
|
||||
process: cmd.Process,
|
||||
wait: opts.wait,
|
||||
}
|
||||
|
||||
go app.processOutput("stdout", stdout, app.writeToStderr)
|
||||
@@ -92,7 +95,11 @@ func startApp(instance string, binary string, flags []string, opts *appOptions)
|
||||
return nil, nil, err
|
||||
}
|
||||
|
||||
return app, extracts, nil
|
||||
if app.wait {
|
||||
err = cmd.Wait()
|
||||
}
|
||||
|
||||
return app, extracts, err
|
||||
}
|
||||
|
||||
// setDefaultFlags adds flags with default values to `flags` if it does not
|
||||
@@ -112,9 +119,12 @@ func setDefaultFlags(flags []string, defaultFlags map[string]string) []string {
|
||||
return flags
|
||||
}
|
||||
|
||||
// stop sends the app process a SIGINT signal and waits until it terminates
|
||||
// Stop sends the app process a SIGINT signal and waits until it terminates
|
||||
// gracefully.
|
||||
func (app *app) Stop() {
|
||||
if app.wait {
|
||||
return
|
||||
}
|
||||
if err := app.process.Signal(os.Interrupt); err != nil {
|
||||
log.Fatalf("Could not send SIGINT signal to %s process: %v", app.instance, err)
|
||||
}
|
||||
|
||||
@@ -21,6 +21,7 @@ type PrometheusQuerier interface {
|
||||
PrometheusAPIV1Query(t *testing.T, query string, opts QueryOpts) *PrometheusAPIV1QueryResponse
|
||||
PrometheusAPIV1QueryRange(t *testing.T, query string, opts QueryOpts) *PrometheusAPIV1QueryResponse
|
||||
PrometheusAPIV1Series(t *testing.T, matchQuery string, opts QueryOpts) *PrometheusAPIV1SeriesResponse
|
||||
PrometheusAPIV1ExportNative(t *testing.T, query string, opts QueryOpts) []byte
|
||||
}
|
||||
|
||||
// Writer contains methods for writing new data
|
||||
@@ -29,6 +30,7 @@ type Writer interface {
|
||||
PrometheusAPIV1Write(t *testing.T, records []pb.TimeSeries, opts QueryOpts)
|
||||
PrometheusAPIV1ImportPrometheus(t *testing.T, records []string, opts QueryOpts)
|
||||
PrometheusAPIV1ImportCSV(t *testing.T, records []string, opts QueryOpts)
|
||||
PrometheusAPIV1ImportNative(t *testing.T, data []byte, opts QueryOpts)
|
||||
|
||||
// Graphit APIs
|
||||
GraphiteWrite(t *testing.T, records []string, opts QueryOpts)
|
||||
|
||||
@@ -7,8 +7,9 @@ import (
|
||||
"testing"
|
||||
"time"
|
||||
|
||||
"github.com/VictoriaMetrics/VictoriaMetrics/lib/fs"
|
||||
"github.com/google/go-cmp/cmp"
|
||||
|
||||
"github.com/VictoriaMetrics/VictoriaMetrics/lib/fs"
|
||||
)
|
||||
|
||||
// TestCase holds the state and defines clean-up procedure common for all test
|
||||
@@ -190,7 +191,7 @@ func (tc *TestCase) MustStartVmauth(instance string, flags []string, configFileY
|
||||
|
||||
// MustStartDefaultCluster starts a typical cluster configuration with default
|
||||
// flags.
|
||||
func (tc *TestCase) MustStartDefaultCluster() PrometheusWriteQuerier {
|
||||
func (tc *TestCase) MustStartDefaultCluster() *Vmcluster {
|
||||
tc.t.Helper()
|
||||
|
||||
return tc.MustStartCluster(&ClusterOptions{
|
||||
@@ -224,7 +225,7 @@ type ClusterOptions struct {
|
||||
}
|
||||
|
||||
// MustStartCluster starts a typical cluster configuration with custom flags.
|
||||
func (tc *TestCase) MustStartCluster(opts *ClusterOptions) PrometheusWriteQuerier {
|
||||
func (tc *TestCase) MustStartCluster(opts *ClusterOptions) *Vmcluster {
|
||||
tc.t.Helper()
|
||||
|
||||
opts.Vmstorage1Flags = append(opts.Vmstorage1Flags, []string{
|
||||
@@ -252,6 +253,18 @@ func (tc *TestCase) MustStartCluster(opts *ClusterOptions) PrometheusWriteQuerie
|
||||
return &Vmcluster{vminsert, vmselect, []*Vmstorage{vmstorage1, vmstorage2}}
|
||||
}
|
||||
|
||||
// MustStartVmctl is a test helper function that starts an instance of vmctl
|
||||
func (tc *TestCase) MustStartVmctl(instance string, flags []string) *Vmctl {
|
||||
tc.t.Helper()
|
||||
|
||||
app, err := StartVmctl(instance, flags)
|
||||
if err != nil {
|
||||
tc.t.Fatalf("Could not start %s: %v", instance, err)
|
||||
}
|
||||
tc.addApp(instance, app)
|
||||
return app
|
||||
}
|
||||
|
||||
func (tc *TestCase) addApp(instance string, app Stopper) {
|
||||
if _, alreadyStarted := tc.startedApps[instance]; alreadyStarted {
|
||||
tc.t.Fatalf("%s has already been started", instance)
|
||||
|
||||
73
apptest/tests/export_import_test.go
Normal file
73
apptest/tests/export_import_test.go
Normal file
@@ -0,0 +1,73 @@
|
||||
package tests
|
||||
|
||||
import (
|
||||
"os"
|
||||
"testing"
|
||||
|
||||
at "github.com/VictoriaMetrics/VictoriaMetrics/apptest"
|
||||
"github.com/google/go-cmp/cmp"
|
||||
"github.com/google/go-cmp/cmp/cmpopts"
|
||||
)
|
||||
|
||||
func TestSingleExportImportNative(t *testing.T) {
|
||||
os.RemoveAll(t.Name())
|
||||
|
||||
tc := at.NewTestCase(t)
|
||||
defer tc.Stop()
|
||||
|
||||
sut := tc.MustStartDefaultVmsingle()
|
||||
|
||||
testExportImportNative(tc.T(), sut)
|
||||
}
|
||||
|
||||
func TestClusterExportImportNative(t *testing.T) {
|
||||
os.RemoveAll(t.Name())
|
||||
|
||||
tc := at.NewTestCase(t)
|
||||
defer tc.Stop()
|
||||
|
||||
sut := tc.MustStartDefaultCluster()
|
||||
|
||||
testExportImportNative(tc.T(), sut)
|
||||
}
|
||||
|
||||
// testExportImportNative test export and import in VictoriaMetrics’ native format.
|
||||
// see: https://docs.victoriametrics.com/#how-to-import-data-in-native-format
|
||||
func testExportImportNative(t *testing.T, sut at.PrometheusWriteQuerier) {
|
||||
// create test data
|
||||
sut.PrometheusAPIV1ImportPrometheus(t, []string{
|
||||
`native_export_import 10 1707123456700`, // 2024-02-05T08:57:36.700Z
|
||||
}, at.QueryOpts{
|
||||
ExtraLabels: []string{"el1=elv1", "el2=elv2"},
|
||||
})
|
||||
sut.ForceFlush(t)
|
||||
|
||||
// export test data via native export API
|
||||
exportResult := sut.PrometheusAPIV1ExportNative(t, "native_export_import", at.QueryOpts{
|
||||
Start: "2024-02-05T08:50:00.700Z",
|
||||
End: "2024-02-05T09:00:00.700Z",
|
||||
})
|
||||
|
||||
// re-import test data via native import API
|
||||
sut.PrometheusAPIV1ImportNative(t, exportResult, at.QueryOpts{})
|
||||
sut.ForceFlush(t)
|
||||
|
||||
// check query result
|
||||
got := sut.PrometheusAPIV1QueryRange(t, "native_export_import", at.QueryOpts{
|
||||
Start: "2024-02-05T08:57:36.700Z",
|
||||
End: "2024-02-05T08:57:36.700Z",
|
||||
Step: "60s",
|
||||
})
|
||||
|
||||
cmpOptions := []cmp.Option{
|
||||
cmpopts.IgnoreFields(at.PrometheusAPIV1QueryResponse{}, "Status", "Data.ResultType"),
|
||||
cmpopts.EquateNaNs(),
|
||||
}
|
||||
want := at.NewPrometheusAPIV1QueryResponse(t, `{"data": {"result": [{"metric": {"__name__": "native_export_import", "el1": "elv1", "el2":"elv2"}, "values": []}]}}`)
|
||||
want.Data.Result[0].Samples = []*at.Sample{
|
||||
at.NewSample(t, "2024-02-05T08:57:36.700Z", 10),
|
||||
}
|
||||
if diff := cmp.Diff(want, got, cmpOptions...); diff != "" {
|
||||
t.Errorf("unexpected response (-want, +got):\n%s", diff)
|
||||
}
|
||||
}
|
||||
@@ -216,4 +216,15 @@ func TestClusterMultiTenantSelect(t *testing.T) {
|
||||
t.Errorf("unexpected response (-want, +got):\n%s", diff)
|
||||
}
|
||||
|
||||
if got := vmselect.GetIntMetric(t, `vm_cache_requests_total{type="multitenancy/tenants"}`); got != 0 {
|
||||
t.Errorf("unexpected multitenancy tenants cache requests; got %d; want 0", got)
|
||||
}
|
||||
|
||||
if got := vmselect.GetIntMetric(t, `vm_cache_misses_total{type="multitenancy/tenants"}`); got != 0 {
|
||||
t.Errorf("unexpected multitenancy tenants cache misses; got %d; want 0", got)
|
||||
}
|
||||
|
||||
if got := vmselect.GetIntMetric(t, `vm_cache_entries{type="multitenancy/tenants"}`); got != 0 {
|
||||
t.Errorf("unexpected multitenancy tenants cache entries; got %d; want 0", got)
|
||||
}
|
||||
}
|
||||
|
||||
@@ -5,8 +5,9 @@ import (
|
||||
"regexp"
|
||||
"testing"
|
||||
|
||||
at "github.com/VictoriaMetrics/VictoriaMetrics/apptest"
|
||||
"github.com/google/go-cmp/cmp"
|
||||
|
||||
at "github.com/VictoriaMetrics/VictoriaMetrics/apptest"
|
||||
)
|
||||
|
||||
// snapshotNameRE covers years 1970-2099.
|
||||
@@ -104,7 +105,7 @@ func TestClusterSnapshots_CreateListDelete(t *testing.T) {
|
||||
tc := at.NewTestCase(t)
|
||||
defer tc.Stop()
|
||||
|
||||
sut := tc.MustStartDefaultCluster().(*at.Vmcluster)
|
||||
sut := tc.MustStartDefaultCluster()
|
||||
|
||||
// Insert some data.
|
||||
const numSamples = 1000
|
||||
|
||||
40
apptest/tests/testdata/prometheus/expected_response.json
vendored
Normal file
40
apptest/tests/testdata/prometheus/expected_response.json
vendored
Normal file
@@ -0,0 +1,40 @@
|
||||
{
|
||||
"status": "success",
|
||||
"data": {
|
||||
"resultType": "matrix",
|
||||
"result": [
|
||||
{
|
||||
"metric": {
|
||||
"__name__": "vm_log_messages_total",
|
||||
"job": "victoriametrics",
|
||||
"instance": "victoriametrics:8428",
|
||||
"app_version": "victoria-metrics-20250523-133235-tags-v1.118.0-0-gaa3171cf4b",
|
||||
"level": "info",
|
||||
"location": "VictoriaMetrics/lib/ingestserver/opentsdb/server.go:48"
|
||||
},
|
||||
"values": [
|
||||
[
|
||||
1748897918.112,
|
||||
"1"
|
||||
]
|
||||
]
|
||||
},
|
||||
{
|
||||
"metric": {
|
||||
"__name__": "vm_log_messages_total",
|
||||
"job": "victoriametrics",
|
||||
"instance": "victoriametrics:8428",
|
||||
"app_version": "victoria-metrics-20250523-133235-tags-v1.118.0-0-gaa3171cf4b",
|
||||
"level": "info",
|
||||
"location": "VictoriaMetrics/lib/ingestserver/opentsdb/server.go:59"
|
||||
},
|
||||
"values": [
|
||||
[
|
||||
1748897918.112,
|
||||
"1"
|
||||
]
|
||||
]
|
||||
}
|
||||
]
|
||||
}
|
||||
}
|
||||
Binary file not shown.
Binary file not shown.
@@ -0,0 +1,17 @@
|
||||
{
|
||||
"ulid": "01JWS713P2E4MQW7T643GYGD69",
|
||||
"minTime": 1748897918112,
|
||||
"maxTime": 1748897922411,
|
||||
"stats": {
|
||||
"numSamples": 2434,
|
||||
"numSeries": 2434,
|
||||
"numChunks": 2434
|
||||
},
|
||||
"compaction": {
|
||||
"level": 1,
|
||||
"sources": [
|
||||
"01JWS713P2E4MQW7T643GYGD69"
|
||||
]
|
||||
},
|
||||
"version": 1
|
||||
}
|
||||
114
apptest/tests/vmctl_prometheus_migration_test.go
Normal file
114
apptest/tests/vmctl_prometheus_migration_test.go
Normal file
@@ -0,0 +1,114 @@
|
||||
package tests
|
||||
|
||||
import (
|
||||
"encoding/json"
|
||||
"fmt"
|
||||
"io"
|
||||
"os"
|
||||
"testing"
|
||||
|
||||
"github.com/google/go-cmp/cmp"
|
||||
"github.com/google/go-cmp/cmp/cmpopts"
|
||||
|
||||
"github.com/VictoriaMetrics/VictoriaMetrics/apptest"
|
||||
)
|
||||
|
||||
const (
|
||||
testSnapshot = "./testdata/prometheus/snapshots/20250602T205846Z-7e03e43cf46dda03"
|
||||
expectedResponseFile = "./testdata/prometheus/expected_response.json"
|
||||
)
|
||||
|
||||
func TestSingleVmctlPrometheusProtocol(t *testing.T) {
|
||||
os.RemoveAll(t.Name())
|
||||
|
||||
tc := apptest.NewTestCase(t)
|
||||
defer tc.Stop()
|
||||
|
||||
vmsingleDst := tc.MustStartDefaultVmsingle()
|
||||
vmAddr := fmt.Sprintf("http://%s/", vmsingleDst.HTTPAddr())
|
||||
vmctlFlags := []string{
|
||||
`prometheus`,
|
||||
`--prom-snapshot=` + testSnapshot,
|
||||
`--vm-addr=` + vmAddr,
|
||||
`--disable-progress-bar=true`,
|
||||
}
|
||||
|
||||
testPrometheusProtocol(tc, vmsingleDst, vmctlFlags)
|
||||
}
|
||||
|
||||
func TestClusterVmctlPrometheusProtocol(t *testing.T) {
|
||||
os.RemoveAll(t.Name())
|
||||
|
||||
tc := apptest.NewTestCase(t)
|
||||
defer tc.Stop()
|
||||
|
||||
cluster := tc.MustStartDefaultCluster()
|
||||
vmAddr := fmt.Sprintf("http://%s/", cluster.Vminsert.HTTPAddr())
|
||||
vmctlFlags := []string{
|
||||
`prometheus`,
|
||||
`--prom-snapshot=` + testSnapshot,
|
||||
`--vm-addr=` + vmAddr,
|
||||
`--disable-progress-bar=true`,
|
||||
`--vm-account-id=0`,
|
||||
}
|
||||
|
||||
testPrometheusProtocol(tc, cluster, vmctlFlags)
|
||||
}
|
||||
|
||||
func testPrometheusProtocol(tc *apptest.TestCase, sut apptest.PrometheusWriteQuerier, vmctlFlags []string) {
|
||||
t := tc.T()
|
||||
t.Helper()
|
||||
|
||||
cmpOpt := cmpopts.IgnoreFields(apptest.PrometheusAPIV1QueryResponse{}, "Status", "Data.ResultType")
|
||||
|
||||
// test for empty data request
|
||||
got := sut.PrometheusAPIV1Query(t, `{__name__=~".*"}`, apptest.QueryOpts{
|
||||
Step: "5m",
|
||||
Time: "2025-06-02T17:14:00Z",
|
||||
})
|
||||
|
||||
want := apptest.NewPrometheusAPIV1QueryResponse(t, `{"data":{"result":[]}}`)
|
||||
if diff := cmp.Diff(want, got, cmpOpt); diff != "" {
|
||||
t.Errorf("unexpected response (-want, +got):\n%s", diff)
|
||||
}
|
||||
|
||||
_ = tc.MustStartVmctl("vmctl", vmctlFlags)
|
||||
|
||||
sut.ForceFlush(t)
|
||||
|
||||
// open the expected series response file
|
||||
file, err := os.Open(expectedResponseFile)
|
||||
if err != nil {
|
||||
t.Fatalf("cannot open expected series response file: %s", err)
|
||||
}
|
||||
defer file.Close()
|
||||
|
||||
bytes, err := io.ReadAll(file)
|
||||
if err != nil {
|
||||
t.Fatalf("cannot read expected series response file: %s", err)
|
||||
}
|
||||
|
||||
var wantResponse apptest.PrometheusAPIV1QueryResponse
|
||||
if err := json.Unmarshal(bytes, &wantResponse); err != nil {
|
||||
t.Fatalf("cannot unmarshal expected series response file: %s", err)
|
||||
}
|
||||
wantResponse.Sort()
|
||||
|
||||
tc.Assert(&apptest.AssertOptions{
|
||||
// For cluster version, we need to wait longer for the metrics to be stored
|
||||
Retries: 300,
|
||||
Msg: `unexpected metrics stored on vmsingle via the prometheus protocol`,
|
||||
Got: func() any {
|
||||
expected := sut.PrometheusAPIV1Export(t, `{__name__="vm_log_messages_total", location=~"VictoriaMetrics/lib/ingestserver/opentsdb/server.go:(48|59)"}`, apptest.QueryOpts{
|
||||
Start: "2025-06-02T00:00:00Z",
|
||||
End: "2025-06-02T23:59:59Z",
|
||||
})
|
||||
expected.Sort()
|
||||
return expected.Data.Result
|
||||
},
|
||||
Want: wantResponse.Data.Result,
|
||||
CmpOpts: []cmp.Option{
|
||||
cmpopts.IgnoreFields(apptest.PrometheusAPIV1QueryResponse{}, "Status", "Data.ResultType"),
|
||||
},
|
||||
})
|
||||
}
|
||||
18
apptest/vmctl.go
Normal file
18
apptest/vmctl.go
Normal file
@@ -0,0 +1,18 @@
|
||||
package apptest
|
||||
|
||||
// Vmctl holds the state of a vmctl app and provides vmctl-specific functions
|
||||
type Vmctl struct {
|
||||
*app
|
||||
}
|
||||
|
||||
// StartVmctl starts an instance of vmctl cli with the given flags
|
||||
func StartVmctl(instance string, flags []string) (*Vmctl, error) {
|
||||
app, _, err := startApp(instance, "../../bin/vmctl", flags, &appOptions{wait: true})
|
||||
if err != nil {
|
||||
return nil, err
|
||||
}
|
||||
|
||||
return &Vmctl{
|
||||
app: app,
|
||||
}, nil
|
||||
}
|
||||
@@ -8,8 +8,9 @@ import (
|
||||
"testing"
|
||||
"time"
|
||||
|
||||
pb "github.com/VictoriaMetrics/VictoriaMetrics/lib/prompbmarshal"
|
||||
"github.com/golang/snappy"
|
||||
|
||||
pb "github.com/VictoriaMetrics/VictoriaMetrics/lib/prompbmarshal"
|
||||
)
|
||||
|
||||
// Vminsert holds the state of a vminsert app and provides vminsert-specific
|
||||
@@ -87,6 +88,12 @@ func (app *Vminsert) ClusternativeListenAddr() string {
|
||||
return app.clusternativeListenAddr
|
||||
}
|
||||
|
||||
// HTTPAddr returns the address at which the vminsert process is
|
||||
// listening for incoming HTTP requests.
|
||||
func (app *Vminsert) HTTPAddr() string {
|
||||
return app.httpListenAddr
|
||||
}
|
||||
|
||||
// InfluxWrite is a test helper function that inserts a
|
||||
// collection of records in Influx line format by sending a HTTP
|
||||
// POST request to /influx/write vmsingle endpoint.
|
||||
@@ -143,6 +150,28 @@ func (app *Vminsert) PrometheusAPIV1ImportCSV(t *testing.T, records []string, op
|
||||
})
|
||||
}
|
||||
|
||||
// PrometheusAPIV1ImportNative is a test helper function that inserts a collection
|
||||
// of records in Native format for the given tenant by sending an HTTP POST
|
||||
// request to prometheus/api/v1/import/native vminsert endpoint.
|
||||
//
|
||||
// See https://docs.victoriametrics.com/cluster-victoriametrics/#url-format
|
||||
func (app *Vminsert) PrometheusAPIV1ImportNative(t *testing.T, data []byte, opts QueryOpts) {
|
||||
t.Helper()
|
||||
|
||||
url := fmt.Sprintf("http://%s/insert/%s/prometheus/api/v1/import/native", app.httpListenAddr, opts.getTenant())
|
||||
uv := opts.asURLValues()
|
||||
uvs := uv.Encode()
|
||||
if len(uvs) > 0 {
|
||||
url += "?" + uvs
|
||||
}
|
||||
app.sendBlocking(t, 1, func() {
|
||||
_, statusCode := app.cli.Post(t, url, "text/plain", data)
|
||||
if statusCode != http.StatusNoContent {
|
||||
t.Fatalf("unexpected status code: got %d, want %d", statusCode, http.StatusNoContent)
|
||||
}
|
||||
})
|
||||
}
|
||||
|
||||
// OpenTSDBAPIPut is a test helper function that inserts a collection of
|
||||
// records in OpenTSDB format for the given tenant by sending an HTTP POST
|
||||
// request to /opentsdb/api/put vminsert endpoint.
|
||||
|
||||
@@ -71,6 +71,22 @@ func (app *Vmselect) PrometheusAPIV1Export(t *testing.T, query string, opts Quer
|
||||
return NewPrometheusAPIV1QueryResponse(t, res)
|
||||
}
|
||||
|
||||
// PrometheusAPIV1ExportNative is a test helper function that performs the export of
|
||||
// raw samples in native binary format by sending an HTTP POST request to
|
||||
// /prometheus/api/v1/export/native vmselect endpoint.
|
||||
//
|
||||
// See https://docs.victoriametrics.com/victoriametrics/url-examples/#apiv1exportnative
|
||||
func (app *Vmselect) PrometheusAPIV1ExportNative(t *testing.T, query string, opts QueryOpts) []byte {
|
||||
t.Helper()
|
||||
|
||||
exportURL := fmt.Sprintf("http://%s/select/%s/prometheus/api/v1/export/native", app.httpListenAddr, opts.getTenant())
|
||||
values := opts.asURLValues()
|
||||
values.Add("match[]", query)
|
||||
values.Add("format", "promapi")
|
||||
res, _ := app.cli.PostForm(t, exportURL, values)
|
||||
return []byte(res)
|
||||
}
|
||||
|
||||
// PrometheusAPIV1Query is a test helper function that performs PromQL/MetricsQL
|
||||
// instant query by sending a HTTP POST request to /prometheus/api/v1/query
|
||||
// vmselect endpoint.
|
||||
|
||||
@@ -35,10 +35,11 @@ type Vmsingle struct {
|
||||
prometheusAPIV1WriteURL string
|
||||
|
||||
// vmselect URLs.
|
||||
prometheusAPIV1ExportURL string
|
||||
prometheusAPIV1QueryURL string
|
||||
prometheusAPIV1QueryRangeURL string
|
||||
prometheusAPIV1SeriesURL string
|
||||
prometheusAPIV1ExportURL string
|
||||
prometheusAPIV1ExportNativeURL string
|
||||
prometheusAPIV1QueryURL string
|
||||
prometheusAPIV1QueryRangeURL string
|
||||
prometheusAPIV1SeriesURL string
|
||||
}
|
||||
|
||||
// StartVmsingle starts an instance of vmsingle with the given flags. It also
|
||||
@@ -81,6 +82,7 @@ func StartVmsingle(instance string, flags []string, cli *Client) (*Vmsingle, err
|
||||
prometheusAPIV1ImportPrometheusURL: fmt.Sprintf("http://%s/prometheus/api/v1/import/prometheus", stderrExtracts[1]),
|
||||
prometheusAPIV1WriteURL: fmt.Sprintf("http://%s/prometheus/api/v1/write", stderrExtracts[1]),
|
||||
prometheusAPIV1ExportURL: fmt.Sprintf("http://%s/prometheus/api/v1/export", stderrExtracts[1]),
|
||||
prometheusAPIV1ExportNativeURL: fmt.Sprintf("http://%s/prometheus/api/v1/export/native", stderrExtracts[1]),
|
||||
prometheusAPIV1QueryURL: fmt.Sprintf("http://%s/prometheus/api/v1/query", stderrExtracts[1]),
|
||||
prometheusAPIV1QueryRangeURL: fmt.Sprintf("http://%s/prometheus/api/v1/query_range", stderrExtracts[1]),
|
||||
prometheusAPIV1SeriesURL: fmt.Sprintf("http://%s/prometheus/api/v1/series", stderrExtracts[1]),
|
||||
@@ -161,6 +163,26 @@ func (app *Vmsingle) PrometheusAPIV1ImportCSV(t *testing.T, records []string, op
|
||||
}
|
||||
}
|
||||
|
||||
// PrometheusAPIV1ImportNative is a test helper function that inserts a collection
|
||||
// of records in native format for the given tenant by sending an HTTP POST
|
||||
// request to /api/v1/import/native vmsingle endpoint.
|
||||
//
|
||||
// See https://docs.victoriametrics.com/victoriametrics/single-server-victoriametrics/#how-to-import-data-in-native-format
|
||||
func (app *Vmsingle) PrometheusAPIV1ImportNative(t *testing.T, data []byte, opts QueryOpts) {
|
||||
t.Helper()
|
||||
|
||||
url := fmt.Sprintf("http://%s/api/v1/import/native", app.httpListenAddr)
|
||||
uv := opts.asURLValues()
|
||||
uvs := uv.Encode()
|
||||
if len(uvs) > 0 {
|
||||
url += "?" + uvs
|
||||
}
|
||||
_, statusCode := app.cli.Post(t, url, "text/plain", data)
|
||||
if statusCode != http.StatusNoContent {
|
||||
t.Fatalf("unexpected status code: got %d, want %d", statusCode, http.StatusNoContent)
|
||||
}
|
||||
}
|
||||
|
||||
// OpenTSDBAPIPut is a test helper function that inserts a collection of
|
||||
// records in OpenTSDB format for the given tenant by sending an HTTP POST
|
||||
// request to /api/put vmsingle endpoint.
|
||||
@@ -235,6 +257,23 @@ func (app *Vmsingle) PrometheusAPIV1Export(t *testing.T, query string, opts Quer
|
||||
return NewPrometheusAPIV1QueryResponse(t, res)
|
||||
}
|
||||
|
||||
// PrometheusAPIV1ExportNative is a test helper function that performs the export of
|
||||
// raw samples in native binary format by sending an HTTP POST request to
|
||||
// /prometheus/api/v1/export/native vmselect endpoint.
|
||||
//
|
||||
// See https://docs.victoriametrics.com/victoriametrics/url-examples/#apiv1exportnative
|
||||
func (app *Vmsingle) PrometheusAPIV1ExportNative(t *testing.T, query string, opts QueryOpts) []byte {
|
||||
t.Helper()
|
||||
|
||||
t.Helper()
|
||||
values := opts.asURLValues()
|
||||
values.Add("match[]", query)
|
||||
values.Add("format", "promapi")
|
||||
|
||||
res, _ := app.cli.PostForm(t, app.prometheusAPIV1ExportNativeURL, values)
|
||||
return []byte(res)
|
||||
}
|
||||
|
||||
// PrometheusAPIV1Query is a test helper function that performs PromQL/MetricsQL
|
||||
// instant query by sending a HTTP POST request to /prometheus/api/v1/query
|
||||
// vmsingle endpoint.
|
||||
|
||||
@@ -129,6 +129,11 @@ publish-via-docker:
|
||||
$(APP_NAME)-linux-ppc64le-prod \
|
||||
$(APP_NAME)-linux-386-prod
|
||||
|
||||
publish-via-docker-latest:
|
||||
$(foreach registry,$(DOCKER_REGISTRIES),\
|
||||
docker buildx imagetools create --tag $(registry)/$(DOCKER_NAMESPACE)/$(APP_NAME):latest $(registry)/$(DOCKER_NAMESPACE)/$(APP_NAME):$(PKG_TAG); \
|
||||
)
|
||||
|
||||
run-via-docker: package-via-docker
|
||||
$(DOCKER_RUN) -it --rm \
|
||||
--user $(shell id -u):$(shell id -g) \
|
||||
|
||||
@@ -36,30 +36,30 @@ services:
|
||||
user: root
|
||||
|
||||
vlinsert:
|
||||
image: victoriametrics/victoria-logs:v1.23.1-victorialogs
|
||||
image: victoriametrics/victoria-logs:v1.23.3-victorialogs
|
||||
command:
|
||||
- "--storageNode=vlstorage-1:9428"
|
||||
- "--storageNode=vlstorage-2:9428"
|
||||
|
||||
vlselect-1:
|
||||
image: victoriametrics/victoria-logs:v1.23.1-victorialogs
|
||||
image: victoriametrics/victoria-logs:v1.23.3-victorialogs
|
||||
command:
|
||||
- "--storageNode=vlstorage-1:9428"
|
||||
- "--storageNode=vlstorage-2:9428"
|
||||
vlselect-2:
|
||||
image: victoriametrics/victoria-logs:v1.23.1-victorialogs
|
||||
image: victoriametrics/victoria-logs:v1.23.3-victorialogs
|
||||
command:
|
||||
- "--storageNode=vlstorage-1:9428"
|
||||
- "--storageNode=vlstorage-2:9428"
|
||||
|
||||
vlstorage-1:
|
||||
image: victoriametrics/victoria-logs:v1.23.1-victorialogs
|
||||
image: victoriametrics/victoria-logs:v1.23.3-victorialogs
|
||||
command:
|
||||
- "--storageDataPath=/vlogs"
|
||||
volumes:
|
||||
- vldata-1:/vlogs
|
||||
vlstorage-2:
|
||||
image: victoriametrics/victoria-logs:v1.23.1-victorialogs
|
||||
image: victoriametrics/victoria-logs:v1.23.3-victorialogs
|
||||
command:
|
||||
- "--storageDataPath=/vlogs"
|
||||
volumes:
|
||||
|
||||
@@ -38,7 +38,7 @@ services:
|
||||
# VictoriaLogs instance, a single process responsible for
|
||||
# storing logs and serving read queries.
|
||||
victorialogs:
|
||||
image: victoriametrics/victoria-logs:v1.23.1-victorialogs
|
||||
image: victoriametrics/victoria-logs:v1.23.3-victorialogs
|
||||
ports:
|
||||
- "9428:9428"
|
||||
command:
|
||||
|
||||
@@ -1,7 +1,7 @@
|
||||
services:
|
||||
# meta service will be ignored by compose
|
||||
.victorialogs:
|
||||
image: docker.io/victoriametrics/victoria-logs:v1.23.1-victorialogs
|
||||
image: docker.io/victoriametrics/victoria-logs:v1.23.3-victorialogs
|
||||
command:
|
||||
- -storageDataPath=/vlogs
|
||||
- -loggerFormat=json
|
||||
|
||||
@@ -59,7 +59,7 @@ services:
|
||||
- '--external.alert.source=explore?orgId=1&left=["now-1h","now","VictoriaMetrics",{"expr": },{"mode":"Metrics"},{"ui":[true,true,true,"none"]}]'
|
||||
restart: always
|
||||
vmanomaly:
|
||||
image: victoriametrics/vmanomaly:v1.21.0
|
||||
image: victoriametrics/vmanomaly:v1.23.0
|
||||
depends_on:
|
||||
- "victoriametrics"
|
||||
ports:
|
||||
|
||||
@@ -3,7 +3,7 @@ version: "3"
|
||||
services:
|
||||
# Run `make package-victoria-logs` to build victoria-logs image
|
||||
vlogs:
|
||||
image: docker.io/victoriametrics/victoria-logs:v1.23.1-victorialogs
|
||||
image: docker.io/victoriametrics/victoria-logs:v1.23.3-victorialogs
|
||||
volumes:
|
||||
- vlogs:/vlogs
|
||||
ports:
|
||||
|
||||
@@ -14,6 +14,21 @@ aliases:
|
||||
---
|
||||
Please find the changelog for VictoriaMetrics Anomaly Detection below.
|
||||
|
||||
## v1.23.0
|
||||
Released: 2025-06-05
|
||||
|
||||
- FEATURE: Added `decay` [argument](https://docs.victoriametrics.com/anomaly-detection/components/models/#decay) to [online models](https://docs.victoriametrics.com/anomaly-detection/components/models/#online-models). This parameters allows for newer data to be weighted more heavily in online models. By default this is set to 1 which means all data points are weighted the same to maintain backward compatibility with existing configs. The closer this value is to 0 the more important new data is.
|
||||
|
||||
- IMPROVEMENT: **Restored back parallelization** in the read/fit/infer pipeline, previously disabled in [v1.22.0](#v1220-experimental) due to deadlock issues. The new implementation prevents deadlocks, allowing to control the parallelization level via `n_workers` in [settings section](https://docs.victoriametrics.com/anomaly-detection/components/settings/). It's suggested to upgrade from [v1.22.0](#v1220) - [v1.22.1](#v1221) to this version to regain the performance benefits of parallel processing.
|
||||
|
||||
- IMPROVEMENT: Added `--dryRun` [argument](https://docs.victoriametrics.com/anomaly-detection/quickstart/#command-line-arguments) to `vmanomaly` to enable dry run mode. This mode allows to validate configuration without executing any actual operations and doesn't require a license. It is particularly useful to test the configurations before deploying them in a production environment.
|
||||
|
||||
- IMPROVEMENT: Enhanced task scheduling to reduce locks between anomaly detection models' fit and inference calls, improving their concurrent performance.
|
||||
|
||||
- IMPROVEMENT: `min_dev_from_expected` model [common argument](https://docs.victoriametrics.com/anomaly-detection/components/models/#minimal-deviation-from-expected) is now bi-directional, allowing you to set *different* thresholds for peaks and drops.
|
||||
|
||||
- BUGFIX: Now `clip_predictions` [model common arg](https://docs.victoriametrics.com/anomaly-detection/components/models/#clip-predictions) is properly used with [online models](https://docs.victoriametrics.com/anomaly-detection/components/models/#online-models), ensuring that the predictions are clipped to the respective query's `data_range` values even if the model saw *less datapoints* than required `min_n_samples_seen_` to produce anomaly scores (e.g., when a new model instance was created during `infer` call for new timeseries not seen at training time).
|
||||
|
||||
## v1.22.1
|
||||
Released: 2025-05-11
|
||||
|
||||
@@ -28,7 +43,7 @@ Released: 2025-04-11
|
||||
|
||||
**(Experimental Patch Release)**
|
||||
|
||||
> Important Notice - this patch disables parallelization to resolve rate but critical deadlock issue that completely halted the fit/infer pipeline (resulting in no anomaly scores, no model refits, and no log output) on multicore systems. Although this change improves resource usage by reducing peak-to-average RAM consumption, it incurs a 2–4x slowdown in fit/infer routines. We recommend upgrading only if your current deployments are experiencing deadlock-related outages. Future releases will reintroduce optimized parallelization.
|
||||
> Important Notice - this patch disables parallelization to resolve rate but critical deadlock issue that completely halted the fit/infer pipeline (resulting in no anomaly scores, no model refits, and no log output) on multicore systems. Although this change improves resource usage by reducing peak-to-average RAM consumption, it incurs a 2–4x slowdown in fit/infer routines. We recommend upgrading only if your current deployments are experiencing deadlock-related outages. Please upgrade to [v1.23.0](#v1230) or newer for restored parallelization.
|
||||
|
||||
- BUGFIX: Resolved an intermittent deadlock in the fit/infer process that previously caused the service to freeze indefinitely, thereby preventing anomaly score production and model refits on multicore systems.
|
||||
|
||||
@@ -189,7 +204,7 @@ Released: 2024-10-22
|
||||
## v1.17.1
|
||||
Released: 2024-10-18
|
||||
|
||||
- BUGFIX: [Prophet models](https://docs.victoriametrics.com/anomaly-detection/components/models/#prophet) no longer fail to train on *constant* data, data consisting of the same value and no variation across time. The bug prevented the `fit` stage from completing successfully, resulting in the model instance not being stored in the model registry, after automated model cleanup was added in [v1.17.0](#1170).
|
||||
- BUGFIX: [Prophet models](https://docs.victoriametrics.com/anomaly-detection/components/models/#prophet) no longer fail to train on *constant* data, data consisting of the same value and no variation across time. The bug prevented the `fit` stage from completing successfully, resulting in the model instance not being stored in the model registry, after automated model cleanup was added in [v1.17.0](#v1170).
|
||||
|
||||
## v1.17.0
|
||||
Released: 2024-10-17
|
||||
|
||||
@@ -224,7 +224,7 @@ services:
|
||||
# ...
|
||||
vmanomaly:
|
||||
container_name: vmanomaly
|
||||
image: victoriametrics/vmanomaly:v1.21.0
|
||||
image: victoriametrics/vmanomaly:v1.23.0
|
||||
# ...
|
||||
ports:
|
||||
- "8490:8490"
|
||||
@@ -256,9 +256,10 @@ For Helm chart users, refer to the `persistentVolume` [section](https://github.c
|
||||
|
||||
With the introduction of [online models](https://docs.victoriametrics.com/anomaly-detection/components/models/#online-models) {{% available_from "v1.15.0" anomaly %}} , you can additionally reduce resource consumption (e.g., flatten `fit` stage peaks by querying less data from VictoriaMetrics at once).
|
||||
|
||||
- **Reduced Latency**: Online models update incrementally, which can lead to faster response times for anomaly detection since the model continuously adapts to new data without waiting for a batch `fit`.
|
||||
- **Reduced latency**: Online models update incrementally, which can lead to faster response times for anomaly detection since the model continuously adapts to new data without waiting for a batch `fit`.
|
||||
- **Scalability**: Handling smaller data chunks at a time reduces memory and computational overhead, making it easier to scale the anomaly detection system.
|
||||
- **Improved Resource Utilization**: By spreading the computational load over time and reducing peak demands, online models make more efficient use of system resources, potentially lowering operational costs.
|
||||
- **Optimized resource utilization**: By spreading the computational load over time and reducing peak demands, online models make more efficient use of resources and inducing less data transfer from VictoriaMetrics TSDB, improving overall system performance.
|
||||
- **Faster convergence**: Online models can adapt {{% available_from "v1.23.0" anomaly %}} to changes in data patterns more quickly, which is particularly beneficial in dynamic environments where data characteristics may shift frequently. See `decay` argument descrition [here](https://docs.victoriametrics.com/anomaly-detection/components/models/#decay).
|
||||
|
||||
Here's an example of how we can switch from (offline) [Z-score model](https://docs.victoriametrics.com/anomaly-detection/components/models/#z-score) to [Online Z-score model](https://docs.victoriametrics.com/anomaly-detection/components/models/#online-z-score):
|
||||
|
||||
@@ -292,6 +293,7 @@ models:
|
||||
zscore_example:
|
||||
class: 'zscore_online'
|
||||
min_n_samples_seen: 120 # i.e. minimal relevant seasonality or (initial) fit_window / sampling_frequency
|
||||
decay: 0.999 # decay factor to control how fast the model adapts to new data, the lower, the faster it adapts
|
||||
schedulers: ['periodic']
|
||||
# other model params ...
|
||||
# other config sections ...
|
||||
@@ -430,7 +432,7 @@ options:
|
||||
Here’s an example of using the config splitter to divide configurations based on the `extra_filters` argument from the reader section:
|
||||
|
||||
```sh
|
||||
docker pull victoriametrics/vmanomaly:v1.21.0 && docker image tag victoriametrics/vmanomaly:v1.21.0 vmanomaly
|
||||
docker pull victoriametrics/vmanomaly:v1.23.0 && docker image tag victoriametrics/vmanomaly:v1.23.0 vmanomaly
|
||||
```
|
||||
|
||||
```sh
|
||||
|
||||
@@ -34,24 +34,26 @@ The `vmanomaly` service supports several command-line arguments to configure its
|
||||
> `vmanomaly` support {{% available_from "v1.18.5" anomaly %}} running on config **directories**, see the `config` positional arg description in help message below.
|
||||
|
||||
```shellhelp
|
||||
usage: vmanomaly.py [-h] [--license STRING | --licenseFile PATH] [--license.forceOffline] [--loggerLevel {INFO,DEBUG,ERROR,WARNING,FATAL}] [--watch] config [config ...]
|
||||
usage: vmanomaly.py [-h] [--license STRING | --licenseFile PATH] [--license.forceOffline] [--loggerLevel {DEBUG,WARNING,FATAL,ERROR,INFO}] [--watch] [--dryRun] [--outputSpec PATH] config [config ...]
|
||||
|
||||
VictoriaMetrics Anomaly Detection Service
|
||||
|
||||
positional arguments:
|
||||
config YAML config file(s) or directories containing YAML files. Multiple files will recursively merge each other values so multiple configs can be combined. If a directory
|
||||
is provided, all `.yaml` files inside will be merged, without recursion. Default: vmanomaly.yaml is expected in the current directory.
|
||||
config YAML config file(s) or directories containing YAML files. Multiple files will recursively merge each other values so multiple configs can be combined. If a directory is provided,
|
||||
all `.yaml` files inside will be merged, without recursion. Default: vmanomaly.yaml is expected in the current directory.
|
||||
|
||||
options:
|
||||
-h show this help message and exit
|
||||
--license STRING License key for VictoriaMetrics Enterprise. See https://victoriametrics.com/products/enterprise/trial/ to obtain a trial license.
|
||||
--licenseFile PATH Path to file with license key for VictoriaMetrics Enterprise. See https://victoriametrics.com/products/enterprise/trial/ to obtain a trial license.
|
||||
--license.forceOffline
|
||||
Whether to force offline verification for VictoriaMetrics Enterprise license key, which has been passed either via -license or via -licenseFile command-line flag. The
|
||||
issued license key must support offline verification feature. Contact info@victoriametrics.com if you need offline license verification.
|
||||
--loggerLevel {INFO,DEBUG,ERROR,WARNING,FATAL}
|
||||
Whether to force offline verification for VictoriaMetrics Enterprise license key, which has been passed either via -license or via -licenseFile command-line flag. The issued
|
||||
license key must support offline verification feature. Contact info@victoriametrics.com if you need offline license verification.
|
||||
--loggerLevel {DEBUG,WARNING,FATAL,ERROR,INFO}
|
||||
Minimum level to log. Possible values: DEBUG, INFO, WARNING, ERROR, FATAL.
|
||||
--watch [DEPRECATED SINCE v1.11.0] Watch config files for changes. This option is no longer supported and will be ignored.
|
||||
--dryRun Validate only: parse + merge all YAML(s) and run schema checks, then exit. Does not require a license to run. Does not expose metrics, or launch vmanomaly service(s).
|
||||
--outputSpec PATH Target location of .yaml output spec.
|
||||
```
|
||||
|
||||
You can specify these options when running `vmanomaly` to fine-tune logging levels or handle licensing configurations, as per your requirements.
|
||||
@@ -116,13 +118,13 @@ Below are the steps to get `vmanomaly` up and running inside a Docker container:
|
||||
1. Pull Docker image:
|
||||
|
||||
```sh
|
||||
docker pull victoriametrics/vmanomaly:v1.20.1
|
||||
docker pull victoriametrics/vmanomaly:v1.23.0
|
||||
```
|
||||
|
||||
2. (Optional step) tag the `vmanomaly` Docker image:
|
||||
|
||||
```sh
|
||||
docker image tag victoriametrics/vmanomaly:v1.20.1 vmanomaly
|
||||
docker image tag victoriametrics/vmanomaly:v1.23.0 vmanomaly
|
||||
```
|
||||
|
||||
3. Start the `vmanomaly` Docker container with a *license file*, use the command below.
|
||||
@@ -156,7 +158,7 @@ docker run -it --user 1000:1000 \
|
||||
services:
|
||||
# ...
|
||||
vmanomaly:
|
||||
image: victoriametrics/vmanomaly:v1.21.0
|
||||
image: victoriametrics/vmanomaly:v1.23.0
|
||||
volumes:
|
||||
$YOUR_LICENSE_FILE_PATH:/license
|
||||
$YOUR_CONFIG_FILE_PATH:/config.yml
|
||||
@@ -189,8 +191,9 @@ with [these Helm charts](https://github.com/VictoriaMetrics/helm-charts/blob/mas
|
||||
## How to configure vmanomaly
|
||||
To run `vmanomaly` you need to set up configuration file in `yaml` format.
|
||||
|
||||
Here is an example of config file that will run [Facebook Prophet](https://facebook.github.io/prophet/) model, that will be retrained every 2 hours on 14 days of previous data. It will generate [inference metrics](https://docs.victoriametrics.com/anomaly-detection/components/models#vmanomaly-output) (including `anomaly_score`) every 1 minute.
|
||||
> Before deploying, to check the correctness of your configuration validate config file(s) with `--dryRun` [command-line](#command-line-arguments) flag for chosen deployment method (Docker, Kubernetes, etc.). This will parse and merge all YAML files, run schema checks, logs errors and warnings (if found) and then exit without starting the service or requiring a license.
|
||||
|
||||
Here is an example of config file that will run [Facebook Prophet](https://facebook.github.io/prophet/) model, that will be retrained every 2 hours on 14 days of previous data. It will generate [inference metrics](https://docs.victoriametrics.com/anomaly-detection/components/models#vmanomaly-output) (including `anomaly_score`) every 1 minute.
|
||||
|
||||
```yaml
|
||||
schedulers:
|
||||
@@ -206,7 +209,7 @@ models:
|
||||
prophet_model:
|
||||
class: 'prophet'
|
||||
provide_series: ['anomaly_score', 'yhat', 'yhat_lower', 'yhat_upper'] # for debugging
|
||||
tz_aware: True
|
||||
tz_aware: True # set to True if your data is timezone-aware, to deal with DST changes correctly
|
||||
tz_use_cyclical_encoding: True
|
||||
tz_seasonalities: # intra-day + intra-week seasonality
|
||||
- name: 'hod' # intra-day seasonality, hour of the day
|
||||
|
||||
@@ -80,7 +80,7 @@ Additionally, a replication factor `R ≥ 1` ensures [high availability](#high-a
|
||||
|
||||
<p></p>
|
||||
|
||||
<img src="../vmanomaly-sharding-ha-diagram.webp" alt="vmanomaly-sharding-ha-diagram" width="800px"/>
|
||||

|
||||
|
||||
> Please [refer to deployment options section](#deployment-options) for the examples (Docker, Docker Compose, Helm). To avoid duplicate metrics being reported from each vmanomaly service used in sharded mode, make sure that [deduplication](https://docs.victoriametrics.com/victoriametrics/single-server-victoriametrics/#deduplication) is configured on vmsingle or vmselect and vmstorage for the VictoriaMetrics instance used in the [writer section of the configuration](https://docs.victoriametrics.com/anomaly-detection/components/writer).
|
||||
|
||||
@@ -132,7 +132,7 @@ When `VMANOMALY_REPLICATION_FACTOR` > 1, each [sub-config](#sub-configuration) `
|
||||
|
||||
<p></p>
|
||||
|
||||
<img src="../vmanomaly-sharding-ha-diagram.webp" alt="vmanomaly-sharding-ha-diagram" width="800px"/>
|
||||

|
||||
|
||||
> Please [refer to deployment options section](#deployment-options) for the examples (Docker, Docker Compose, Helm). To avoid duplicate metrics being reported from each vmanomaly service used in sharded mode, make sure that [deduplication](https://docs.victoriametrics.com/victoriametrics/single-server-victoriametrics/#deduplication) is configured on vmsingle or vmselect and vmstorage for the VictoriaMetrics instance used in the [writer section of the configuration](https://docs.victoriametrics.com/anomaly-detection/components/writer).
|
||||
|
||||
|
||||
@@ -44,13 +44,13 @@ The Grafana Dashboard is helpful for:
|
||||
|
||||
> Use the **top-level dashboard filters** to refine metrics by job, instance, or specific components for more focused monitoring. The time range filter, along with `job` and `instance` filters, is applied across all components. All other filters apply to all dashboard sections except "Instance Overview." Hover over the (i) icon for detailed filter descriptions.
|
||||
|
||||
<img src="../vmanomaly-dashboard-1-filters.webp" alt="vmanomaly-dashboard-1-filters" width="800px"/>
|
||||

|
||||
|
||||
The Grafana Dashboard for `vmanomaly` is organized into various panels that offer insights into different components and their operational metrics. The main sections are as follows:
|
||||
|
||||
### Instance Overview
|
||||
|
||||
<img src="../vmanomaly-dashboard-2-instance-overview.webp" alt="vmanomaly-dashboard-2-instance-overview" width="800px"/>
|
||||

|
||||
|
||||
This panel provides general information about the state at individual `instance` level, including metrics such as uptime, restarts, errors, license expiration, and overall status. It serves as a critical starting point for assessing the health of the anomaly detection service. If any issues are identified with a particular instance — such as a low success rate, a high number of skipped or erroneous runs, or increased resource consumption — you can drill down further by using the dashboard filter `instance={{instance}}` for more detailed analysis.
|
||||
|
||||
@@ -69,7 +69,7 @@ This global panel holds statistics related to models, filtered by the dashboard
|
||||
- Counts of successful, skipped, or erroneous model runs.
|
||||
- Average timings for different model stages.
|
||||
|
||||
<img src="../vmanomaly-dashboard-3-global-panel-models.webp" alt="vmanomaly-dashboard-3-global-panel-models" width="800px"/>
|
||||

|
||||
|
||||
**Healthy scenario**:
|
||||
- **Data Acceptance**: Should be consistently high, ideally close to 100%. This indicates that the system is successfully processing the majority of incoming data without issues (e.g., no NaNs or Inf values).
|
||||
@@ -81,7 +81,7 @@ This global panel holds statistics related to models, filtered by the dashboard
|
||||
#### I/O
|
||||
This global panel holds statistics related to I/O operations and data processing, filtered by the dashboard settings.
|
||||
|
||||
<img src="../vmanomaly-dashboard-3-global-panel-io.webp" alt="vmanomaly-dashboard-3-global-io" width="800px"/>
|
||||

|
||||
|
||||
**Healthy scenario**:
|
||||
- **I/O success, %**: Should be close to 100%.
|
||||
@@ -90,7 +90,7 @@ This global panel holds statistics related to I/O operations and data processing
|
||||
#### Latency
|
||||
This global panel holds latency statistics (reads, writes, response processing by stages), filtered by the dashboard settings.
|
||||
|
||||
<img src="../vmanomaly-dashboard-3-global-panel-latency.webp" alt="vmanomaly-dashboard-3-global-latency" width="800px"/>
|
||||

|
||||
|
||||
**Healthy scenario**:
|
||||
- **Timeseries graphs**: Should appear stable over time, without significant spikes or drops.
|
||||
@@ -100,7 +100,7 @@ This global panel holds latency statistics (reads, writes, response processing b
|
||||
|
||||
This global panel holds resource utilization (CPU, RAM, File Descriptors) on both an overall and per-`instance` level, filtered by the dashboard settings.
|
||||
|
||||
<img src="../vmanomaly-dashboard-3-global-panel-resources.webp" alt="vmanomaly-dashboard-3-global-resources" width="800px"/>
|
||||

|
||||
|
||||
**Healthy scenario**:
|
||||
- **Timeseries graphs**: Should appear stable over time, without significant spikes or drops. An absence of upward trends (e.g., trends in RAM usage may indicate a [high churn rate](https://docs.victoriametrics.com/victoriametrics/faq/#what-is-high-churn-rate) in your input data).
|
||||
@@ -109,7 +109,7 @@ This global panel holds resource utilization (CPU, RAM, File Descriptors) on bot
|
||||
|
||||
These panels contain repeated blocks for each unique `model_alias` (a distinct entity defined in the `models` [configuration section](https://docs.victoriametrics.com/anomaly-detection/components/models)), filtered according to the current dashboard settings. They provide information on the number of unique entities (such as queries, schedulers, and instances) that a particular `model_alias` interacts with, as well as the count of active model instances available for inferring new data.
|
||||
|
||||
<img src="../vmanomaly-dashboard-4-model-sections.webp" alt="vmanomaly-dashboard-4-model-sections" width="800px"/>
|
||||

|
||||
|
||||
**Healthy scenario**:
|
||||
- **Erroneous Runs**: There should be zero erroneous runs. Any errors suggest potential issues with the service or uncaught corner cases that need immediate attention.
|
||||
@@ -130,7 +130,7 @@ The alerting rules are provided in a YAML file called [`alerts-vmanomaly.yml`](h
|
||||
|
||||
These alerting rules complements the [dashboard](#grafana-dashboard) to monitor the health of `vmanomaly`. Each alert has annotations to help understand the issue and guide troubleshooting efforts. Below are the key alerts included, grouped into 2 sections:
|
||||
|
||||
<img src="../firing-alerts-groups.webp" alt="firing-alerts-groups" width="800px"/>
|
||||

|
||||
|
||||
`vmanomaly-health` alerting group:
|
||||
- **`TooManyRestarts`**: Triggers if an instance restarts more than twice within 15 minutes, suggesting the process might be crashlooping and needs investigation.
|
||||
@@ -140,7 +140,7 @@ These alerting rules complements the [dashboard](#grafana-dashboard) to monitor
|
||||
- **`TooHighMemoryUsage`**: Alerts when RAM usage exceeds 85% for a continuous 5-minute period and the need to adjust resource allocation or load.
|
||||
- **`NoSelfMonitoringMetrics`**: Alerts when vmanomaly up time metric has not been seen in Victoriametrics for 15 minutes, indicating the service is down or unable to push metrics to Victoriametrics.
|
||||
|
||||
<img src="../firing-alerts-example-too-many-restarts.webp" alt="firing-alerts-example-too-many-restarts" width="800px"/>
|
||||

|
||||
|
||||
`vmanomaly-issues` alerting group:
|
||||
- **`ServiceErrorsDetected`**: Alerts if model run errors are detected, indicating problems with the anomaly detection service or its dependencies.
|
||||
@@ -148,4 +148,4 @@ These alerting rules complements the [dashboard](#grafana-dashboard) to monitor
|
||||
- **`HighReadErrorRate`**: Alerts when the error rate for read operations exceeds 5% in a 5-minute window, suggesting issues with the data source, server constraints, or network.
|
||||
- **`HighWriteErrorRate`**: Alerts when the error rate for write operations exceeds 5% in a 5-minute window, indicating issues with data writing, potential server-side violations, or network problems.
|
||||
|
||||
<img src="../firing-alerts-example-skipped-runs.webp" alt="firing-alerts-example-skipped-runs" width="800px"/>
|
||||

|
||||
|
||||
@@ -5,6 +5,7 @@ This chapter describes different components, that correspond to respective secti
|
||||
- [Scheduler(s) section](https://docs.victoriametrics.com/anomaly-detection/components/scheduler/) - Required
|
||||
- [Writer section](https://docs.victoriametrics.com/anomaly-detection/components/writer/) - Required
|
||||
- [Monitoring section](https://docs.victoriametrics.com/anomaly-detection/components/monitoring/) - Optional
|
||||
- [Settings section](https://docs.victoriametrics.com/anomaly-detection/components/settings/) - Optional
|
||||
|
||||
> Once the service starts, automated config validation is performed{{% available_from "v1.7.2" anomaly %}}. Please see container logs for errors that need to be fixed to create fully valid config, visiting sections above for examples and documentation.
|
||||
|
||||
@@ -21,6 +22,10 @@ Below, you will find an example illustrating how the components of `vmanomaly` i
|
||||
Here's a minimalistic full config example, demonstrating many-to-many configuration (actual for [latest version](https://docs.victoriametrics.com/anomaly-detection/changelog/)):
|
||||
|
||||
```yaml
|
||||
settings:
|
||||
n_workers: 4 # number of workers to run models in parallel
|
||||
anomaly_score_outside_data_range: 5.0 # default anomaly score for anomalies outside expected data range
|
||||
|
||||
# how and when to run the models is defined by schedulers
|
||||
# https://docs.victoriametrics.com/anomaly-detection/components/scheduler/
|
||||
schedulers:
|
||||
@@ -51,7 +56,8 @@ models:
|
||||
provide_series: ['anomaly_score', 'yhat', 'yhat_lower', 'yhat_upper']
|
||||
queries: ['cpu_seconds_total']
|
||||
schedulers: ['periodic_1w'] # will be attached to 1-week schedule, fit every 1h and infer every 15m
|
||||
min_dev_from_expected: 0.01 # if |y - yhat| < 0.01, anomaly score will be 0
|
||||
min_dev_from_expected: [0.01, 0.01] # minimum deviation from expected value to be even considered as anomaly
|
||||
anomaly_score_outside_data_range: 1.5 # override default anomaly score outside expected data range
|
||||
detection_direction: 'above_expected'
|
||||
args: # model-specific arguments
|
||||
interval_width: 0.98
|
||||
|
||||
@@ -189,9 +189,11 @@ reader:
|
||||
|
||||
### Minimal deviation from expected
|
||||
|
||||
`min_dev_from_expected`{{% available_from "v1.13.0" anomaly %}} argument is designed to **reduce [false positives](https://victoriametrics.com/blog/victoriametrics-anomaly-detection-handbook-chapter-1/#false-positive)** in scenarios where deviations between the actual value (`y`) and the expected value (`yhat`) are **relatively** high. Such deviations can cause models to generate high [anomaly scores](https://docs.victoriametrics.com/anomaly-detection/faq/#what-is-anomaly-score). However, these deviations may not be significant enough in **absolute values** from a business perspective to be considered anomalies. This parameter ensures that anomaly scores for data points where `|y - yhat| < min_dev_from_expected` are explicitly set to 0. By default, if this parameter is not set, it behaves as `min_dev_from_expected=0` to maintain backward compatibility.
|
||||
`min_dev_from_expected`{{% available_from "v1.13.0" anomaly %}} argument is designed to **reduce [false positives](https://victoriametrics.com/blog/victoriametrics-anomaly-detection-handbook-chapter-1/#false-positive)** in scenarios where deviations between the actual value (`y`) and the expected value (`yhat`) are **relatively** high. Such deviations can cause models to generate high [anomaly scores](https://docs.victoriametrics.com/anomaly-detection/faq/#what-is-anomaly-score). However, these deviations may not be significant enough in **absolute values** from a business perspective to be considered anomalies. This parameter ensures that anomaly scores for data points where `|y - yhat| < min_dev_from_expected` are explicitly set to 0. By default, if this parameter is not set, it is set to `0` to maintain backward compatibility.
|
||||
|
||||
> `min_dev_from_expected` must be >= 0. The higher the value of `min_dev_from_expected`, the fewer data points will be available for anomaly detection, and vice versa.
|
||||
> {{% available_from "v1.23.0" anomaly %}} The `min_dev_from_expected` argument can be a list of two float values, allowing separate thresholds for upper and lower deviations. This is useful when the acceptable deviation varies in different directions (e.g., `min_dev_from_expected: [0.01, 0.02]` means that the lower bound is `0.01` when `y` is less than `yhat` and the upper bound is `0.02` when `y` is greater than `yhat`). If only one value is provided, it is broadcasted to both directions, meaning that the same threshold is applied for both upper and lower deviations (e.g., `min_dev_from_expected: 0.01` means that the lower bound is `0.01` when `y` is less than `yhat` and the upper bound is also `0.01` when `y` is greater than `yhat`).
|
||||
|
||||
> `min_dev_from_expected` must be >= 0. The higher the value of `min_dev_from_expected`, the more significant the deviation must be to generate an anomaly score > 1. This helps in filtering out small deviations that may not be meaningful in the context of the monitored metric.
|
||||
|
||||
*Example*: Consider a scenario where CPU utilization is low and oscillates around 0.3% (0.003). A sudden spike to 1.3% (0.013) represents a +333% increase in **relative** terms, but only a +1 percentage point (0.01) increase in **absolute** terms, which may be negligible and not warrant an alert. Setting the `min_dev_from_expected` argument to `0.01` (1%) will ensure that all anomaly scores for deviations <= `0.01` are set to 0.
|
||||
|
||||
@@ -220,12 +222,13 @@ models:
|
||||
zscore_with_min_dev:
|
||||
class: 'zscore' # or 'model.zscore.ZscoreModel' until v1.13.0
|
||||
z_threshold: 3
|
||||
min_dev_from_expected: 5.0
|
||||
min_dev_from_expected: [5.0, 5.0]
|
||||
queries: ['need_to_include_min_dev'] # use such models on queries where domain experience confirm usefulness
|
||||
zscore_wo_min_dev:
|
||||
class: 'zscore' # or 'model.zscore.ZscoreModel' until v1.13.0
|
||||
z_threshold: 3
|
||||
# if not set, equals to setting min_dev_from_expected == 0
|
||||
# if not set, equals to setting min_dev_from_expected == 0 (meaning no filtering is applied)
|
||||
# min_dev_from_expected: [0.0, 0.0]
|
||||
queries: ['normal_behavior'] # use the default where it's not needed
|
||||
```
|
||||
|
||||
@@ -360,7 +363,7 @@ The `anomaly_score_outside_data_range` {{% available_from "v1.20.0" anomaly %}}
|
||||
|
||||
**How it works**
|
||||
- If **not set**, the **default value (`1.01`)** is used for backward compatibility.
|
||||
- If defined at the **service level** (`settings`), it applies to all models **unless overridden at the model level**.
|
||||
- If defined at the **service level** (`settings` [section](https://docs.victoriametrics.com/anomaly-detection/components/settings/#anomaly-score-outside-data-range)), it applies to all models **unless overridden at the model level**.
|
||||
- If set **per model**, it takes **priority over the global setting**.
|
||||
|
||||
**Example (override)**
|
||||
@@ -396,6 +399,38 @@ models:
|
||||
anomaly_score_outside_data_range: 3.0
|
||||
```
|
||||
|
||||
### Decay
|
||||
|
||||
> The `decay` argument works only in combination with [online models](#online-models) like [`ZScoreOnlineModel`](#online-z-score) or [`OnlineQuantileModel`](#online-seasonal-quantile).
|
||||
|
||||
The `decay` {{% available_from "v1.23.0" anomaly %}} argument is used to control the (exponential) **decay factor** for online models, which determines how quickly the model adapts to new data. It is a float value between `0.0` and `1.0`, where:
|
||||
- `1.0` means no decay (the model treats all data equally, without giving more weight to recent data). This is the default value for backward compatibility.
|
||||
- Less than `1.0` means that the model will give more weight to recent data, effectively "forgetting" older data over time.
|
||||
|
||||
Roughly speaking, for the recent N datapoints model processes `decay` = `d` means that these datapoints will contribute to the model as [1 - d^X] percent of total importance, for example decay of
|
||||
- `0.99` means that 100 recent datapoints will contribute as [1 - 0.99^100] = 63.23% of total importance
|
||||
- `0.999` means that 1000 recent datapoints will contribute as [1 - 0.999^1000] = 63.23% of total importance
|
||||
|
||||
For example, if the model is updated every 5 minutes (`scheduler.infer_every`), on five 1-minute datapoints and there is a need to keep the last 1 day of data as the most impactful, setting `decay: 0.996` will ensure that the model has the last (86400/60) = 1440 datapoints contributing as [1 - 0.996^1440] = 99.6% of total importance, without the need to re-train the model on all 1440 datapoints every day with `fit_every: 1d` (which would be the limitation for [offline models](#offline-models)).
|
||||
|
||||
Example config:
|
||||
|
||||
```yaml
|
||||
# other components like writer, schedulers, monitoring ...
|
||||
reader:
|
||||
# ...
|
||||
queries:
|
||||
q1: metricsql_expression1
|
||||
# ...
|
||||
|
||||
models:
|
||||
online_zscore:
|
||||
class: 'zscore_online'
|
||||
z_threshold: 3.0
|
||||
decay: 0.996 # decay factor for online model, default is 1.0
|
||||
queries: ['q1']
|
||||
```
|
||||
|
||||
|
||||
## Model types
|
||||
|
||||
@@ -626,7 +661,7 @@ models:
|
||||
# schedulers: [all scheduler aliases defined in `scheduler` section]
|
||||
# queries: [all query aliases defined in `reader.queries` section]
|
||||
# detection_direction: 'both' # meaning both drops and spikes will be captured
|
||||
# min_dev_from_expected: 0.0 # meaning, no minimal threshold is applied to prevent smaller anomalies
|
||||
# min_dev_from_expected: [0.0, 0.0] # meaning, no minimal threshold is applied to prevent smaller anomalies
|
||||
# scale: [1.0, 1.0] # if needed, prediction intervals' width can be increased (>1) or narrowed (<1)
|
||||
# clip_predictions: False # if data_range for respective `queries` is set in reader, `yhat.*` columns will be clipped
|
||||
# anomaly_score_outside_data_range: 1.01 # auto anomaly score (1.01) if `y` (real value) is outside of data_range, if set
|
||||
@@ -656,7 +691,7 @@ models:
|
||||
# schedulers: [all scheduler aliases defined in `scheduler` section]
|
||||
# queries: [all query aliases defined in `reader.queries` section]
|
||||
# detection_direction: 'both' # meaning both drops and spikes will be captured
|
||||
# min_dev_from_expected: 0.0 # meaning, no minimal threshold is applied to prevent smaller anomalies
|
||||
# min_dev_from_expected: [0.0, 0.0] # meaning, no minimal threshold is applied to prevent smaller anomalies
|
||||
# scale: [1.0, 1.0] # if needed, prediction intervals' width can be increased (>1) or narrowed (<1)
|
||||
# clip_predictions: False # if data_range for respective `queries` is set in reader, `yhat.*` columns will be clipped
|
||||
# anomaly_score_outside_data_range: 1.01 # auto anomaly score (1.01) if `y` (real value) is outside of data_range, if set
|
||||
@@ -703,7 +738,7 @@ models:
|
||||
# schedulers: [all scheduler aliases defined in `scheduler` section]
|
||||
# queries: [all query aliases defined in `reader.queries` section]
|
||||
# detection_direction: 'both' # meaning both drops and spikes will be captured
|
||||
# min_dev_from_expected: 0.0 # meaning, no minimal threshold is applied to prevent smaller anomalies
|
||||
# min_dev_from_expected: [0.0, 0.0] # meaning, no minimal threshold is applied to prevent smaller anomalies
|
||||
# scale: [1.0, 1.0] # if needed, prediction intervals' width can be increased (>1) or narrowed (<1)
|
||||
# clip_predictions: False # if data_range for respective `queries` is set in reader, `yhat.*` columns will be clipped
|
||||
# anomaly_score_outside_data_range: 1.01 # auto anomaly score (1.01) if `y` (real value) is outside of data_range, if set
|
||||
@@ -739,7 +774,7 @@ models:
|
||||
# schedulers: [all scheduler aliases defined in `scheduler` section]
|
||||
# queries: [all query aliases defined in `reader.queries` section]
|
||||
# detection_direction: 'both' # meaning both drops and spikes will be captured
|
||||
# min_dev_from_expected: 0.0 # meaning, no minimal threshold is applied to prevent smaller anomalies
|
||||
# min_dev_from_expected: [0.0, 0.0] # meaning, no minimal threshold is applied to prevent smaller anomalies
|
||||
# scale: [1.0, 1.0] # if needed, prediction intervals' width can be increased (>1) or narrowed (<1)
|
||||
# clip_predictions: False # if data_range for respective `queries` is set in reader, `yhat.*` columns will be clipped
|
||||
# anomaly_score_outside_data_range: 1.01 # auto anomaly score (1.01) if `y` (real value) is outside of data_range, if set
|
||||
@@ -795,7 +830,7 @@ models:
|
||||
# schedulers: [all scheduler aliases defined in `scheduler` section]
|
||||
# queries: [all query aliases defined in `reader.queries` section]
|
||||
# detection_direction: 'both' # meaning both drops and spikes will be captured
|
||||
# min_dev_from_expected: 0.0 # meaning, no minimal threshold is applied to prevent smaller anomalies
|
||||
# min_dev_from_expected: [0.0, 0.0] # meaning, no minimal threshold is applied to prevent smaller anomalies
|
||||
# scale: [1.0, 1.0] # if needed, prediction intervals' width can be increased (>1) or narrowed (<1)
|
||||
# clip_predictions: False # if data_range for respective `queries` is set in reader, `yhat.*` columns will be clipped
|
||||
# anomaly_score_outside_data_range: 1.01 # auto anomaly score (1.01) if `y` (real value) is outside of data_range, if set
|
||||
@@ -831,7 +866,7 @@ models:
|
||||
# schedulers: [all scheduler aliases defined in `scheduler` section]
|
||||
# queries: [all query aliases defined in `reader.queries` section]
|
||||
# detection_direction: 'both' # meaning both drops and spikes will be captured
|
||||
# min_dev_from_expected: 0.0 # meaning, no minimal threshold is applied to prevent smaller anomalies
|
||||
# min_dev_from_expected: [0.0, 0.0] # meaning, no minimal threshold is applied to prevent smaller anomalies
|
||||
# scale: [1.0, 1.0] # if needed, prediction intervals' width can be increased (>1) or narrowed (<1)
|
||||
# clip_predictions: False # if data_range for respective `queries` is set in reader, `yhat.*` columns will be clipped
|
||||
# anomaly_score_outside_data_range: 1.01 # auto anomaly score (1.01) if `y` (real value) is outside of data_range, if set
|
||||
@@ -871,7 +906,7 @@ models:
|
||||
# schedulers: [all scheduler aliases defined in `scheduler` section]
|
||||
# queries: [all query aliases defined in `reader.queries` section]
|
||||
# detection_direction: 'both' # meaning both drops and spikes will be captured
|
||||
# min_dev_from_expected: 0.0 # meaning, no minimal threshold is applied to prevent smaller anomalies
|
||||
# min_dev_from_expected: [0.0, 0.0] # meaning, no minimal threshold is applied to prevent smaller anomalies
|
||||
# scale: [1.0, 1.0] # if needed, prediction intervals' width can be increased (>1) or narrowed (<1)
|
||||
# clip_predictions: False # if data_range for respective `queries` is set in reader, `yhat.*` columns will be clipped
|
||||
# anomaly_score_outside_data_range: 1.01 # auto anomaly score (1.01) if `y` (real value) is outside of data_range, if set
|
||||
@@ -907,7 +942,7 @@ models:
|
||||
# schedulers: [all scheduler aliases defined in `scheduler` section]
|
||||
# queries: [all query aliases defined in `reader.queries` section]
|
||||
# detection_direction: 'both' # meaning both drops and spikes will be captured
|
||||
# min_dev_from_expected: 0.0 # meaning, no minimal threshold is applied to prevent smaller anomalies
|
||||
# min_dev_from_expected: [0.0, 0.0] # meaning, no minimal threshold is applied to prevent smaller anomalies
|
||||
# scale: [1.0, 1.0] # if needed, prediction intervals' width can be increased (>1) or narrowed (<1)
|
||||
# clip_predictions: False # if data_range for respective `queries` is set in reader, `yhat.*` columns will be clipped
|
||||
# anomaly_score_outside_data_range: 1.01 # auto anomaly score (1.01) if `y` (real value) is outside of data_range, if set
|
||||
@@ -962,7 +997,7 @@ models:
|
||||
# schedulers: [all scheduler aliases defined in `scheduler` section]
|
||||
# queries: [all query aliases defined in `reader.queries` section]
|
||||
# detection_direction: 'both' # meaning both drops and spikes will be captured
|
||||
# min_dev_from_expected: 0.0 # meaning, no minimal threshold is applied to prevent smaller anomalies
|
||||
# min_dev_from_expected: [0.0, 0.0] # meaning, no minimal threshold is applied to prevent smaller anomalies
|
||||
# scale: [1.0, 1.0] # if needed, prediction intervals' width can be increased (>1) or narrowed (<1)
|
||||
# clip_predictions: False # if data_range for respective `queries` is set in reader, `yhat.*` columns will be clipped
|
||||
# anomaly_score_outside_data_range: 1.01 # auto anomaly score (1.01) if `y` (real value) is outside of data_range, if set
|
||||
@@ -999,7 +1034,7 @@ models:
|
||||
# schedulers: [all scheduler aliases defined in `scheduler` section]
|
||||
# queries: [all query aliases defined in `reader.queries` section]
|
||||
# detection_direction: 'both' # meaning both drops and spikes will be captured
|
||||
# min_dev_from_expected: 0.0 # meaning, no minimal threshold is applied to prevent smaller anomalies
|
||||
# min_dev_from_expected: [0.0, 0.0] # meaning, no minimal threshold is applied to prevent smaller anomalies
|
||||
# scale: [1.0, 1.0] # if needed, prediction intervals' width can be increased (>1) or narrowed (<1)
|
||||
# clip_predictions: False # if data_range for respective `queries` is set in reader, `yhat.*` columns will be clipped
|
||||
# anomaly_score_outside_data_range: 1.01 # auto anomaly score (1.01) if `y` (real value) is outside of data_range, if set
|
||||
@@ -1241,7 +1276,7 @@ monitoring:
|
||||
Let's pull the docker image for `vmanomaly`:
|
||||
|
||||
```sh
|
||||
docker pull victoriametrics/vmanomaly:v1.21.0
|
||||
docker pull victoriametrics/vmanomaly:v1.23.0
|
||||
```
|
||||
|
||||
Now we can run the docker container putting as volumes both config and model file:
|
||||
@@ -1255,7 +1290,7 @@ docker run -it \
|
||||
-v $(PWD)/license:/license \
|
||||
-v $(PWD)/custom_model.py:/vmanomaly/model/custom.py \
|
||||
-v $(PWD)/custom.yaml:/config.yaml \
|
||||
victoriametrics/vmanomaly:v1.21.0 /config.yaml \
|
||||
victoriametrics/vmanomaly:v1.23.0 /config.yaml \
|
||||
--licenseFile=/license
|
||||
```
|
||||
|
||||
|
||||
@@ -65,8 +65,10 @@ There is change{{% available_from "v1.13.0" anomaly %}} of [`queries`](https://d
|
||||
> Having **different** individual `step` args for queries (i.e. `30s` for `q1` and `2m` for `q2`) is not yet supported for [multivariate model](https://docs.victoriametrics.com/anomaly-detection/components/models/#multivariate-models) if you want to run it on several queries simultaneously (i.e. setting [`queries`](https://docs.victoriametrics.com/anomaly-detection/components/models/#queries) arg of a model to [`q1`, `q2`]).
|
||||
|
||||
- `data_range`{{% available_from "v1.15.1" anomaly %}} (list[float | string]): It allows defining **valid** data ranges for input per individual query in `queries`, resulting in:
|
||||
- **High anomaly scores** (>1) when the *data falls outside the expected range*, indicating a data constraint violation.
|
||||
- **Lowest anomaly scores** (=0) when the *model's predictions (`yhat`) fall outside the expected range*, meaning uncertain predictions.
|
||||
- **High anomaly scores** (>1) when the *data falls outside the expected range*, indicating a data range constraint violation (e.g. improperly configured metricsQL query, sensor malfunction, overflows in underlying metrics, etc.). Anomaly scores can be set to a specific value, like `5`, to indicate a strong violation, using the `anomaly_score_outside_data_range` [arg](https://docs.victoriametrics.com/anomaly-detection/components/models/#score-outside-data-range) of a respective model this query is used in.
|
||||
- **Lowest anomaly scores** (=0) when the *model's predictions (`yhat`) fall outside the expected range*, meaning uncertain predictions that does not really aligh with the data.
|
||||
|
||||
Works together with `anomaly_score_outside_data_range` [arg](https://docs.victoriametrics.com/anomaly-detection/components/models/#score-outside-data-range) of a model to determine the anomaly score for such cases as well as with `clip_predictions` [arg](https://docs.victoriametrics.com/anomaly-detection/components/models/#clip-predictions) of a model to clip the predictions to the expected range.
|
||||
|
||||
> If not set explicitly (or if older config style prior to [v1.13.0](https://docs.victoriametrics.com/anomaly-detection/changelog/#v1130)) is used, then it is set to reader-level `data_range` arg{{% available_from "v1.18.1" anomaly %}}
|
||||
|
||||
|
||||
139
docs/anomaly-detection/components/settings.md
Normal file
139
docs/anomaly-detection/components/settings.md
Normal file
@@ -0,0 +1,139 @@
|
||||
---
|
||||
title: Settings
|
||||
weight: 6
|
||||
menu:
|
||||
docs:
|
||||
parent: "vmanomaly-components"
|
||||
weight: 6
|
||||
identifier: "vmanomaly-settings"
|
||||
tags:
|
||||
- metrics
|
||||
- enterprise
|
||||
aliases:
|
||||
- ./settings.html
|
||||
---
|
||||
|
||||
Through the **Settings** section of a config, you can configure the following parameters of the anomaly detection service:
|
||||
|
||||
## Anomaly Score Outside Data Range
|
||||
|
||||
This argument allows you to override the anomaly score for anomalies that are caused by values outside the expected **data range** of particular [query](https://docs.victoriametrics.com/anomaly-detection/components/models#queries). The reasons for such anomalies can be various, such as improperly constructed metricsQL queries, sensor malfunctions, or other issues that lead to unexpected values in the data and reqire investigation.
|
||||
|
||||
> If not set, the [anomaly score](https://docs.victoriametrics.com/anomaly-detection/faq#what-is-anomaly-score) for such anomalies defaults to `1.01` for backward compatibility, however, it is recommended to set it to a higher value, such as `5.0`, to better reflect the severity of anomalies that fall outside the expected data range to catch them faster and check the query for correctness and underlying data for potential issues.
|
||||
|
||||
Here's an example configuration that sets default anomaly score outside expected data range to `5.0` and overrides it for a specific model to `1.5`:
|
||||
|
||||
```yaml
|
||||
settings:
|
||||
n_workers: 4
|
||||
anomaly_score_outside_data_range: 5.0
|
||||
|
||||
schedulers:
|
||||
periodic:
|
||||
class: periodic
|
||||
fit_every: 5m
|
||||
fit_window: 3h
|
||||
infer_every: 30s
|
||||
# other schedulers
|
||||
|
||||
models:
|
||||
zscore_online_override:
|
||||
class: zscore_online
|
||||
z_threshold: 3.5
|
||||
clip_predictions: True
|
||||
# will be inherited from settings.anomaly_score_outside_data_range
|
||||
# anomaly_score_outside_data_range: 5.0
|
||||
zscore_online_override:
|
||||
class: zscore_online
|
||||
z_threshold: 3.5
|
||||
clip_predictions: True
|
||||
anomaly_score_outside_data_range: 1.5 # will override settings.anomaly_score_outside_data_range
|
||||
# other models
|
||||
|
||||
reader:
|
||||
class: vm
|
||||
datasource_url: 'https://play.victoriametrics.com'
|
||||
tenant_id: "0"
|
||||
queries:
|
||||
error_rate:
|
||||
expr: 'rand()*100 + rand()' # example query that generates values between 1 and 100 and sometimes exceeds 100
|
||||
data_range: [0., 100.] # expected data range for the underlying query and business logic
|
||||
# other queries
|
||||
sampling_period: 30s
|
||||
latency_offset: 10ms
|
||||
query_from_last_seen_timestamp: False
|
||||
verify_tls: False
|
||||
# other reader settings
|
||||
|
||||
writer:
|
||||
class: "vm"
|
||||
datasource_url: http://localhost:8428
|
||||
metric_format:
|
||||
__name__: "$VAR"
|
||||
for: "$QUERY_KEY"
|
||||
# other writer settings
|
||||
|
||||
monitoring:
|
||||
push:
|
||||
url: http://localhost:8428
|
||||
push_frequency: 1m
|
||||
# other monitoring settings
|
||||
```
|
||||
|
||||
## Parallelization
|
||||
|
||||
The `n_workers` argument allows you to explicitly specify the number of workers for internal parallelization of the service. This can help improve performance on multicore systems by allowing the service to process multiple tasks in parallel. For backward compatibility, it's set to `1` by default, meaning that the service will run in a single-threaded mode. It should be an integer greater than or equal to `-1`, where `-1` and `0` means that the service will automatically inherit the number of workers based on the number of available CPU cores.
|
||||
|
||||
Increasing the number can be particularly useful when dealing with a high volume of queries returning many (long) timeseries.
|
||||
Decreasing the number can be useful when running the service on a system with limited resources or when you want to reduce the load on the system.
|
||||
|
||||
Here's an example configuration that uses 4 workers for service's internal parallelization:
|
||||
|
||||
```yaml
|
||||
settings:
|
||||
n_workers: 4
|
||||
|
||||
schedulers:
|
||||
periodic:
|
||||
class: periodic
|
||||
fit_every: 5m
|
||||
fit_window: 3h
|
||||
infer_every: 30s
|
||||
# other schedulers
|
||||
|
||||
models:
|
||||
zscore_online_override:
|
||||
class: zscore_online
|
||||
z_threshold: 3.5
|
||||
clip_predictions: True
|
||||
# other models
|
||||
|
||||
reader:
|
||||
class: vm
|
||||
datasource_url: 'https://play.victoriametrics.com'
|
||||
tenant_id: "0"
|
||||
queries:
|
||||
example_query:
|
||||
expr: 'rand() + 1' # example query that generates random values between 1 and 2
|
||||
data_range: [1., 2.]
|
||||
# other queries
|
||||
sampling_period: 30s
|
||||
latency_offset: 10ms
|
||||
query_from_last_seen_timestamp: False
|
||||
verify_tls: False
|
||||
# other reader settings
|
||||
|
||||
writer:
|
||||
class: "vm"
|
||||
datasource_url: http://localhost:8428
|
||||
metric_format:
|
||||
__name__: "$VAR"
|
||||
for: "$QUERY_KEY"
|
||||
# other writer settings
|
||||
|
||||
monitoring:
|
||||
push:
|
||||
url: http://localhost:8428
|
||||
push_frequency: 1m
|
||||
# other monitoring settings
|
||||
```
|
||||
@@ -40,7 +40,7 @@ The value is designed to:
|
||||
- *fall between 0 and 1* if model consider that datapoint is following usual pattern
|
||||
- *exceed 1* if the datapoint is abnormal
|
||||
|
||||
Then, users can enable alerting rules based on the **anomaly score** with [vmalert](#what-is-vmalert).
|
||||
Then, users can enable alerting rules based on the **anomaly score** with [vmalert](#id-2-what-is-vmalert).
|
||||
|
||||
## 2. What is vmalert?
|
||||
|
||||
@@ -387,7 +387,7 @@ services:
|
||||
restart: always
|
||||
vmanomaly:
|
||||
container_name: vmanomaly
|
||||
image: victoriametrics/vmanomaly:v1.21.0
|
||||
image: victoriametrics/vmanomaly:v1.23.0
|
||||
depends_on:
|
||||
- "victoriametrics"
|
||||
ports:
|
||||
|
||||
@@ -390,7 +390,7 @@ config:
|
||||
target_label: kubernetes_pod_name
|
||||
```
|
||||
|
||||
* By updating `remoteWrite` we configuring [vmagent](https://docs.victoriametrics.com/victoriametrics/vmagent/) to write scraped metrics into the `vminsert` service.
|
||||
* By updating `remoteWrite` we're configuring [vmagent](https://docs.victoriametrics.com/victoriametrics/vmagent/) to write scraped metrics into the `vminsert` service.
|
||||
* The second part of this yaml file is needed to add the `metric_relabel_configs` section that helps us to show Kubernetes metrics on the Grafana dashboard.
|
||||
|
||||
|
||||
@@ -473,7 +473,7 @@ By running this command we:
|
||||
* Provision a VictoriaMetrics data source with the url from the output above which we remembered.
|
||||
* Add [this dashboard](https://grafana.com/grafana/dashboards/11176) for [VictoriaMetrics Cluster](https://docs.victoriametrics.com/victoriametrics/cluster-victoriametrics/).
|
||||
* Add [this dashboard](https://grafana.com/grafana/dashboards/12683) for [VictoriaMetrics Agent](https://docs.victoriametrics.com/victoriametrics/vmagent/).
|
||||
* Add [this dashboard](https://grafana.com/grafana/dashboards/14205) dashboard to see Kubernetes cluster metrics.
|
||||
* Add [this dashboard](https://grafana.com/grafana/dashboards/14205) to see Kubernetes cluster metrics.
|
||||
|
||||
|
||||
Please see the output log in your terminal. Copy, paste and run these commands.
|
||||
@@ -505,7 +505,7 @@ The VictoriaMetrics dashboard is also available to use:
|
||||
|
||||
vmagent has its own dashboard:
|
||||
|
||||

|
||||

|
||||
|
||||
## 6. Final thoughts
|
||||
|
||||
|
||||
@@ -18,6 +18,41 @@ according to [these docs](https://docs.victoriametrics.com/victorialogs/quicksta
|
||||
|
||||
## tip
|
||||
|
||||
* FEATURE: [`delete` pipe](https://docs.victoriametrics.com/victorialogs/logsql/#delete-pipe): allow deleting all the fields with common prefix via `... | delete prefix*` syntax.
|
||||
* FEATURE: [`fields` pipe](https://docs.victoriametrics.com/victorialogs/logsql/#fields-pipe): allow keeping all the fields with common prefix via `... | fields prefix*` syntax.
|
||||
* FEATURE: [`copy` pipe](https://docs.victoriametrics.com/victorialogs/logsql/#copy-pipe): allow copying all the fields with common prefix to fields with another common prefix via `... | copy old_prefix* as new_prefix*` syntax.
|
||||
* FEATURE: [`rename` pipe](https://docs.victoriametrics.com/victorialogs/logsql/#rename-pipe): allow renaming all the fields with common prefix to fields with another common prefix via `... | rename old_prefix* as new_prefix*` syntax.
|
||||
* FEATURE: [`unpack_json` pipe](https://docs.victoriametrics.com/victorialogs/logsql/#unpack_json-pipe): allow unpacking JSON fields with common prefix via `... fields (prefix*)` syntax.
|
||||
* FEATURE: [`unpack_logfmt` pipe](https://docs.victoriametrics.com/victorialogs/logsql/#unpack_logfmt-pipe): allow unpacking JSON fields with common prefix via `... fields (prefix*)` syntax.
|
||||
* FEATURE: [`avg` stats function](https://docs.victoriametrics.com/victorialogs/logsql/#avg-stats): allow calculating the average value over all the fields with common prefix via `avg(prefix*)` syntax.
|
||||
* FEATURE: [`max` stats function](https://docs.victoriametrics.com/victorialogs/logsql/#avg-stats): allow calculating the maximum value over all the fields with common prefix via `max(prefix*)` syntax.
|
||||
* FEATURE: [`min` stats function](https://docs.victoriametrics.com/victorialogs/logsql/#avg-stats): allow calculating the minimum value over all the fields with common prefix via `min(prefix*)` syntax.
|
||||
* FEATURE: [`median` stats function](https://docs.victoriametrics.com/victorialogs/logsql/#avg-stats): allow calculating the median value over all the fields with common prefix via `median(prefix*)` syntax.
|
||||
* FEATURE: [`quantile` stats function](https://docs.victoriametrics.com/victorialogs/logsql/#avg-stats): allow calculating the maximum value over all the fields with common prefix via `quantile(prefix*)` syntax.
|
||||
* FEATURE: [`sum` stats function](https://docs.victoriametrics.com/victorialogs/logsql/#sum-stats): allow calculating the sum for all the fields with common prefix via `sum(prefix*)` syntax.
|
||||
* FEATURE: [`sum_len` stats function](https://docs.victoriametrics.com/victorialogs/logsql/#sum_len-stats): allow calculating the sum of byte lengths for all the fields with common prefix via `sum_len(prefix*)` syntax.
|
||||
* FEATURE: [`count` stats function](https://docs.victoriametrics.com/victorialogs/logsql/#count-stats): allow calculating the number of logs with at least a single non-empty field across fields with common prefix via `count(prefix*)` syntax.
|
||||
* FEATURE: [`count_empty` stats function](https://docs.victoriametrics.com/victorialogs/logsql/#count_empty-stats): allow calculating the number of logs with empty fields with common prefix via `count_empty(prefix*)` syntax.
|
||||
* FEATURE: [`rate_sum` stats function](https://docs.victoriametrics.com/victorialogs/logsql/#avg-stats): allow calculating the per-second rate over the sum of all the fields with common prefix via `rate_sum(prefix*)` syntax.
|
||||
* FEATURE: [`row_any` stats function](https://docs.victoriametrics.com/victorialogs/logsql/#avg-stats): allow returning all the fields with common prefix via `row_any(prefix*)` syntax.
|
||||
* FEATURE: [`row_max` stats function](https://docs.victoriametrics.com/victorialogs/logsql/#avg-stats): allow returning all the fields with common prefix via `row_max(max_field, prefix*)` syntax.
|
||||
* FEATURE: [`row_min` stats function](https://docs.victoriametrics.com/victorialogs/logsql/#avg-stats): allow returning all the fields with common prefix via `row_min(min_field, prefix*)` syntax.
|
||||
* FEATURE: [`uniq_values` stats function](https://docs.victoriametrics.com/victorialogs/logsql/#uniq_values-stats): allow fetching unique values for all the fields with common prefix via `uniq_values(prefix*)` syntax.
|
||||
* FEATURE: [`values` stats function](https://docs.victoriametrics.com/victorialogs/logsql/#values-stats): allow fetching values for all the fields with common prefix via `values(prefix*)` syntax.
|
||||
* FEATURE: [`json_values` stats function](https://docs.victoriametrics.com/victorialogs/logsql/#json_values-stats): allow fetching values for all the fields with common prefix via `json_values(prefix*)` syntax.
|
||||
* FEATURE: [`-insert.maxLineSizeBytes`](https://docs.victoriametrics.com/victorialogs/faq/#what-length-a-log-record-is-expected-to-have): add logging of the number of bytes skipped for oversize lines.
|
||||
* FEATURE: add `-insert.disable` and `-select.disable` command-line flags for disabling both public and internal HTTP endpoints (`/insert/*` + `/internal/insert` and `/select/*` + `/internal/select/*` respectively). See [#9061](https://github.com/VictoriaMetrics/VictoriaMetrics/issues/9061).
|
||||
|
||||
* BUGFIX: [query API](https://docs.victoriametrics.com/victorialogs/querying/#querying-logs): properly set storage node authorization in cluster mode when [Basic Auth](https://docs.victoriametrics.com/victorialogs/cluster/#security) is enabled. See [#9080](https://github.com/VictoriaMetrics/VictoriaMetrics/issues/9080).
|
||||
|
||||
## [v1.23.3](https://github.com/VictoriaMetrics/VictoriaMetrics/releases/tag/v1.23.3-victorialogs)
|
||||
|
||||
Released at 2025-06-02
|
||||
|
||||
* BUGFIX: [live tailing API](https://docs.victoriametrics.com/victorialogs/querying/#live-tailing): properly return live tailing results. Previously some of these results could be missing, while others could be returned out of order (e.g. improperly sorted by [`_time` field](https://docs.victoriametrics.com/victorialogs/keyconcepts/#time-field)). The issue has been introduced in [v1.18.0](https://github.com/VictoriaMetrics/VictoriaMetrics/releases/tag/v1.18.0-victorialogs).
|
||||
* BUGFIX: [query API](https://docs.victoriametrics.com/victorialogs/querying/#querying-logs): properly return the last `limit` logs on the selected time range if the `limit` query arg is passed to `/select/logsql/query`. Previously logs could be returned without proper sorting because of the bug, which has been introduced in [v1.18.0](https://github.com/VictoriaMetrics/VictoriaMetrics/releases/tag/v1.18.0-victorialogs).
|
||||
* BUGFIX: [querying HTTP APIs](https://docs.victoriametrics.com/victorialogs/querying/#http-api): properly drop LogsQL pipes from the provided `query` before obtaining field names and values. This is needed in order to properly implement auto-suggestion for log field names and values. See [#9068](https://github.com/VictoriaMetrics/VictoriaMetrics/issues/9068#issuecomment-2931275012).
|
||||
|
||||
## [v1.23.2](https://github.com/VictoriaMetrics/VictoriaMetrics/releases/tag/v1.23.2-victorialogs)
|
||||
|
||||
Released at 2025-05-30
|
||||
@@ -41,7 +76,7 @@ Released at 2025-05-28
|
||||
* FEATURE: [`math` pipe](https://docs.victoriametrics.com/victorialogs/logsql/#math-pipe): add `now()` function, which returns the current [Unix timestamp](https://en.wikipedia.org/wiki/Unix_time) in nanoseconds.
|
||||
|
||||
* BUGFIX: [OpenTelemetry](https://docs.victoriametrics.com/victorialogs/data-ingestion/opentelemetry/): properly handle nested attributes by expanding them into separate top-level fields. See [this issue](https://github.com/VictoriaMetrics/VictoriaMetrics/issues/8862).
|
||||
* BUGFIX: [Datadog](https://docs.victoriametrics.com/victorialogs/data-ingestion/datadog/): respond HTTP 202 instead of HTTP 200 on successful Datadog endpoint ingestion as it's strictly required by Datadog agent. See [#8956](https://github.com/VictoriaMetrics/VictoriaMetrics/issues/8956).
|
||||
* BUGFIX: [Datadog](https://docs.victoriametrics.com/victorialogs/data-ingestion/datadog-agent/): respond HTTP 202 instead of HTTP 200 on successful Datadog endpoint ingestion as it's strictly required by Datadog agent. See [#8956](https://github.com/VictoriaMetrics/VictoriaMetrics/issues/8956).
|
||||
* BUGFIX: [web UI](https://docs.victoriametrics.com/victorialogs/querying/#web-ui): properly escape special characters in field values shown in autocomplete suggestions. See [#8925](https://github.com/VictoriaMetrics/VictoriaMetrics/issues/8925).
|
||||
* BUGFIX: [LogsQL](https://docs.victoriametrics.com/victorialogs/logsql/): Properly handle time filters when querying vlstorage directly or through vlselect. See [#8985](https://github.com/VictoriaMetrics/VictoriaMetrics/issues/8985).
|
||||
* BUGFIX: Self-healing from OOM interruption during the creation of a daily partition. See [#8873](https://github.com/VictoriaMetrics/VictoriaMetrics/issues/8873).
|
||||
|
||||
@@ -36,7 +36,9 @@ VictoriaLogs is optimized specifically for logs. So it provides the following fe
|
||||
- Easy to setup and operate. There is no need in tuning configuration for optimal performance or in creating any indexes for various log types.
|
||||
Just run VictoriaLogs on the most suitable hardware, ingest logs into it via [supported data ingestion protocols](https://docs.victoriametrics.com/victorialogs/data-ingestion/)
|
||||
and get the best available performance out of the box.
|
||||
- Up to 30x less RAM usage than Elasticsearch for the same workload. See [this article](https://itnext.io/how-do-open-source-solutions-for-logs-work-elasticsearch-loki-and-victorialogs-9f7097ecbc2f) for details.
|
||||
- Up to 30x less RAM usage than Elasticsearch for the same workload.
|
||||
See [the post from a user, who replaced 27-node Elasticsearch cluster with a single-node VictoriaLogs](https://aus.social/@phs/114583927679254536).
|
||||
See also [this article](https://itnext.io/how-do-open-source-solutions-for-logs-work-elasticsearch-loki-and-victorialogs-9f7097ecbc2f) for techincal details.
|
||||
- Up to 15x less disk space usage than Elasticsearch for the same amounts of stored logs.
|
||||
- Ability to work efficiently with hundreds of terabytes of logs on a single node.
|
||||
- Easy to use query language optimized for typical log analysis tasks - [LogsQL](https://docs.victoriametrics.com/victorialogs/logsql/).
|
||||
|
||||
@@ -143,7 +143,7 @@ _time:5m error -(buggy_app OR foobar)
|
||||
```
|
||||
|
||||
The parentheses are **required** here, since otherwise the query won't return the expected results.
|
||||
The query `error -buggy_app OR foobar` is interpreted as `(error AND NOT buggy_app) OR foobar` according to [priorities for AND, OR and NOT operator](#logical-filters).
|
||||
The query `error -buggy_app OR foobar` is interpreted as `(error AND NOT buggy_app) OR foobar` according to [priorities for AND, OR and NOT operator](#logical-filter).
|
||||
This query returns logs with `foobar` [word](#word), even if they do not contain `error` word or contain `buggy_app` word.
|
||||
So it is recommended wrapping the needed query parts into explicit parentheses if you are unsure in priority rules.
|
||||
As an additional bonus, explicit parentheses make queries easier to read and maintain.
|
||||
@@ -1651,6 +1651,13 @@ The `as` keyword is optional.
|
||||
|
||||
`cp` keyword can be used instead of `copy` for convenience. For example, `_time:5m | cp foo bar` is equivalent to `_time:5m | copy foo as bar`.
|
||||
|
||||
It is possible to copy multiple fields with identical prefix to fields with another prefix. For example, the following query copies
|
||||
all the fields with the prefix `foo` to fields with the prefix `bar`:
|
||||
|
||||
```logsql
|
||||
_time:5m | copy foo* as bar*
|
||||
```
|
||||
|
||||
See also:
|
||||
|
||||
- [`rename` pipe](#rename-pipe)
|
||||
@@ -1694,6 +1701,12 @@ _time:5m | delete host, app
|
||||
|
||||
`drop`, `del` and `rm` keywords can be used instead of `delete` for convenience. For example, `_time:5m | drop host` is equivalent to `_time:5m | delete host`.
|
||||
|
||||
It is possible to delete fields with common prefix. For example, the following query deletes all the fields with `foo` prefix:
|
||||
|
||||
```logsql
|
||||
_time:5m | delete foo*
|
||||
```
|
||||
|
||||
See also:
|
||||
|
||||
- [`rename` pipe](#rename-pipe)
|
||||
@@ -2028,6 +2041,13 @@ _time:5m | fields host, _msg
|
||||
_time:5m | keep host, _msg
|
||||
```
|
||||
|
||||
It is possible to use wildcard prefixes in the list of fields to keep. For example, the following query keeps all the fields with names starting with `foo` prefix,
|
||||
while drops the rest of the fields:
|
||||
|
||||
```logsql
|
||||
_time:5m | fields foo*
|
||||
```
|
||||
|
||||
See also:
|
||||
|
||||
- [`copy` pipe](#copy-pipe)
|
||||
@@ -2567,6 +2587,25 @@ The `as` keyword is optional.
|
||||
|
||||
`mv` keyword can be used instead of `rename` keyword for convenience. For example, `_time:5m | mv foo bar` is equivalent to `_time:5m | rename foo as bar`.
|
||||
|
||||
It is possible to rename multiple fields with the given prefix to fields with another prefix. For example, the following query renames all the fields
|
||||
starting with `foo` prefix to fields starting with `bar` prefix:
|
||||
|
||||
```logsql
|
||||
_time:5m | rename foo* as bar*
|
||||
```
|
||||
|
||||
It is also possible removing common prefix from some fields. For example, the following query removes `foo` prefix from all the fields, which start with `foo`:
|
||||
|
||||
```logsql
|
||||
_time:5m | rename foo* as *
|
||||
```
|
||||
|
||||
It is also possible adding common prefix to all the fields. For example, the following query adds `foo` prefix to all the fields:
|
||||
|
||||
```logsql
|
||||
_time:5m | rename * as foo*
|
||||
```
|
||||
|
||||
See also:
|
||||
|
||||
- [`copy` pipe](#copy-pipe)
|
||||
@@ -3047,14 +3086,6 @@ for `ip` [field](https://docs.victoriametrics.com/victorialogs/keyconcepts/#data
|
||||
_time:5m | top by (ip)
|
||||
```
|
||||
|
||||
The `by (...)` part in the `top` [pipe](#pipes) is optional. If it is skipped, then all the log fields are taken into account
|
||||
when determining top field sets. This is useful when the field sets are already limited by other pipes such as [`fields` pipe](#fields-pipe).
|
||||
For example, the following query is equivalent to the previous one:
|
||||
|
||||
```logsql
|
||||
_time:5m | fields ip | top
|
||||
```
|
||||
|
||||
It is possible to give another name for the `hits` field via `hits as <new_name>` syntax. For example, the following query returns top per-`path` hits in the `visits` field:
|
||||
|
||||
```logsql
|
||||
@@ -3174,6 +3205,8 @@ fields from JSON value stored in `my_json` [log field](https://docs.victoriametr
|
||||
_time:5m | unpack_json from my_json fields (foo, bar)
|
||||
```
|
||||
|
||||
If it is needed to extract all the fields with some common prefix, then this can be done via `fields(prefix*)` syntax.
|
||||
|
||||
If it is needed to preserve the original non-empty field values, then add `keep_original_fields` to the end of `unpack_json ...`. For example,
|
||||
the following query preserves the original non-empty values for `ip` and `host` fields instead of overwriting them with the unpacked values:
|
||||
|
||||
@@ -3259,6 +3292,8 @@ from logfmt stored in the `my_logfmt` field:
|
||||
_time:5m | unpack_logfmt from my_logfmt fields (foo, bar)
|
||||
```
|
||||
|
||||
If it is needed to extract all the fields with some common prefix, then this can be done via `fields(prefix*)` syntax.
|
||||
|
||||
If it is needed to preserve the original non-empty field values, then add `keep_original_fields` to the end of `unpack_logfmt ...`. For example,
|
||||
the following query preserves the original non-empty values for `ip` and `host` fields instead of overwriting them with the unpacked values:
|
||||
|
||||
@@ -3506,6 +3541,13 @@ over logs for the last 5 minutes:
|
||||
_time:5m | stats avg(duration) avg_duration
|
||||
```
|
||||
|
||||
It is possible to calculate the average over fields with common prefix via `avg(prefix*)` syntax. For example, the following query calculates the average
|
||||
over all the log fields with `foo` prefix:
|
||||
|
||||
```logsql
|
||||
_time:5m | stats avg(foo*)
|
||||
```
|
||||
|
||||
See also:
|
||||
|
||||
- [`median`](#median-stats)
|
||||
@@ -3540,6 +3582,13 @@ over the last 5 minutes:
|
||||
_time:5m | stats count(username, password) logs_with_username_or_password
|
||||
```
|
||||
|
||||
It is possible to caclulate the number of logs with at least a single non-empty field with common prefix with `count(prefix*)` syntax.
|
||||
For example, the following query returns the number of logs with at least a single non-empty field with `foo` prefix over the last 5 minutes:
|
||||
|
||||
```logsql
|
||||
_time:5m | stats count(foo*)
|
||||
```
|
||||
|
||||
See also:
|
||||
|
||||
- [`rate`](#rate-stats)
|
||||
@@ -3560,6 +3609,13 @@ during the last 5 minutes:
|
||||
_time:5m | stats count_empty(username) logs_with_missing_username
|
||||
```
|
||||
|
||||
It is possible to calculate the number of logs with empty fields with common prefix via `count_empty(prefix*)` syntax. For example, the following query
|
||||
calculates the number of logs with empty fields with `foo` prefix during the last 5 minutes:
|
||||
|
||||
```logsql
|
||||
_time:5m | stats count_empty(foo*)
|
||||
```
|
||||
|
||||
See also:
|
||||
|
||||
- [`count`](#count-stats)
|
||||
@@ -3685,6 +3741,8 @@ If the list of fields is empty, then all the log fields are encoded into JSON ar
|
||||
_time:5m | stats json_values() as json_logs
|
||||
```
|
||||
|
||||
It is possible to select values with the given prefix via `json_values(prefix*)` syntax.
|
||||
|
||||
It is possible to set the upper limit on the number of JSON-encoded logs with the `limit N` suffix. For example, the following query
|
||||
returns up to 3 JSON-encoded logs per every `host`:
|
||||
|
||||
@@ -3709,6 +3767,8 @@ over logs for the last 5 minutes:
|
||||
_time:5m | stats max(duration) max_duration
|
||||
```
|
||||
|
||||
It is possible to calculate the maximum value across all the fields with common prefix via `max(prefix*)` syntax.
|
||||
|
||||
[`row_max`](#row_max-stats) function can be used for obtaining other fields with the maximum duration.
|
||||
|
||||
See also:
|
||||
@@ -3730,6 +3790,8 @@ over logs for the last 5 minutes:
|
||||
_time:5m | stats median(duration) median_duration
|
||||
```
|
||||
|
||||
It is possible to calculate the median across all the fields with common prefix via `median(prefix*)` syntax.
|
||||
|
||||
See also:
|
||||
|
||||
- [`quantile`](#quantile-stats)
|
||||
@@ -3747,6 +3809,8 @@ over logs for the last 5 minutes:
|
||||
_time:5m | stats min(duration) min_duration
|
||||
```
|
||||
|
||||
It is possible to find the minimum across all the fields with common prefix via `min(prefix*)` syntax.
|
||||
|
||||
[`row_min`](#row_min-stats) function can be used for obtaining other fields with the minimum duration.
|
||||
|
||||
See also:
|
||||
@@ -3772,6 +3836,8 @@ _time:5m | stats
|
||||
quantile(0.99, request_duration_seconds) p99
|
||||
```
|
||||
|
||||
It is possible to calculate the quantile across all the fields with common prefix via `quantile(phi, prefix*)` syntax.
|
||||
|
||||
See also:
|
||||
|
||||
- [`histogram`](#histogram-stats)
|
||||
@@ -3807,6 +3873,8 @@ over the last 5 minutes:
|
||||
_time:5m | stats rate_sum(bytes_sent)
|
||||
```
|
||||
|
||||
It is possible to calculate the average per-second rate of the sum over all the fields starting with particular prefix by using `rate_sum(prefix*)` syntax.
|
||||
|
||||
See also:
|
||||
|
||||
- [`sum`](#sum-stats)
|
||||
@@ -3833,6 +3901,8 @@ For example, the following query returns only `_time` and `path` fields from a s
|
||||
_time:5m | stats row_any(_time, path) as time_and_path_sample
|
||||
```
|
||||
|
||||
It is possible to return all the fields starting with particular prefix by using `row_any(prefix*)` syntax.
|
||||
|
||||
See also:
|
||||
|
||||
- [`row_max`](#row_max-stats)
|
||||
@@ -3859,6 +3929,8 @@ For example, the following query returns only `_time`, `path` and `duration` fie
|
||||
_time:5m | stats row_max(duration, _time, path, duration) as time_and_path_with_max_duration
|
||||
```
|
||||
|
||||
It is possible to return all the fields starting with particular prefix by using `row_max(field, prefix*)` syntax.
|
||||
|
||||
See also:
|
||||
|
||||
- [`max`](#max-stats)
|
||||
@@ -3886,6 +3958,8 @@ For example, the following query returns only `_time`, `path` and `duration` fie
|
||||
_time:5m | stats row_min(duration, _time, path, duration) as time_and_path_with_min_duration
|
||||
```
|
||||
|
||||
It is possible to return all the fields starting with particular prefix by using `row_min(field, prefix*)` syntax.
|
||||
|
||||
See also:
|
||||
|
||||
- [`min`](#min-stats)
|
||||
@@ -3904,6 +3978,8 @@ over logs for the last 5 minutes:
|
||||
_time:5m | stats sum(duration) sum_duration
|
||||
```
|
||||
|
||||
It is possible to find the sum for all the fields with common prefix via `sum(prefix*)` syntax.
|
||||
|
||||
See also:
|
||||
|
||||
- [`count`](#count-stats)
|
||||
@@ -3923,6 +3999,8 @@ across all the logs for the last 5 minutes:
|
||||
_time:5m | stats sum_len(_msg) messages_len
|
||||
```
|
||||
|
||||
It is possible to find the sum of byte lengths for all the fields with common prefix via `sum_len(prefix*)` syntax.
|
||||
|
||||
See also:
|
||||
|
||||
- [`count`](#count-stats)
|
||||
@@ -3955,6 +4033,8 @@ _time:5m | stats uniq_values(ip) limit 100 as unique_ips_100
|
||||
|
||||
Arbitrary subset of unique `ip` values is returned every time if the `limit` is reached.
|
||||
|
||||
It is possible to find unique values for all the fields with common prefix via `uniq_values(prefix*)` syntax.
|
||||
|
||||
See also:
|
||||
|
||||
- [`uniq` pipe](#uniq-pipe)
|
||||
@@ -3978,6 +4058,8 @@ _time:5m | stats values(ip) ips
|
||||
|
||||
The returned ip addresses can be unrolled into distinct log entries with [`unroll` pipe](#unroll-pipe).
|
||||
|
||||
It is possible to get values for all the fields with common prefix via `values(prefix*)` syntax.
|
||||
|
||||
See also:
|
||||
|
||||
- [`json_values`](#json_values-stats)
|
||||
@@ -4107,7 +4189,7 @@ Internally duration values are converted into nanoseconds.
|
||||
- It is highly recommended specifying [stream filter](#stream-filter) in order to narrow down the search
|
||||
to specific [log streams](https://docs.victoriametrics.com/victorialogs/keyconcepts/#stream-fields).
|
||||
- It is recommended specifying [log fields](https://docs.victoriametrics.com/victorialogs/keyconcepts/#data-model) you need in query results
|
||||
with the [`field` pipe](#fields-pipe), if the selected log entries contain big number of fields, which aren't interesting to you.
|
||||
with the [`fields` pipe](#fields-pipe), if the selected log entries contain big number of fields, which aren't interesting to you.
|
||||
This saves disk read IO and CPU time needed for reading and unpacking all the log fields from disk.
|
||||
- Move faster filters such as [word filter](#word-filter) and [phrase filter](#phrase-filter) to the beginning of the query.
|
||||
This rule doesn't apply to [time filter](#time-filter) and [stream filter](#stream-filter), which can be put at any place of the query.
|
||||
|
||||
@@ -36,8 +36,8 @@ Just download archive for the needed Operating system and architecture, unpack i
|
||||
For example, the following commands download VictoriaLogs archive for Linux/amd64, unpack and run it:
|
||||
|
||||
```sh
|
||||
curl -L -O https://github.com/VictoriaMetrics/VictoriaMetrics/releases/download/v1.23.1-victorialogs/victoria-logs-linux-amd64-v1.23.1-victorialogs.tar.gz
|
||||
tar xzf victoria-logs-linux-amd64-v1.23.1-victorialogs.tar.gz
|
||||
curl -L -O https://github.com/VictoriaMetrics/VictoriaMetrics/releases/download/v1.23.3-victorialogs/victoria-logs-linux-amd64-v1.23.3-victorialogs.tar.gz
|
||||
tar xzf victoria-logs-linux-amd64-v1.23.3-victorialogs.tar.gz
|
||||
./victoria-logs-prod -storageDataPath=victoria-logs-data
|
||||
```
|
||||
|
||||
@@ -61,7 +61,7 @@ Here is the command to run VictoriaLogs in a Docker container:
|
||||
|
||||
```sh
|
||||
docker run --rm -it -p 9428:9428 -v ./victoria-logs-data:/victoria-logs-data \
|
||||
docker.io/victoriametrics/victoria-logs:v1.23.1-victorialogs -storageDataPath=victoria-logs-data
|
||||
docker.io/victoriametrics/victoria-logs:v1.23.3-victorialogs -storageDataPath=victoria-logs-data
|
||||
```
|
||||
|
||||
See also:
|
||||
|
||||
@@ -4,7 +4,8 @@ from [VictoriaMetrics](https://github.com/VictoriaMetrics/VictoriaMetrics/).
|
||||
VictoriaLogs provides the following features:
|
||||
|
||||
- It is resource-efficient and fast. It uses up to 30x less RAM and up to 15x less disk space than other solutions such as Elasticsearch and Grafana Loki.
|
||||
See [benchmarks](#benchmarks) and [this article](https://itnext.io/how-do-open-source-solutions-for-logs-work-elasticsearch-loki-and-victorialogs-9f7097ecbc2f) for details.
|
||||
See [these benchmarks](#benchmarks) and [this article](https://itnext.io/how-do-open-source-solutions-for-logs-work-elasticsearch-loki-and-victorialogs-9f7097ecbc2f) for details.
|
||||
See also [the post from a happy user, who replaced 27-node Elasticsearch with a single-node VictoriaLogs](https://aus.social/@phs/114583927679254536).
|
||||
- VictoriaLogs' capacity and performance scales linearly with the available resources (CPU, RAM, disk IO, disk space).
|
||||
It runs smoothly on Raspberry PI and on servers with hundreds of CPU cores and terabytes of RAM.
|
||||
It can scale horizontally to many nodes in [cluster mode](https://docs.victoriametrics.com/victorialogs/cluster/).
|
||||
@@ -397,6 +398,8 @@ Pass `-help` to VictoriaLogs in order to see the list of supported command-line
|
||||
The following optional suffixes are supported: s (second), h (hour), d (day), w (week), y (year). If suffix isn't set, then the duration is counted in months (default 2d)
|
||||
-http.connTimeout duration
|
||||
Incoming connections to -httpListenAddr are closed after the configured timeout. This may help evenly spreading load among a cluster of services behind TCP-level load balancer. Zero value disables closing of incoming connections (default 2m0s)
|
||||
-http.disableCORS
|
||||
Disable CORS for all origins (*)
|
||||
-http.disableResponseCompression
|
||||
Disable compression of HTTP responses to save CPU resources. By default, compression is enabled to save network bandwidth
|
||||
-http.header.csp string
|
||||
@@ -430,6 +433,8 @@ Pass `-help` to VictoriaLogs in order to see the list of supported command-line
|
||||
The interval for guaranteed saving of in-memory data to disk. The saved data survives unclean shutdowns such as OOM crash, hardware reset, SIGKILL, etc. Bigger intervals may help increase the lifetime of flash storage with limited write cycles (e.g. Raspberry PI). Smaller intervals increase disk IO load. Minimum supported value is 1s (default 5s)
|
||||
-insert.concurrency int
|
||||
The average number of concurrent data ingestion requests, which can be sent to every -storageNode (default 2)
|
||||
-insert.disable
|
||||
Whether to disable /insert/* HTTP endpoints
|
||||
-insert.disableCompression
|
||||
Whether to disable compression when sending the ingested data to -storageNode nodes. Disabled compression reduces CPU usage at the cost of higher network usage
|
||||
-insert.maxFieldsPerLine int
|
||||
@@ -497,7 +502,7 @@ Pass `-help` to VictoriaLogs in order to see the list of supported command-line
|
||||
The maximum size in bytes of a single Loki request
|
||||
Supports the following optional suffixes for size values: KB, MB, GB, TB, KiB, MiB, GiB, TiB (default 67108864)
|
||||
-maxConcurrentInserts int
|
||||
The maximum number of concurrent insert requests. Set higher value when clients send data over slow networks. Default value depends on the number of available CPU cores. It should work fine in most cases since it minimizes resource usage. See also -insert.maxQueueDuration
|
||||
The maximum number of concurrent insert requests. Set higher value when clients send data over slow networks. Default value depends on the number of available CPU cores. It should work fine in most cases since it minimizes resource usage. See also -insert.maxQueueDuration (default 28)
|
||||
-memory.allowedBytes size
|
||||
Allowed size of system memory VictoriaMetrics caches may occupy. This option overrides -memory.allowedPercent if set to a non-zero value. Too low a value may increase the cache miss rate usually resulting in higher CPU and disk IO usage. Too high a value may evict too much data from the OS page cache resulting in higher disk IO usage
|
||||
Supports the following optional suffixes for size values: KB, MB, GB, TB, KiB, MiB, GiB, TiB (default 0)
|
||||
@@ -545,11 +550,13 @@ Pass `-help` to VictoriaLogs in order to see the list of supported command-line
|
||||
Log entries with timestamps older than now-retentionPeriod are automatically deleted; log entries with timestamps outside the retention are also rejected during data ingestion; the minimum supported retention is 1d (one day); see https://docs.victoriametrics.com/victorialogs/#retention ; see also -retention.maxDiskSpaceUsageBytes
|
||||
The following optional suffixes are supported: s (second), h (hour), d (day), w (week), y (year). If suffix isn't set, then the duration is counted in months (default 7d)
|
||||
-search.maxConcurrentRequests int
|
||||
The maximum number of concurrent search requests. It shouldn't be high, since a single request can saturate all the CPU cores, while many concurrently executed requests may require high amounts of memory. See also -search.maxQueueDuration
|
||||
The maximum number of concurrent search requests. It shouldn't be high, since a single request can saturate all the CPU cores, while many concurrently executed requests may require high amounts of memory. See also -search.maxQueueDuration (default 14)
|
||||
-search.maxQueryDuration duration
|
||||
The maximum duration for query execution. It can be overridden to a smaller value on a per-query basis via 'timeout' query arg (default 30s)
|
||||
-search.maxQueueDuration duration
|
||||
The maximum time the search request waits for execution when -search.maxConcurrentRequests limit is reached; see also -search.maxQueryDuration (default 10s)
|
||||
-select.disable
|
||||
Whether to disable /select/* HTTP endpoints
|
||||
-select.disableCompression
|
||||
Whether to disable compression for select query responses received from -storageNode nodes. Disabled compression reduces CPU usage at the cost of higher network usage
|
||||
-storage.minFreeDiskSpaceBytes size
|
||||
@@ -613,6 +620,14 @@ Pass `-help` to VictoriaLogs in order to see the list of supported command-line
|
||||
Compression method for syslog messages received at the corresponding -syslog.listenAddr.udp. Supported values: none, gzip, deflate. See https://docs.victoriametrics.com/victorialogs/data-ingestion/syslog/#compression
|
||||
Supports an array of values separated by comma or specified via multiple flags.
|
||||
Value can contain comma inside single-quoted or double-quoted string, {}, [] and () braces.
|
||||
-syslog.decolorizeFields.tcp array
|
||||
Fields to remove ANSI color codes across logs ingested via the corresponding -syslog.listenAddr.tcp. See https://docs.victoriametrics.com/victorialogs/data-ingestion/syslog/#decolorizing-fields
|
||||
Supports an array of values separated by comma or specified via multiple flags.
|
||||
Value can contain comma inside single-quoted or double-quoted string, {}, [] and () braces.
|
||||
-syslog.decolorizeFields.udp array
|
||||
Fields to remove ANSI color codes across logs ingested via the corresponding -syslog.listenAddr.udp. See https://docs.victoriametrics.com/victorialogs/data-ingestion/syslog/#decolorizing-fields
|
||||
Supports an array of values separated by comma or specified via multiple flags.
|
||||
Value can contain comma inside single-quoted or double-quoted string, {}, [] and () braces.
|
||||
-syslog.extraFields.tcp array
|
||||
Fields to add to logs ingested via the corresponding -syslog.listenAddr.tcp. See https://docs.victoriametrics.com/victorialogs/data-ingestion/syslog/#adding-extra-fields
|
||||
Supports an array of values separated by comma or specified via multiple flags.
|
||||
|
||||
@@ -130,6 +130,17 @@ It is also recommended authorizing HTTPS requests to `vlstorage` via Basic Auth:
|
||||
Another option is to use third-party HTTP proxies such as [vmauth](https://docs.victoriametrics.com/victoriametrics/vmauth/), `nginx`, etc. for authorizing and encrypting communications
|
||||
between VictoriaLogs cluster components over untrusted networks.
|
||||
|
||||
By default, all the logs component (vlinsert, vlselect, vlstorage) support all the HTTP endpoints including `/insert/*` and `/select/*`. It's recommended to disable select endpoints on `vlinsert` and insert endpoints on `vlselect`:
|
||||
|
||||
```sh
|
||||
# Disable select endpoints on vlinsert
|
||||
./victoria-logs-prod -storageNode=... -select.disable
|
||||
|
||||
# Disable insert endpoints on vlselect
|
||||
./victoria-logs-prod -storageNode=... -insert.disable
|
||||
```
|
||||
|
||||
This helps prevent sending select requests to `vlinsert` nodes or insert requests to `vlselect` nodes in case of misconfiguration in the authorization proxy in front of the `vlinsert` and `vlselect` nodes.
|
||||
|
||||
## Quick start
|
||||
|
||||
@@ -144,8 +155,8 @@ The following guide covers the following topics for Linux host:
|
||||
Download and unpack the latest VictoriaLogs release:
|
||||
|
||||
```sh
|
||||
curl -L -O https://github.com/VictoriaMetrics/VictoriaMetrics/releases/download/v1.23.1-victorialogs/victoria-logs-linux-amd64-v1.23.1-victorialogs.tar.gz
|
||||
tar xzf victoria-logs-linux-amd64-v1.23.1-victorialogs.tar.gz
|
||||
curl -L -O https://github.com/VictoriaMetrics/VictoriaMetrics/releases/download/v1.23.3-victorialogs/victoria-logs-linux-amd64-v1.23.3-victorialogs.tar.gz
|
||||
tar xzf victoria-logs-linux-amd64-v1.23.3-victorialogs.tar.gz
|
||||
```
|
||||
|
||||
Start the first [`vlstorage` node](#architecture), which accepts incoming requests at the port `9491` and stores the ingested logs at `victoria-logs-data-1` directory:
|
||||
|
||||
@@ -10,6 +10,7 @@ url: /victorialogs/data-ingestion/datadog-agent/
|
||||
tags:
|
||||
- logs
|
||||
aliases:
|
||||
- /victorialogs/data-ingestion/datadog/
|
||||
- /victorialogs/data-ingestion/DataDogAgent.html
|
||||
---
|
||||
|
||||
|
||||
@@ -46,7 +46,7 @@ See [the list of supported Journald fields](https://www.freedesktop.org/software
|
||||
## Multitenancy
|
||||
|
||||
By default VictoriaLogs stores logs ingested via journald protocol into `(AccountID=0, ProjectID=0)` [tenant](https://docs.victoriametrics.com/victorialogs/#multitenancy).
|
||||
This can be changed by passing the needed tenant in the format `AccountID:ProjectID` at the `-journlad.tenantID` command-line flag.
|
||||
This can be changed by passing the needed tenant in the format `AccountID:ProjectID` at the `-journald.tenantID` command-line flag.
|
||||
For example, `-journald.tenantID=123:456` would store logs ingested via journald protocol into `(AccountID=123, ProjectID=456)` tenant.
|
||||
|
||||
See also:
|
||||
|
||||
@@ -25,8 +25,8 @@ or from docker images at [Docker Hub](https://hub.docker.com/r/victoriametrics/v
|
||||
### Running `vlogscli` from release binary
|
||||
|
||||
```sh
|
||||
curl -L -O https://github.com/VictoriaMetrics/VictoriaMetrics/releases/download/v1.23.1-victorialogs/vlogscli-linux-amd64-v1.23.1-victorialogs.tar.gz
|
||||
tar xzf vlogscli-linux-amd64-v1.23.1-victorialogs.tar.gz
|
||||
curl -L -O https://github.com/VictoriaMetrics/VictoriaMetrics/releases/download/v1.23.3-victorialogs/vlogscli-linux-amd64-v1.23.3-victorialogs.tar.gz
|
||||
tar xzf vlogscli-linux-amd64-v1.23.3-victorialogs.tar.gz
|
||||
./vlogscli-prod
|
||||
```
|
||||
|
||||
|
||||
@@ -24,8 +24,8 @@ _Note: This page provides only integration instructions for vmalert and Victoria
|
||||
|
||||
Run vmalert with the following settings:
|
||||
```sh
|
||||
./bin/vmalert -rule=alert.rules \ # Path to the files or http url with alerting and/or recording rules in YAML format.
|
||||
-datasource.url=http://victorialogs:9428 \ # VictoriaLogs address.
|
||||
./bin/vmalert -rule=alert.rules \ # Path to the files or http url with alerting and/or recording rules in YAML format
|
||||
-datasource.url=http://victorialogs:9428 \ # VictoriaLogs address
|
||||
-notifier.url=http://alertmanager:9093 \ # AlertManager URL (required if alerting rules are used)
|
||||
-remoteWrite.url=http://victoriametrics:8428 \ # Remote write compatible storage to persist recording rules and alerts state info
|
||||
-remoteRead.url=http://victoriametrics:8428 \ # Prometheus HTTP API compatible datasource to restore alerts state from
|
||||
@@ -33,7 +33,7 @@ Run vmalert with the following settings:
|
||||
|
||||
> Note: By default, vmalert assumes all configured rules have `prometheus` type and will validate them accordingly.
|
||||
> For rules in [LogsQL](https://docs.victoriametrics.com/victorialogs/logsql/) specify `type: vlogs` on [Group level](#groups).
|
||||
> Or set `-rule.defaultRuleType=vlogs` cmd-line flag to apply `type: vlogs` to all configured groups.
|
||||
> Or set `-rule.defaultRuleType=vlogs` cmd-line flag to change the default rule type.
|
||||
|
||||
Each `-rule` file may contain arbitrary number of [groups](https://docs.victoriametrics.com/victoriametrics/vmalert/#groups).
|
||||
See examples in [Groups](#groups) section. See the full list of configuration flags and their descriptions in [configuration](#configuration) section.
|
||||
@@ -42,10 +42,10 @@ With configuration example above, vmalert will perform the following interaction
|
||||

|
||||
|
||||
1. Rules listed in `-rule` file are executed against VictoriaLogs service configured via `-datasource.url`;
|
||||
1. Triggered alerting notifications are sent to [Alertmanager](https://github.com/prometheus/alertmanager) service configured via `-notifier.url`;
|
||||
1. Results of recording rules expressions and alerts state are persisted to Prometheus-compatible remote-write endpoint
|
||||
2. Triggered alerting notifications are sent to [Alertmanager](https://github.com/prometheus/alertmanager) service configured via `-notifier.url`;
|
||||
3. Results of recording rules expressions and alerts state are persisted to Prometheus-compatible remote-write endpoint
|
||||
(i.e. VictoriaMetrics) configured via `-remoteWrite.url`;
|
||||
1. On vmalert restarts, alerts state [can be restored](https://docs.victoriametrics.com/victoriametrics/vmalert/#alerts-state-on-restarts)
|
||||
4. On vmalert restarts, alerts state [can be restored](https://docs.victoriametrics.com/victoriametrics/vmalert/#alerts-state-on-restarts)
|
||||
by querying Prometheus-compatible HTTP API endpoint (i.e. VictoriaMetrics) configured via `-remoteRead.url`.
|
||||
|
||||
## Configuration
|
||||
@@ -130,12 +130,8 @@ groups:
|
||||
rules:
|
||||
- record: nginxRequestCount
|
||||
expr: 'env: "test" AND service: "nginx" | stats count(*) as requests'
|
||||
annotations:
|
||||
description: "Service nginx on env test accepted {{$labels.requests}} requests in the last 5 minutes"
|
||||
- record: prodRequestCount
|
||||
expr: 'env: "prod" | stats by (service) count(*) as requests'
|
||||
annotations:
|
||||
description: "Service {{$labels.service}} on env prod accepted {{$labels.requests}} requests in the last 5 minutes"
|
||||
```
|
||||
|
||||
## Time filter
|
||||
@@ -176,11 +172,11 @@ _Please note, vmalert doesn't support [backfilling](#rules-backfilling) for rule
|
||||
vmalert supports alerting and recording rules backfilling (aka replay) against VictoriaLogs as the datasource.
|
||||
```sh
|
||||
./bin/vmalert -rule=path/to/your.rules \ # path to files with rules you usually use with vmalert
|
||||
-datasource.url=http://localhost:9428 \ # VictoriaLogs address.
|
||||
-rule.defaultRuleType=vlogs \ # Set default rule type to VictoriaLogs.
|
||||
-datasource.url=http://localhost:9428 \ # VictoriaLogs address
|
||||
-rule.defaultRuleType=vlogs \ # Set default rule type to VictoriaLogs
|
||||
-remoteWrite.url=http://localhost:8428 \ # Remote write compatible storage to persist rules and alerts state info
|
||||
-replay.timeFrom=2021-05-11T07:21:43Z \ # to start replay from
|
||||
-replay.timeTo=2021-05-29T18:40:43Z # to finish replay by, is optional
|
||||
-replay.timeTo=2021-05-29T18:40:43Z # to finish replay by, optional. By default, set to the current time
|
||||
```
|
||||
|
||||
See more details about backfilling [here](https://docs.victoriametrics.com/victoriametrics/vmalert/#rules-backfilling).
|
||||
@@ -208,7 +204,7 @@ groups:
|
||||
expr: '* | stats by (service) quantile(0.5, request_duration_seconds) p50, quantile(0.9, request_duration_seconds) p90, quantile(0.99, request_duration_seconds) p99'
|
||||
```
|
||||
|
||||
This creates three metrics for each service:
|
||||
This rule generates three metrics per service in each evaluation:
|
||||
```
|
||||
requestDurationQuantile{stats_result="p50", service="service-1"}
|
||||
requestDurationQuantile{stats_result="p90", service="service-1"}
|
||||
|
||||
@@ -9,7 +9,7 @@ for further details about importing time series data into VictoriaMetrics.
|
||||
<br>
|
||||
|
||||
## Get Started
|
||||
* [Quick Start](/victoriametrics-cloud/quickstart/) documentation.
|
||||
* [Quick Start](https://docs.victoriametrics.com/victoriametrics-cloud/get-started/quickstart/) documentation.
|
||||
* [Try it now](https://console.victoriametrics.cloud/signUp?utm_source=website&utm_campaign=docs_overview) with a free trial.
|
||||
|
||||
|
||||
@@ -21,7 +21,7 @@ VictoriaMetrics Cloud is designed for teams and organizations that handle any vo
|
||||
* Efficient replacement for InfluxDB and OpenTSDB by consuming lower amounts of RAM, CPU and disk.
|
||||
* Cost-efficient alternative for other Observability services like DataDog or Grafana Cloud.
|
||||
|
||||
Discover VictoriaMetrics Cloud Features and Benefits [here](/victoriametrics-cloud/get-started/features).
|
||||
Discover VictoriaMetrics Cloud Features and Benefits [here](https://docs.victoriametrics.com/victoriametrics-cloud/get-started/features/).
|
||||
|
||||
## Learn more
|
||||
* [VictoriaMetrics Cloud announcement](https://victoriametrics.com/blog/introduction-to-managed-monitoring/).
|
||||
|
||||
@@ -3,7 +3,7 @@ title: Deployments
|
||||
weight: 0
|
||||
menu:
|
||||
docs:
|
||||
weight: 5
|
||||
weight: 3
|
||||
parent: cloud
|
||||
identifier: deployments
|
||||
pageRef: /victoriametrics-cloud/deployments/
|
||||
|
||||
BIN
docs/victoriametrics-cloud/explore-cardinality.webp
Normal file
BIN
docs/victoriametrics-cloud/explore-cardinality.webp
Normal file
Binary file not shown.
|
After Width: | Height: | Size: 49 KiB |
BIN
docs/victoriametrics-cloud/explore-query.webp
Normal file
BIN
docs/victoriametrics-cloud/explore-query.webp
Normal file
Binary file not shown.
|
After Width: | Height: | Size: 58 KiB |
BIN
docs/victoriametrics-cloud/explore-tools.webp
Normal file
BIN
docs/victoriametrics-cloud/explore-tools.webp
Normal file
Binary file not shown.
|
After Width: | Height: | Size: 46 KiB |
120
docs/victoriametrics-cloud/exploring-data.md
Normal file
120
docs/victoriametrics-cloud/exploring-data.md
Normal file
@@ -0,0 +1,120 @@
|
||||
---
|
||||
weight: 10
|
||||
title: Exploring Data
|
||||
menu:
|
||||
docs:
|
||||
parent: "cloud"
|
||||
weight: 4
|
||||
name: Exploring Data
|
||||
tags:
|
||||
- metrics
|
||||
- cloud
|
||||
- enterprise
|
||||
---
|
||||
|
||||
VictoriaMetrics Cloud helps users to analyze time series data and troubleshoot
|
||||
queries through the built-in `Explore` utility, powered by [VMUI](https://docs.victoriametrics.com/victoriametrics/single-server-victoriametrics/#vmui).
|
||||
This functionality is directly accessible in the two following ways:
|
||||
1. Explore page at [console.victoriametrics.cloud/explore](https://console.victoriametrics.cloud/explore),
|
||||
1. Per deployment, via a dedicated URL pattern: `console.victoriametrics.cloud/deployment/<DEPLOYMENT_ID>/explore`
|
||||
|
||||
## What is VMUI?
|
||||
|
||||
Full VMUI documentation may be found [here](https://docs.victoriametrics.com/victoriametrics/single-server-victoriametrics/#vmui),
|
||||
which is maintained and updated alongside product releases.
|
||||
|
||||
[VMUI](https://docs.victoriametrics.com/victoriametrics/single-server-victoriametrics/#vmui) is the
|
||||
native user interface for VictoriaMetrics, designed to help users explore, troubleshoot, and optimize
|
||||
their queries and metrics. In VictoriaMetrics Cloud, this UI is integrated into the **Explore** view,
|
||||
offering an accessible toolset to [get instant value from data](https://docs.victoriametrics.com/victoriametrics-cloud/get-started/features/#get-instant-value-from-your-data).
|
||||
|
||||
### Playground
|
||||
The best way to understand VMUI is by directly interacting with it. If you are curious, the available
|
||||
[playground](https://play.victoriametrics.com/) allows you to check a real example of a VictoriaMetrics
|
||||
Cluster installation. It is available for testing the query engine, relabeling debugger, other tools
|
||||
and pages provided by VMUI.
|
||||
|
||||
### Visual Query Exploration
|
||||
|
||||
The `Query` utility in the Explore page allows you to easily:
|
||||
* Visualize your own data in graphs, table or json formats
|
||||
* Combine several queries at the same time
|
||||
* Prettify your queries to improve readability
|
||||
* Autocomplete to help you writing queries
|
||||
* Trace your queries to understand behavior
|
||||
|
||||
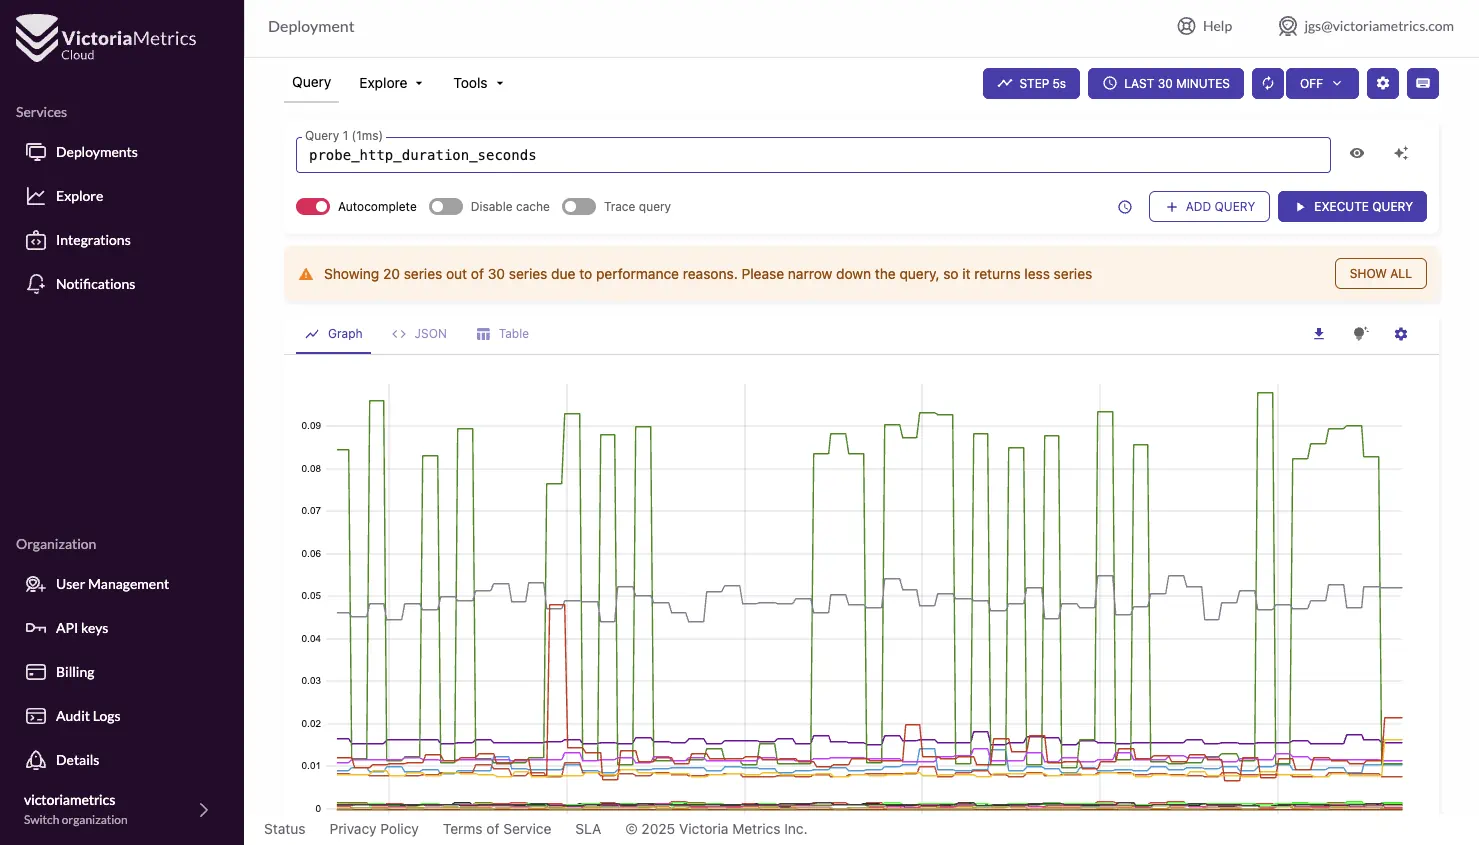
|
||||
<figcaption style="text-align: center; font-style: italic;">Visual Query Exploration in VictoriaMetrics Cloud</figcaption>
|
||||
|
||||
### Exploring metrics
|
||||
|
||||
VMUI provides built-in tools to analyze the structure and volume of your metrics data:
|
||||
|
||||
- **Explore Prometheus Metrics** helps you browse available metrics by job and instance, allowing to build simple charts by just selecting metric names.
|
||||
- **Explore Cardinality** offers insight into the complexity of your time series data, including label dimensions, high-cardinality metrics, and label usage statistics. This is especially useful for optimizing storage and query performance.
|
||||
- **Top Queries** By tracking the last 20,000 queries with durations of at least 1ms, it shows the most frequently executed queries, those with the highest average execution time, and those with the longest cumulative execution time.
|
||||
- **Active Queries** lists currently running queries along with execution duration, time range, and the client that initiated them.
|
||||
|
||||
> [!IMPORTANT] These tools can help you to understand your observability footprint
|
||||
> For example, preventing issues related to excessive cardinality, or debugging performance bottlenecks to identify inefficient queries in real time.
|
||||
|
||||
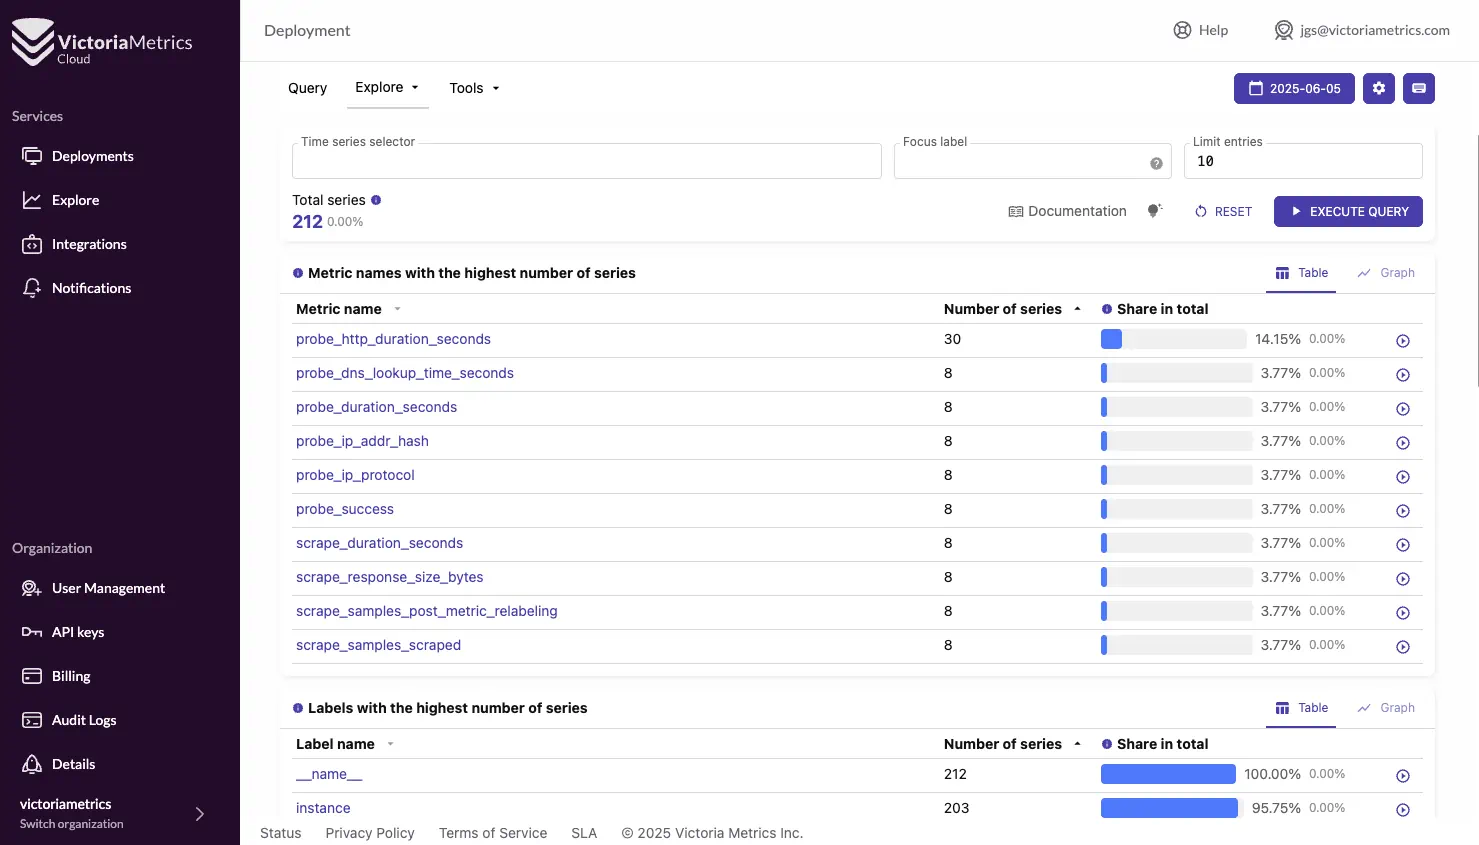
|
||||
<figcaption style="text-align: center; font-style: italic;">Metrics and Cardinality Explorer</figcaption>
|
||||
|
||||
### Debugging and Analysis Utilities
|
||||
|
||||
VMUI offers the following utilities for in-depth debugging:
|
||||
|
||||
- **Raw Query** lets you inspect raw time series samples, aiding in the diagnosis of unexpected results.
|
||||
- **Query and Trace Analyzers** allow you to export and later re-load queries and execution traces for offline inspection.
|
||||
- Tools like the **WITH expressions playground**, **metric relabel debugger**, **downsampling debugger**, and **retention filters debugger** help validate complex configuration logic and query constructs interactively.
|
||||
|
||||
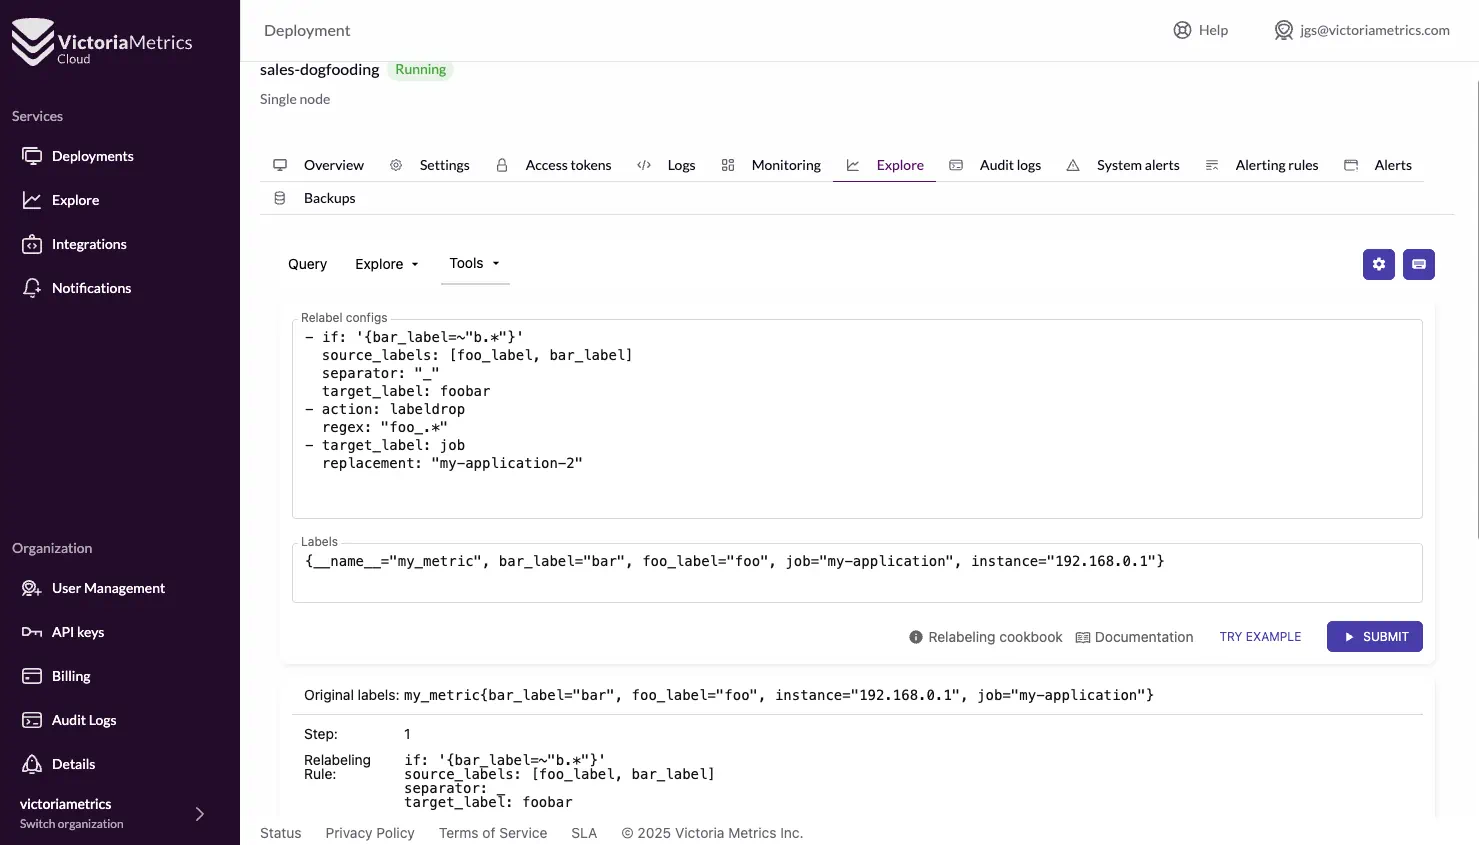
|
||||
<figcaption style="text-align: center; font-style: italic;">Explore tools: Relabel configs</figcaption>
|
||||
|
||||
> [!TIP] Stay up to date!
|
||||
> For the full and always-up-to-date list of features, please refer to the [official VMUI documentation](https://docs.victoriametrics.com/victoriametrics/single-server-victoriametrics/#vmui).
|
||||
|
||||
|
||||
## MetricsQL
|
||||
In addition, VictoriaMetrics Cloud supports advanced querying through [MetricsQL](https://docs.victoriametrics.com/victoriametrics/metricsql/),
|
||||
a powerful PromQL-compatible language that offers enhancements tailored for high-performance
|
||||
environments. MetricsQL is fully supported in the Explore UI and can also be used in
|
||||
[Grafana dashboards](https://docs.victoriametrics.com/grafana/#step-3-configure-the-data-source)
|
||||
for long-term observability workflows.
|
||||
|
||||
### What is MetricsQL?
|
||||
|
||||
[MetricsQL](https://docs.victoriametrics.com/victoriametrics/metricsql/) is VictoriaMetrics' powerful query language, designed as a high-performance, backwards-compatible extension of PromQL (Prometheus Query Language). It retains full compatibility with PromQL syntax while introducing enhancements that make it better suited for large-scale environments and advanced analytics.
|
||||
|
||||
### Using MetricsQL in VictoriaMetrics Cloud
|
||||
|
||||
MetricsQL is natively supported in the **Explore** section of VictoriaMetrics Cloud, where you can write, run, and visualize queries in real time. The interface includes autocomplete for MetricsQL syntax, functions, and label selectors—streamlining query creation and reducing the chance of errors.
|
||||
|
||||
You can also use MetricsQL in [Grafana](https://docs.victoriametrics.com/grafana/#step-3-configure-the-data-source)
|
||||
dashboards by configuring the [VictoriaMetrics data source](https://grafana.com/grafana/plugins/victoriametrics-metrics-datasource/),
|
||||
enabling consistent query logic across operational and visualization layers.
|
||||
|
||||
For deeper usage examples and advanced query patterns, please refer to the [official MetricsQL documentation](https://docs.victoriametrics.com/victoriametrics/metricsql/).
|
||||
|
||||
### Key Functionality in MetricsQL
|
||||
|
||||
MetricsQL extends PromQL with several unique capabilities:
|
||||
|
||||
- **`WITH` expressions**: Define temporary named subqueries to improve readability and reuse logic across queries.
|
||||
- **Performance-tuned functions**: Functions like `avg_over_time`, `count_over_time`, and others are optimized for efficient computation over long durations.
|
||||
- **Flexible filtering**: Enhanced match operators (`=~`, `!~`, `=`, `!=`) and aggregation logic make it easier to craft precise queries.
|
||||
- **Downsampling and rate smoothing**: Built-in functions help reduce noise and CPU cost for long-range queries.
|
||||
|
||||
For a full list of functions and capabilities, see the [MetricsQL reference](https://docs.victoriametrics.com/victoriametrics/metricsql/).
|
||||
|
||||
### Why Use MetricsQL?
|
||||
|
||||
MetricsQL addresses many real-world limitations found in PromQL when working with high-cardinality
|
||||
time series data, large datasets, or complex calculations. It introduces performance optimizations
|
||||
and new functions that enable more flexible, efficient, and maintainable queries. Users benefit from:
|
||||
|
||||
- **Better performance** on large-scale queries
|
||||
- **Enhanced expressiveness** with additional functions and operators
|
||||
- **Improved readability** through support for `WITH` expressions (query macros)
|
||||
- **Lower cost** by optimizing query execution paths
|
||||
@@ -150,7 +150,7 @@ Additional configuration options may be found under `Advanced Settings` where t
|
||||
|
||||
## Adding a payment method
|
||||
|
||||
VictoriaMetrics Cloud supports different payment options. You can found more information under the [Billing](/victoriametrics-cloud/billing/) section.
|
||||
VictoriaMetrics Cloud supports different payment options. You can found more information under the [Billing](https://docs.victoriametrics.com/victoriametrics-cloud/billing/) section.
|
||||
|
||||
To add your payment method, navigate to the VictoriaMetrics Cloud [Billing](https://console.victoriametrics.cloud/billing?utm_source=website&utm_campaign=docs_quickstart)
|
||||
page, and go to the `Payment methods` tab. There, you'll be able to add a payment method by:
|
||||
|
||||
@@ -53,35 +53,42 @@ to categorize GitHub issues. We have the following labels:
|
||||
Once a release is made, maintainers go through all labeled issues, leave a comment about the new release, remove the label, and close the issue.
|
||||
1. `vmui`, assigned to issues related to https://docs.victoriametrics.com/victoriametrics/single-server-victoriametrics/#vmui or https://docs.victoriametrics.com/victorialogs/querying/#web-ui
|
||||
|
||||
## Pull request checklist
|
||||
## Pull Request checklist
|
||||
|
||||
Implementing a bugfix or enhancement requires sending a pull request to the [corresponding repository](https://github.com/orgs/VictoriaMetrics/repositories).
|
||||
|
||||
A pull request should contain the following attributes:
|
||||
1. Don't use `master` branch for making PRs, as it makes it impossible for reviewers to modify the change.
|
||||
Pull requests requirements are the following:
|
||||
1. Don't use `master` branch for making PRs, as it makes it impossible for reviewers to modify the changes.
|
||||
1. All commits need to be [signed](https://docs.github.com/en/authentication/managing-commit-signature-verification/signing-commits).
|
||||
1. A clear and concise description of what was done and for what purpose. Use the imperative, present tense: "change" not "changed" nor "changes".
|
||||
Read your commit message as "This commit will ..", don't capitalize the first letter
|
||||
1. A link to the issue related to this change, if any.
|
||||
1. A commit message should contain clear and concise description of what was done and for what purpose.
|
||||
Use the imperative, present tense: "change" not "changed" nor "changes". Read your commit message as "This commit will ..", don't capitalize the first letter.
|
||||
Message should be prefixed with `<dir>/<component>:` to show what component has been changed, i.e. `app/vmalert: fix...`.
|
||||
1. A link to the issue(s) related to the change, if any. Use `Fixes [issue link]` if the PR resolves the issue, or `Related to [issue link]` for reference.
|
||||
1. Tests proving that the change is effective. See [this style guide](https://itnext.io/f-tests-as-a-replacement-for-table-driven-tests-in-go-8814a8b19e9e) for tests.
|
||||
To run tests and code checks locally execute commands `make tests-full` and `make check-all`.
|
||||
To run tests and code checks locally execute commands `make test-full` and `make check-all`.
|
||||
1. Try to not extend the scope of the pull requests outside the issue, do not make unrelated changes.
|
||||
1. Documentation update, if needed. For example, adding a new flag or changing behavior of existing flags or features
|
||||
1. Update [docs](https://github.com/VictoriaMetrics/VictoriaMetrics/tree/master/docs), if needed. For example, adding a new flag or changing behavior of existing flags or features
|
||||
requires reflecting these changes in the documentation. For new features add `{{%/* available_from "#" */%}}` shortcode
|
||||
to the documentation. It will be later automatically replaced with an actual release version.
|
||||
1. A line in the [changelog](https://docs.victoriametrics.com/victoriametrics/changelog/#tip) mentioning the change and related issue in a way
|
||||
that would be clear to other readers even if they don't have the full context. Use the same guidelines as for commit message.
|
||||
that would be clear to other readers even if they don't have the full context.
|
||||
1. Reviewers who you think have the best expertise on the matter.
|
||||
|
||||
See good example of pull request [here](https://github.com/VictoriaMetrics/VictoriaMetrics/pull/6487).
|
||||
|
||||
To merge the PR it should be approved by at least one reviewer, all CI checks should be green.
|
||||
## Merging Pull Request
|
||||
|
||||
Once the PR is merged, check if related issues are still opened (GitHub may close it on PR merge).
|
||||
The issue should be closed only when the change gets included into an actual release.
|
||||
|
||||
Label `waiting for release` is added to issues related to the merged PR. It makes easier for the person who makes the release
|
||||
to track the related tickets and update them once release is published.
|
||||
The person who merges the Pull Request is responsible for satisfying requirements below:
|
||||
1. Make sure that PR satisfies [Pull Request checklist](https://docs.victoriametrics.com/victoriametrics/contributing/#pull-request-checklist),
|
||||
it is approved by at least one reviewer, all CI checks are green.
|
||||
1. Try doing your best at assessing the changes. If possible, test them locally.
|
||||
1. Once merged, make sure to cherry-pick the changes across all related branches.
|
||||
1. If applicable, cherry-pick the change to [LTS release lines](https://docs.victoriametrics.com/victoriametrics/lts-releases/)
|
||||
and mention in the PR comment what was or wasn't cherry-picked.
|
||||
1. Update related issues with a meaningful message of what has changed and when it will be
|
||||
released. _This helps users to understand the change without reading PR._
|
||||
1. Add label `waiting for release` to related issues.
|
||||
1. Do not close related tickets until release is made. If ticket was auto-closed by GitHub or user - re-open it.
|
||||
|
||||
## KISS principle
|
||||
|
||||
|
||||
@@ -15,37 +15,36 @@ aliases:
|
||||
Below please find public case studies and talks from VictoriaMetrics users. You can also join our [community Slack channel](https://slack.victoriametrics.com/)
|
||||
where you can chat with VictoriaMetrics users to get additional references, reviews and case studies.
|
||||
|
||||
- [Case studies and talks](#case-studies-and-talks)
|
||||
- [AbiosGaming](#abiosgaming)
|
||||
- [adidas](#adidas)
|
||||
- [Adsterra](#adsterra)
|
||||
- [ARNES](#arnes)
|
||||
- [Brandwatch](#brandwatch)
|
||||
- [CERN](#cern)
|
||||
- [COLOPL](#colopl)
|
||||
- [Criteo](#criteo)
|
||||
- [Dig Security](#dig-security)
|
||||
- [Fly.io](#flyio)
|
||||
- [German Research Center for Artificial Intelligence](#german-research-center-for-artificial-intelligence)
|
||||
- [Grammarly](#grammarly)
|
||||
- [Groove X](#groove-x)
|
||||
- [Idealo.de](#idealode)
|
||||
- [MHI Vestas Offshore Wind](#mhi-vestas-offshore-wind)
|
||||
- [Naver](#naver)
|
||||
- [NetEase Cloud Music](#netease-cloud-music)
|
||||
- [Percona](#percona)
|
||||
- [Razorpay](#razorpay)
|
||||
- [RELEX Solutions](#relex-solutions)
|
||||
- [Roblox](#roblox)
|
||||
- [Sensedia](#sensedia)
|
||||
- [Smarkets](#smarkets)
|
||||
- [Synthesio](#synthesio)
|
||||
- [Wedos.com](#wedoscom)
|
||||
- [Wix.com](#wixcom)
|
||||
- [Xiaohongshu](#xiaohongshu)
|
||||
- [Zerodha](#zerodha)
|
||||
- [zhihu](#zhihu)
|
||||
- [Zomato](#zomato)
|
||||
|
||||
You can also read [articles about VictoriaMetrics from our users](https://docs.victoriametrics.com/victoriametrics/articles/#third-party-articles-and-slides-about-victoriametrics).
|
||||
|
||||
|
||||
@@ -537,8 +537,7 @@ By default, the following TCP ports are used:
|
||||
|
||||
It is recommended setting up [vmagent](https://docs.victoriametrics.com/victoriametrics/vmagent/)
|
||||
or Prometheus to scrape `/metrics` pages from all the cluster components, so they can be monitored and analyzed
|
||||
with [the official Grafana dashboard for VictoriaMetrics cluster](https://grafana.com/grafana/dashboards/11176)
|
||||
or [an alternative dashboard for VictoriaMetrics cluster](https://grafana.com/grafana/dashboards/11831).
|
||||
with [the official Grafana dashboard for VictoriaMetrics cluster](https://grafana.com/grafana/dashboards/11176).
|
||||
Graphs on these dashboards contain useful hints - hover the `i` icon at the top left corner of each graph in order to read it.
|
||||
|
||||
If you use Google Cloud Managed Prometheus for scraping metrics from VictoriaMetrics components, then pass `-metrics.exposeMetadata`
|
||||
@@ -1691,7 +1690,7 @@ Below is the output for `/path/to/vmselect -help`:
|
||||
-search.skipSlowReplicas
|
||||
Whether to skip -replicationFactor - 1 slowest vmstorage nodes during querying. Enabling this setting may improve query speed, but it could also lead to incomplete results if some queried data has less than -replicationFactor copies at vmstorage nodes. Consider enabling this setting only if all the queried data contains -replicationFactor copies in the cluster
|
||||
-search.tenantCacheExpireDuration duration
|
||||
The expiry duration for list of tenants for multi-tenant queries. (default 5m0s)
|
||||
Expiry duration for caching tenants in memory. A zero value disables caching, causing tenants to be fetched from storage nodes on every query. (default 5m0s)
|
||||
-search.treatDotsAsIsInRegexps
|
||||
Whether to treat dots as is in regexp label filters used in queries. For example, foo{bar=~"a.b.c"} will be automatically converted to foo{bar=~"a\\.b\\.c"}, i.e. all the dots in regexp filters will be automatically escaped in order to match only dot char instead of matching any char. Dots in ".+", ".*" and ".{n}" regexps aren't escaped. This option is DEPRECATED in favor of {__graphite__="a.*.c"} syntax for selecting metrics matching the given Graphite metrics filter
|
||||
-selectNode array
|
||||
|
||||
@@ -15,7 +15,7 @@ aliases:
|
||||
---
|
||||
## What is the main purpose of VictoriaMetrics?
|
||||
|
||||
To provide the best monitoring solution.
|
||||
To provide the best observability solution.
|
||||
|
||||
## Who uses VictoriaMetrics?
|
||||
|
||||
@@ -43,7 +43,7 @@ Yes. See [these docs](https://docs.victoriametrics.com/victoriametrics/cluster-v
|
||||
|
||||
## Can I use VictoriaMetrics instead of Prometheus?
|
||||
|
||||
Yes in most cases. VictoriaMetrics can substitute Prometheus in the following aspects:
|
||||
Yes, in most cases. VictoriaMetrics can substitute Prometheus in the following aspects:
|
||||
|
||||
* Prometheus-compatible service discovery and target scraping can be done with [vmagent](https://docs.victoriametrics.com/victoriametrics/vmagent/) and with single-node VictoriaMetrics. See [these docs](https://docs.victoriametrics.com/victoriametrics/single-server-victoriametrics/#how-to-scrape-prometheus-exporters-such-as-node-exporter).
|
||||
* Prometheus-compatible alerting rules and recording rules can be processed with [vmalert](https://docs.victoriametrics.com/victoriametrics/vmalert/).
|
||||
@@ -51,8 +51,8 @@ Yes in most cases. VictoriaMetrics can substitute Prometheus in the following as
|
||||
|
||||
## What is the difference between vmagent and Prometheus?
|
||||
|
||||
While both [vmagent](https://docs.victoriametrics.com/victoriametrics/vmagent/) and Prometheus may scrape Prometheus targets (aka `/metrics` pages)
|
||||
according to the provided Prometheus-compatible [scrape configs](https://docs.victoriametrics.com/victoriametrics/sd_configs/#scrape_configs)
|
||||
While both [vmagent](https://docs.victoriametrics.com/victoriametrics/vmagent/) and Prometheus may scrape Prometheus targets (aka `/metrics` pages),
|
||||
read Prometheus-compatible [scrape configs](https://docs.victoriametrics.com/victoriametrics/sd_configs/#scrape_configs)
|
||||
and send data to multiple remote storage systems, vmagent has the following additional features:
|
||||
|
||||
* vmagent usually requires lower amounts of CPU, RAM and disk IO compared to Prometheus when scraping an enormous number of targets (more than 1000)
|
||||
@@ -73,22 +73,22 @@ and send data to multiple remote storage systems, vmagent has the following addi
|
||||
* [Relabeling and filtering](https://docs.victoriametrics.com/victoriametrics/vmagent/#relabeling-and-filtering)
|
||||
* [Splitting data streams among multiple systems](https://docs.victoriametrics.com/victoriametrics/vmagent/#splitting-data-streams-among-multiple-systems)
|
||||
* [Prometheus remote_write proxy](https://docs.victoriametrics.com/victoriametrics/vmagent/#prometheus-remote_write-proxy)
|
||||
* [remote_write for clustered version](https://docs.victoriametrics.com/victoriametrics/vmagent/#remote_write-for-clustered-version)
|
||||
* [Remote_write for clustered version](https://docs.victoriametrics.com/victoriametrics/vmagent/#remote_write-for-clustered-version)
|
||||
|
||||
## What is the difference between vmagent and Prometheus agent?
|
||||
|
||||
Both [vmagent](https://docs.victoriametrics.com/victoriametrics/vmagent/) and [Prometheus agent](https://prometheus.io/blog/2021/11/16/agent/) serve the same purpose – to efficiently scrape Prometheus-compatible targets at the edge. They have the following differences:
|
||||
|
||||
* vmagent usually requires lower amounts of CPU, RAM and disk IO compared to the Prometheus agent.
|
||||
* vmagent supports both pull and push data collection – it can accept data via many popular data ingestion protocols such as InfluxDB line protocol, Graphite protocol, OpenTSDB protocol, DataDog protocol, Prometheus protocol, OpenTelemetry metrics protocol, CSV and JSON – see [these docs](https://docs.victoriametrics.com/victoriametrics/vmagent/#features).
|
||||
* vmagent supports both `pull` and `push` data collection – it can accept data via many popular data ingestion protocols such as InfluxDB line protocol, Graphite protocol, OpenTSDB protocol, DataDog protocol, Prometheus protocol, OpenTelemetry metrics protocol, CSV and JSON – see [these docs](https://docs.victoriametrics.com/victoriametrics/vmagent/#features).
|
||||
* vmagent doesn't have limitations on backfilling of historical data.
|
||||
* vmagent can easily scale horizontally to multiple instances for scraping a big number of targets – see [these docs](https://docs.victoriametrics.com/victoriametrics/vmagent/#scraping-big-number-of-targets).
|
||||
* vmagent supports [improved relabeling](https://docs.victoriametrics.com/victoriametrics/relabeling/).
|
||||
* vmagent can limit the number of scraped metrics per target – see [these docs](https://docs.victoriametrics.com/victoriametrics/vmagent/#cardinality-limiter).
|
||||
* vmagent supports loading scrape configs from multiple files – see [these docs](https://docs.victoriametrics.com/victoriametrics/vmagent/#loading-scrape-configs-from-multiple-files).
|
||||
* vmagent supports data reading and data writing from/to Kafka – see [these docs](https://docs.victoriametrics.com/victoriametrics/vmagent/#kafka-integration).
|
||||
* vmagent can read and update scrape configs from http and https URLs, while the Prometheus agent can read them only from the local file system.
|
||||
* vmagent supports [stream aggregation](https://docs.victoriametrics.com/victoriametrics/stream-aggregation/) feature for performing aggregates on collected or received samples before sending them to remote storage.
|
||||
* vmagent can read and update scrape configs from http and https URLs, while the Prometheus agent can only read them from the local file system.
|
||||
* vmagent supports [stream aggregation](https://docs.victoriametrics.com/victoriametrics/stream-aggregation/) for performing aggregates on collected or received samples before sending them to remote storage.
|
||||
|
||||
## Is it safe to enable [remote write](https://prometheus.io/docs/operating/integrations/#remote-endpoints-and-storage) in Prometheus?
|
||||
|
||||
@@ -103,11 +103,11 @@ and writing data to VictoriaMetrics.
|
||||
* VictoriaMetrics is easier to configure and operate than competing solutions.
|
||||
* VictoriaMetrics is more cost-efficient, since it requires less RAM, disk space, disk IO and network IO than competing solutions.
|
||||
* VictoriaMetrics performs typical queries faster than competing solutions.
|
||||
* VictoriaMetrics has a simpler architecture, which translates into fewer bugs and more useful features compared to competing TSDBs.
|
||||
* VictoriaMetrics has a simpler architecture, which translates into fewer bugs and more useful features compared to competing time series databases.
|
||||
|
||||
See the following articles and talks for details:
|
||||
The following articles and talks provide additional details:
|
||||
|
||||
* [comparing Thanos to VictoriaMetrics cluster](https://medium.com/@valyala/comparing-thanos-to-victoriametrics-cluster-b193bea1683)
|
||||
* [Comparing Thanos to VictoriaMetrics cluster](https://medium.com/@valyala/comparing-thanos-to-victoriametrics-cluster-b193bea1683)
|
||||
* [Remote Write Storage Wars](https://promcon.io/2019-munich/talks/remote-write-storage-wars/) talk
|
||||
from [PromCon 2019](https://promcon.io/2019-munich/talks/remote-write-storage-wars/)
|
||||
* [Grafana Mimir and VictoriaMetrics: performance tests](https://victoriametrics.com/blog/mimir-benchmark/)
|
||||
@@ -117,12 +117,12 @@ VictoriaMetrics also [uses less RAM than Thanos components](https://github.com/t
|
||||
|
||||
## What is the difference between VictoriaMetrics and [QuestDB](https://questdb.io/)?
|
||||
|
||||
* QuestDB needs more than 20x storage space than VictoriaMetrics. This translates to higher storage costs and slower queries over historical data, which must be read from the disk.
|
||||
* QuestDB is much harder to set up and operate than VictoriaMetrics. Compare [setup instructions for QuestDB](https://questdb.io/docs/get-started/binaries) to [setup instructions for VictoriaMetrics](https://docs.victoriametrics.com/victoriametrics/single-server-victoriametrics/#how-to-start-victoriametrics).
|
||||
* QuestDB needs 20x more storage space than VictoriaMetrics. This translates to higher storage costs and slower queries over historical data, which must be read from the disk.
|
||||
* QuestDB is significantly more difficult to set up and operate than VictoriaMetrics. Compare [setup instructions for QuestDB](https://questdb.io/docs/get-started/binaries) to [setup instructions for VictoriaMetrics](https://docs.victoriametrics.com/victoriametrics/single-server-victoriametrics/#how-to-start-victoriametrics).
|
||||
* VictoriaMetrics provides the [MetricsQL](https://docs.victoriametrics.com/victoriametrics/metricsql/) query language, which is better suited for typical queries over time series data than the SQL-like query language provided by QuestDB. See [this article](https://valyala.medium.com/promql-tutorial-for-beginners-9ab455142085) for details.
|
||||
* VictoriaMetrics can be queried via the [Prometheus querying API](https://docs.victoriametrics.com/victoriametrics/single-server-victoriametrics/#prometheus-querying-api-usage) and via [Graphite's API](https://docs.victoriametrics.com/victoriametrics/integrations/graphite/#graphite-api-usage).
|
||||
* Thanks to PromQL support, VictoriaMetrics [can be used as a drop-in replacement for Prometheus in Grafana](https://docs.victoriametrics.com/victoriametrics/integrations/grafana/), while QuestDB needs a full rewrite of existing dashboards in Grafana.
|
||||
* Thanks to Prometheus' remote_write API support, VictoriaMetrics can be used as a long-term storage for Prometheus or for [vmagent](https://docs.victoriametrics.com/victoriametrics/vmagent/), while QuestDB has no integration with Prometheus.
|
||||
* Thanks to Prometheus' remote_write API support, VictoriaMetrics can be used as long-term storage for Prometheus or [vmagent](https://docs.victoriametrics.com/victoriametrics/vmagent/), while QuestDB does not integrate with Prometheus.
|
||||
* QuestDB [supports a smaller range of popular data ingestion protocols](https://questdb.io/docs/develop/insert-data) compared to VictoriaMetrics (compare to [the list of supported data ingestion protocols for VictoriaMetrics](https://docs.victoriametrics.com/victoriametrics/single-server-victoriametrics/#how-to-import-time-series-data)).
|
||||
* [VictoriaMetrics supports backfilling (e.g. storing historical data) out of the box](https://docs.victoriametrics.com/victoriametrics/single-server-victoriametrics/#backfilling), while QuestDB provides [very limited support for backfilling](https://questdb.io/blog/2021/05/10/questdb-release-6-0-tsbs-benchmark#the-problem-with-out-of-order-data).
|
||||
|
||||
@@ -138,12 +138,12 @@ See also [Grafana Mimir vs VictoriaMetrics benchmark](https://victoriametrics.co
|
||||
VictoriaMetrics is similar to Cortex in the following aspects:
|
||||
|
||||
* Both systems accept data from [vmagent](https://docs.victoriametrics.com/victoriametrics/vmagent/) or Prometheus
|
||||
via the standard [remote_write API](https://prometheus.io/docs/practices/remote_write/), so there is no need for running sidecars
|
||||
via the standard [remote_write API](https://prometheus.io/docs/practices/remote_write/), so there is no need to run sidecars,
|
||||
unlike in [Thanos](https://github.com/thanos-io/thanos)' case.
|
||||
* Both systems support multi-tenancy out of the box. See [the corresponding docs for VictoriaMetrics](https://docs.victoriametrics.com/victoriametrics/cluster-victoriametrics/#multitenancy).
|
||||
* Both systems support data replication. See [replication in Cortex](https://github.com/cortexproject/cortex/blob/fe56f1420099aa1bf1ce09316c186e05bddee879/docs/architecture.md#hashing) and [replication in VictoriaMetrics](https://docs.victoriametrics.com/victoriametrics/cluster-victoriametrics/#replication-and-data-safety).
|
||||
* Both systems scale horizontally to multiple nodes. See [these docs](https://docs.victoriametrics.com/victoriametrics/cluster-victoriametrics/#cluster-resizing-and-scalability) for details.
|
||||
* Both systems support alerting and recording rules via the corresponding tools such as [vmalert](https://docs.victoriametrics.com/victoriametrics/vmalert/).
|
||||
* Both systems support alerting and recording rules via corresponding tools such as [vmalert](https://docs.victoriametrics.com/victoriametrics/vmalert/).
|
||||
* Both systems can be queried via the [Prometheus querying API](https://prometheus.io/docs/prometheus/latest/querying/api/) and integrate perfectly with Grafana.
|
||||
|
||||
The main differences between Cortex and VictoriaMetrics:
|
||||
@@ -159,7 +159,7 @@ The main differences between Cortex and VictoriaMetrics:
|
||||
VictoriaMetrics may lose only a few seconds of recent data, which isn't synced to persistent storage yet.
|
||||
See [this article for details](https://medium.com/@valyala/wal-usage-looks-broken-in-modern-time-series-databases-b62a627ab704).
|
||||
* Cortex is usually slower and requires more CPU and RAM than VictoriaMetrics. See [this talk from adidas at PromCon 2019](https://promcon.io/2019-munich/talks/remote-write-storage-wars/) and [other case studies](https://docs.victoriametrics.com/victoriametrics/casestudies/).
|
||||
* VictoriaMetrics accepts data in multiple popular data ingestion protocols additionally to Prometheus remote_write protocol – InfluxDB, OpenTSDB, Graphite, CSV, JSON, native binary.
|
||||
* VictoriaMetrics accepts data in multiple popular data ingestion protocols in addition to Prometheus remote_write protocol – InfluxDB, OpenTSDB, Graphite, CSV, JSON, native binary.
|
||||
See [these docs](https://docs.victoriametrics.com/victoriametrics/single-server-victoriametrics/#how-to-import-time-series-data) for details.
|
||||
* VictoriaMetrics provides the [MetricsQL](https://docs.victoriametrics.com/victoriametrics/metricsql/) query language, while Cortex provides the [PromQL](https://prometheus.io/docs/prometheus/latest/querying/basics/) query language.
|
||||
* VictoriaMetrics can be queried via [Graphite's API](https://docs.victoriametrics.com/victoriametrics/integrations/graphite/#graphite-api-usage).
|
||||
|
||||
@@ -1768,8 +1768,6 @@ _Please note, never use loadbalancer address for scraping metrics. All the monit
|
||||
|
||||
Official Grafana dashboards available for [single-node](https://grafana.com/grafana/dashboards/10229)
|
||||
and [clustered](https://grafana.com/grafana/dashboards/11176) VictoriaMetrics.
|
||||
See an [alternative dashboard for clustered VictoriaMetrics](https://grafana.com/grafana/dashboards/11831)
|
||||
created by community.
|
||||
|
||||
Graphs on the dashboards contain useful hints - hover the `i` icon in the top left corner of each graph to read it.
|
||||
|
||||
@@ -1814,6 +1812,11 @@ During querying, VictoriaMetrics tracks how many times the requested metric name
|
||||
when was the last time it happened. In this way, it is possible to identify metric names that were never queried.
|
||||
Or if metric was queried occasionally - when the last time it happened.
|
||||
|
||||
The usage stats for a metric won't update in these two cases:
|
||||
* Querying a metric with non-matching filters. For example, querying for `vm_log_messages_total{level!="info"}` won't update usage stats
|
||||
for `vm_log_messages_total` if there is no `{level!="info"}` series yet.
|
||||
* The query response is fully cached in the [rollup result cache](https://docs.victoriametrics.com/#rollup-result-cache).
|
||||
|
||||
To get metric names usage statistics, use the `/prometheus/api/v1/status/metric_names_stats` API endpoint for
|
||||
a single-node VictoriaMetrics (or at `http://<vmselect>:8481/select/<accountID>/prometheus/api/v1/status/metric_names_stats` in [cluster version of VictoriaMetrics](https://docs.victoriametrics.com/victoriametrics/cluster-victoriametrics/)).
|
||||
It accepts the following query parameters:
|
||||
@@ -1850,9 +1853,7 @@ The API endpoint returns the following `JSON` response:
|
||||
* `records`:
|
||||
* `metricName` a metric name;
|
||||
* `queryRequests` a cumulative counter of times the metric was fetched. If metric name `foo` has 10 time series,
|
||||
then one read query `foo` will increment counter by 10. Querying a metric with non-matching filters doesn't increase
|
||||
the counter for this particular metric name. For example, querying for `vm_log_messages_total{level!="info"}` won't
|
||||
increment usage counter for `vm_log_messages_total` if there are no `{level="error"}` or `{level="warning"}` series yet.
|
||||
then one read query `foo` will increment counter by 10.
|
||||
* `lastRequestTimestamp` a timestamp when last time this statistic was updated.
|
||||
|
||||
_VictoriaMetrics tracks metric names query statistics for `/api/v1/query`, `/api/v1/query_range`, `/render`, `/federate` and `/api/v1/export` API calls._
|
||||
|
||||
@@ -116,6 +116,9 @@ Bumping the limits may significantly improve build speed.
|
||||
**Important note:** do not push enterprise tags to public GitHub repository - they must be pushed only to private repository.
|
||||
|
||||
1. Publish release by pressing "Publish release" green button in GitHub's UI.
|
||||
1. Run `TAG=v1.xx.y make publish-latest`. This command publishes the `latest` Docker image tag for the given `TAG`.
|
||||
This command must be run only for the latest officially published release. It must be skipped when publishing other releases such as
|
||||
[LTS releases](https://docs.victoriametrics.com/victoriametrics/lts-releases/) or some test releases.
|
||||
1. Update GitHub tickets related to the new release. Usually, such tickets have label [waiting for release](https://github.com/VictoriaMetrics/VictoriaMetrics/issues?q=is%3Aopen+is%3Aissue+label%3A%22waiting+for+release%22). Close such tickets by mentioning which release they were included into, and remove the label. See example [here](https://github.com/VictoriaMetrics/VictoriaMetrics/issues/6637#issuecomment-2390729511).
|
||||
1. Bump VictoriaMetrics version at `deployment/docker/*.yml`. For example:
|
||||
|
||||
|
||||
@@ -18,11 +18,26 @@ See also [LTS releases](https://docs.victoriametrics.com/victoriametrics/lts-rel
|
||||
|
||||
## tip
|
||||
|
||||
* FEATURE: improve performance on systems with many CPU cores by removing the top sources of [false sharing](https://en.wikipedia.org/wiki/False_sharing) at global variables. See [#8682](https://github.com/VictoriaMetrics/VictoriaMetrics/issues/8682). Thanks to @tIGO for raising this issue and for the initial attempt to fix it at the [PR #8683](https://github.com/VictoriaMetrics/VictoriaMetrics/pull/8683).
|
||||
* FEATURE: [vmgateway](https://docs.victoriametrics.com/victoriametrics/vmgateway/): add an option to use mTLS for connections to `-write.url` and `-read.url`. See [#8841](https://github.com/VictoriaMetrics/VictoriaMetrics/issues/8841).
|
||||
* FEATURE: [vmselect](https://docs.victoriametrics.com/victoriametrics/cluster-victoriametrics/) in [VictoriaMetrics cluster](https://docs.victoriametrics.com/victoriametrics/cluster-victoriametrics/): dynamically adjusts the concurrent dial limit between 8 and 64 based on `-search.maxConcurrentRequests`. Additionally, goroutines now have the opportunity to access available connections while awaiting the dial limit token. This enables faster connection establishment when sudden requests arrive and reduces the blocking time during the availability check for connections. See [#8922](https://github.com/VictoriaMetrics/VictoriaMetrics/pull/8922)
|
||||
* FEATURE: [vmsingle](https://docs.victoriametrics.com/victoriametrics/single-server-victoriametrics/) and [vmselect](https://docs.victoriametrics.com/victoriametrics/cluster-victoriametrics/): improve stale series detection in `increase`, `increase_pure` and `delta` MetricsQL functions when `-search.maxLookback`, `-search.setLookbackToStep` or `-search.maxStalenessInterval` flags are set. See [#8935](https://github.com/VictoriaMetrics/VictoriaMetrics/issues/8935) for details.
|
||||
* FEATURE: [vmbackupmanager](https://docs.victoriametrics.com/vmbackupmanager/): verify backup availability before creating restore mark. This is useful in order to avoid creating restore marks for backups that are not available or incomplete. See [this issue](https://github.com/VictoriaMetrics/VictoriaMetrics/issues/8771).
|
||||
* FEATURE: [vmbackupmanager](https://docs.victoriametrics.com/vmbackupmanager/): add support for user-defined timezone for backup scheduling. It is now possible to use `-backupScheduleTimezone=Europe/Paris` to take backups at midnight in `Europe/Paris` timezone. See [this](https://github.com/VictoriaMetrics/VictoriaMetrics/issues/3950) and [this](https://github.com/VictoriaMetrics/VictoriaMetrics/issues/6707) issues for details.
|
||||
* FEATURE: [vmbackup](https://docs.victoriametrics.com/vmbackup/), [vmbackupmanager](https://docs.victoriametrics.com/vmbackupmanager/): add an ability to set objects metadata (and tags for S3-compatible storage) when uploading backups by using `-objectMetadata` and `-s3ObjectTags` command-line flags. See [#8010](https://github.com/VictoriaMetrics/VictoriaMetrics/issues/8010).
|
||||
* FEATURE: `vmselect` in [VictoriaMetrics cluster](https://docs.victoriametrics.com/cluster-victoriametrics/): allow disabling tenant cache for [multitenant read queries](https://docs.victoriametrics.com/victoriametrics/cluster-victoriametrics/#multitenancy) by using `-search.disableCache` or `-search.tenantCacheExpireDuration=0` command-line flags, or by adding `nocache=1` query parameter. It can be useful for debugging purposes and in cases of frequent tenants creation.
|
||||
|
||||
* BUGFIX: [vmalert-tool](https://docs.victoriametrics.com/victoriametrics/vmalert-tool/): fix access conflicts for the temporary test folder when multiple users run tests on the same host. Thanks to @evkuzin for the [pull request](https://github.com/VictoriaMetrics/VictoriaMetrics/pull/9015).
|
||||
* BUGFIX: [vmsingle](https://docs.victoriametrics.com/victoriametrics/single-server-victoriametrics/) and `vmstorage` in [VictoriaMetrics cluster](https://docs.victoriametrics.com/cluster-victoriametrics/): fixed a regression in downsampling logic introduced in [#7440](https://github.com/VictoriaMetrics/VictoriaMetrics/issues/7440) and released in [v1.106.0](https://github.com/VictoriaMetrics/VictoriaMetrics/releases/tag/v1.106.0), where downsampling rules with filters `filter:offset:interval` could be incorrectly skipped in favor of unfiltered rules `offset:interval`. See [#8969](https://github.com/VictoriaMetrics/VictoriaMetrics/issues/8969).
|
||||
* BUGFIX: [vmsingle](https://docs.victoriametrics.com/victoriametrics/single-server-victoriametrics/) and `vmstorage` in [VictoriaMetrics cluster](https://docs.victoriametrics.com/victoriametrics/cluster-victoriametrics/): properly apply `rententionFilter` on flag value changes. Previously, it ignored any `filter` value changes for historical data. See [#8885](https://github.com/VictoriaMetrics/VictoriaMetrics/issues/8885) for details.
|
||||
* BUGFIX: [vmsingle](https://docs.victoriametrics.com/victoriametrics/single-server-victoriametrics/) and `vmselect` in [VictoriaMetrics cluster](https://docs.victoriametrics.com/cluster-victoriametrics/): prevent panic caused by invalid label name in metric relabeling debugging interface. Error is now properly propagated and displayed in the interface. See [#8661](https://github.com/VictoriaMetrics/VictoriaMetrics/issues/8661).
|
||||
* BUGFIX: [vmsingle](https://docs.victoriametrics.com/victoriametrics/single-server-victoriametrics/) and `vmstorage` in [VictoriaMetrics cluster](https://docs.victoriametrics.com/victoriametrics/cluster-victoriametrics/): schedule a single background merge thread for merging historical data. Before, background merge could use extra resources without providing any benefit. See [#4592](https://github.com/VictoriaMetrics/VictoriaMetrics/issues/4592) issue for details.
|
||||
* BUGFIX: [vmsingle](https://docs.victoriametrics.com/victoriametrics/single-server-victoriametrics/) and `vmstorage` in [VictoriaMetrics cluster](https://docs.victoriametrics.com/victoriametrics/cluster-victoriametrics/): properly load [metric names stats tracker](https://docs.victoriametrics.com/victoriametrics/single-server-victoriametrics/#track-ingested-metrics-usage) state from disk. Now it ignores corrupted `metric_usage_tracker` file content and init tracker with empty state in the same way as other caches loaded. See [9074](https://github.com/VictoriaMetrics/VictoriaMetrics/issues/9074) issue for details.
|
||||
* BUGFIX: `vmselect` in [VictoriaMetrics cluster](https://docs.victoriametrics.com/victoriametrics/cluster-victoriametrics/): fix inconsistent behaviour of tenants cache when using [multi-tenant reads](https://docs.victoriametrics.com/victoriametrics/cluster-victoriametrics/#multitenancy-via-labels). Previously, `vmselect` could use cached list of tenants which covered only part of the requested time range. That would lead to incomplete query results. See [#9042](https://github.com/VictoriaMetrics/VictoriaMetrics/issues/9042).
|
||||
* BUGFIX: `vmselect` in [VictoriaMetrics cluster](https://docs.victoriametrics.com/victoriametrics/cluster-victoriametrics/): remove tenant labels `vm_account_id` and `vm_project_id` from [exported data](https://docs.victoriametrics.com/#how-to-export-time-series) if tenant info was [specified in URL](https://docs.victoriametrics.com/victoriametrics/cluster-victoriametrics/#url-format). These labels will be present only if export is done via [/multitenant/ endpoint](https://docs.victoriametrics.com/victoriametrics/cluster-victoriametrics/#multitenancy-via-labels), as such response could contain series belonging to different tenants. This change also fixes inconsistency in vmctl's [cluster-to-cluster migration mode](https://docs.victoriametrics.com/victoriametrics/vmctl/#cluster-to-cluster-migration-mode) - see [#9016](https://github.com/VictoriaMetrics/VictoriaMetrics/issues/9016) for details. Thank @fxrlv for the bug report.
|
||||
* BUGFIX: [vmgateway](https://docs.victoriametrics.com/victoriametrics/vmgateway/): add missing vmselect `vmui` related routes to the authorized requests routing. See [#9003](https://github.com/VictoriaMetrics/VictoriaMetrics/issues/9003) issue for details.
|
||||
* BUGFIX: [vmctl](https://docs.victoriametrics.com/victoriametrics/vmctl/): enable dual-stack network mode for `vmctl`connections by default. This allows connecting to IPv6 endpoints as it was not possible previously. See [#9116](https://github.com/VictoriaMetrics/VictoriaMetrics/issues/9116).
|
||||
* BUGFIX: [vmalert-tool](https://docs.victoriametrics.com/victoriametrics/vmalert-tool/): fix access conflicts for the temporary test folder when multiple users run tests on the same host. Thanks to @evkuzin for the [PR 9015](https://github.com/VictoriaMetrics/VictoriaMetrics/pull/9015).
|
||||
* BUGFIX: [alerts](https://github.com/VictoriaMetrics/VictoriaMetrics/blob/master/deployment/docker/rules): fix the alerting rule `ScrapePoolHasNoTargets`. Previously, it may cause false positive in [sharding mode](https://docs.victoriametrics.com/victoriametrics/vmagent/#scraping-big-number-of-targets).
|
||||
* BUGFIX: [vmsingle](https://docs.victoriametrics.com/victoriametrics/single-server-victoriametrics/) and `vmstorage` in [VictoriaMetrics cluster](https://docs.victoriametrics.com/cluster-victoriametrics/): fixed a regression in downsampling logic introduced in [#7440](https://github.com/VictoriaMetrics/VictoriaMetrics/issues/7440) and released in [v1.106.0](https://github.com/VictoriaMetrics/VictoriaMetrics/releases/tag/v1.106.0), where downsampling rules with filters `filter:offset:interval` could be incorrectly skipped in favor of unfiltered rules `offset:interval`. See [#8969](https://github.com/VictoriaMetrics/VictoriaMetrics/issues/8969).
|
||||
|
||||
## [v1.118.0](https://github.com/VictoriaMetrics/VictoriaMetrics/releases/tag/v1.118.0)
|
||||
|
||||
@@ -32,6 +47,7 @@ Released at 2025-05-23
|
||||
* FEATURE: [dashboards/single](https://grafana.com/grafana/dashboards/10229), [dashboards/cluster](https://grafana.com/grafana/dashboards/11176): restore panel `Storage full ETA` using calculation logic from [#8955](https://github.com/VictoriaMetrics/VictoriaMetrics/pull/8955). It was previously removed in [#8492](https://github.com/VictoriaMetrics/VictoriaMetrics/pull/8492).
|
||||
* FEATURE: [dashboards](https://github.com/VictoriaMetrics/VictoriaMetrics/tree/master/dashboards) for VictoriaMetrics single, cluster, vmagent and vmalert: add panels for [Pressure Stall Information (PSI)](https://docs.kernel.org/accounting/psi.html) metrics to dashboards. They could help to identify shortage of resources for VictoriaMetrics components.
|
||||
|
||||
|
||||
* BUGFIX: [vmalert](https://docs.victoriametrics.com/victoriametrics/vmalert/): drop duplicate labels when they appear in both the recording rule label spec and the expression result. See [this issue](https://github.com/VictoriaMetrics/VictoriaMetrics/issues/8954) for details.
|
||||
* BUGFIX: [vmsingle](https://docs.victoriametrics.com/victoriametrics/single-server-victoriametrics/) and [vmagent](https://docs.victoriametrics.com/victoriametrics/vmagent/): fix inconsistency with Prometheus in labels discovered by using [Kubernetes service-discovery](https://docs.victoriametrics.com/victoriametrics/sd_configs/#kubernetes_sd_configs) with `role: endpointslice`. See [#8959](https://github.com/VictoriaMetrics/VictoriaMetrics/issues/8959).
|
||||
* BUGFIX: [vmsingle](https://docs.victoriametrics.com/victoriametrics/single-server-victoriametrics/) and `vmselect` in [VictoriaMetrics cluster](https://docs.victoriametrics.com/cluster-victoriametrics/): prevent panic during query execution when query stats tracking is disabled with `-search.queryStats.lastQueriesCount=0`. See [#8973](https://github.com/VictoriaMetrics/VictoriaMetrics/issues/8973).
|
||||
|
||||
@@ -120,7 +120,7 @@ groups:
|
||||
[ - <rule_group> ]
|
||||
```
|
||||
|
||||
> Explore how to integrate `vmalert` with [VictoriaMetrics Anomaly Detection](https://docs.victoriametrics.com/anomaly-detection/) in the following [guide](/anomaly-detection/guides/guide-vmanomaly-vmalert/).
|
||||
> Explore how to integrate `vmalert` with [VictoriaMetrics Anomaly Detection](https://docs.victoriametrics.com/anomaly-detection/) in the following [guide](https://docs.victoriametrics.com/anomaly-detection/guides/guide-vmanomaly-vmalert/).
|
||||
|
||||
> For users of [VictoriaMetrics Cloud](https://console.victoriametrics.cloud/signUp?utm_source=website&utm_campaign=docs_vm_vmalert_config),
|
||||
> many of the configuration steps (including highly available setup of `vmalert` for cluster deployments) are handled automatically.
|
||||
@@ -786,7 +786,7 @@ To run vmalert in `replay` mode:
|
||||
-datasource.url=http://localhost:8428 \ # Prometheus HTTP API compatible datasource
|
||||
-remoteWrite.url=http://localhost:8428 \ # remote write compatible storage to persist results
|
||||
-replay.timeFrom=2021-05-11T07:21:43Z \ # to start replay from
|
||||
-replay.timeTo=2021-05-29T18:40:43Z # to finish replay by, is optional
|
||||
-replay.timeTo=2021-05-29T18:40:43Z # to finish replay by, optional. By default, set to the current time
|
||||
```
|
||||
|
||||
The output of the command will look like the following:
|
||||
@@ -1050,11 +1050,11 @@ It is possible to specify custom TLS Root CA via `-mtlsCAFile` command-line flag
|
||||
See general recommendations regarding security [here](https://docs.victoriametrics.com/victoriametrics/single-server-victoriametrics/#security).
|
||||
|
||||
vmalert [web UI](#web) exposes configuration details such as list of [Groups](#groups), active alerts,
|
||||
[alerts state](#alerts-state), [notifiers](#notifier-configuration-file). Notifier addresses (sanitized) are attached
|
||||
[alerts state](#alerts-state-on-restarts), [notifiers](#notifier-configuration-file). Notifier addresses (sanitized) are attached
|
||||
as labels to metrics `vmalert_alerts_sent_.*` on `http://<vmalert>/metrics` page. Consider limiting user's access
|
||||
to the web UI or `/metrics` page if this information is sensitive.
|
||||
|
||||
[Alerts state](#alerts-state) page or [debug mode](#debug-mode) could emit additional information about configured
|
||||
[Alerts state](#alerts-state-on-restarts) page or [debug mode](#debug-mode) could emit additional information about configured
|
||||
datasource URL, GET params and headers. Sensitive information such as passwords or auth tokens is stripped by default.
|
||||
To disable stripping of such info pass `-datasource.showURL` cmd-line flag to vmalert.
|
||||
|
||||
|
||||
@@ -434,6 +434,8 @@ Run `vmbackup -help` in order to see all the available options:
|
||||
-metricsAuthKey value
|
||||
Auth key for /metrics endpoint. It must be passed via authKey query arg. It overrides -httpAuth.*
|
||||
Flag value can be read from the given file when using -metricsAuthKey=file:///abs/path/to/file or -metricsAuthKey=file://./relative/path/to/file . Flag value can be read from the given http/https url when using -metricsAuthKey=http://host/path or -metricsAuthKey=https://host/path
|
||||
-objectMetadata string
|
||||
Metadata to be set for uploaded objects. Must be set in JSON format: {"param1":"value1",...,"paramN":"valueN"}. Note that it is is not supported for local filesystem destinations.
|
||||
-mtls array
|
||||
Whether to require valid client certificate for https requests to the corresponding -httpListenAddr . This flag works only if -tls flag is set. See also -mtlsCAFile . This flag is available only in Enterprise binaries. See https://docs.victoriametrics.com/victoriametrics/enterprise/
|
||||
Supports array of values separated by comma or specified via multiple flags.
|
||||
@@ -465,6 +467,8 @@ Run `vmbackup -help` in order to see all the available options:
|
||||
Value can contain comma inside single-quoted or double-quoted string, {}, [] and () braces.
|
||||
-s3ForcePathStyle
|
||||
Prefixing endpoint with bucket name when set false, true by default. (default true)
|
||||
-s3ObjectTags string
|
||||
S3 tags to be set for uploaded objects. Must be set in JSON format: {"param1":"value1",...,"paramN":"valueN"}.
|
||||
-s3StorageClass string
|
||||
The Storage Class applied to objects uploaded to AWS S3. Supported values are: GLACIER, DEEP_ARCHIVE, GLACIER_IR, INTELLIGENT_TIERING, ONEZONE_IA, OUTPOSTS, REDUCED_REDUNDANCY, STANDARD, STANDARD_IA.
|
||||
See https://docs.aws.amazon.com/AmazonS3/latest/userguide/storage-class-intro.html
|
||||
|
||||
@@ -53,8 +53,15 @@ The backup manager creates the following directory hierarchy at `-dst`:
|
||||
* `/monthly/` - contains monthly backups. Each backup is named as `YYYY-MM`
|
||||
|
||||
The `vmbackupmanager` takes backups every hour if hourly backups are not disabled; otherwise,
|
||||
it defaults to taking backups every 24 hours. You can control the schedule using the `-backupInterval` flag.
|
||||
For example, if you want to take backups three times per day, set `-backupInterval=8h`.
|
||||
it defaults to taking backups every 24 hours at 00:00 in UTC timezone.
|
||||
You can control the schedule using the `-backupInterval` and `-backupScheduleTimezone` command-line flags.
|
||||
The `-backupScheduleTimezone` flag specifies the timezone to use for scheduling daily, weekly, and monthly backups.
|
||||
Note that overriding `-backupInterval` means daily, weekly, and monthly backups will be taken at specified intervals
|
||||
and not daily at midnight.
|
||||
|
||||
For example:
|
||||
- if you want to take backups three times per day, set `-backupInterval=8h`
|
||||
- if you want to take backups daily at midnight in `Europe/Paris` timezone, set `-backupScheduleTimezone="Europe/Paris"`
|
||||
|
||||
To get the full list of supported flags please run the following command:
|
||||
|
||||
@@ -441,6 +448,8 @@ command-line flags:
|
||||
vmbackupmanager address to perform API requests (default "http://127.0.0.1:8300")
|
||||
-backupInterval duration
|
||||
Interval between backups. If set to 0 interval is set to 1h if hourly backups are enabled and 24h otherwise
|
||||
-backupScheduleTimezone string
|
||||
Timezone to use for scheduling daily, weekly and monthly backups. Example: 'America/New_York', 'Europe/London', 'Asia/Tokyo' (default "UTC")
|
||||
-concurrency int
|
||||
The number of concurrent workers. Higher concurrency may reduce backup duration (default 10)
|
||||
-configFilePath string
|
||||
@@ -559,6 +568,8 @@ command-line flags:
|
||||
-metricsAuthKey value
|
||||
Auth key for /metrics endpoint. It must be passed via authKey query arg. It overrides -httpAuth.*
|
||||
Flag value can be read from the given file when using -metricsAuthKey=file:///abs/path/to/file or -metricsAuthKey=file://./relative/path/to/file . Flag value can be read from the given http/https url when using -metricsAuthKey=http://host/path or -metricsAuthKey=https://host/path
|
||||
-objectMetadata string
|
||||
Metadata to be set for uploaded objects. Must be set in JSON format: {"param1":"value1",...,"paramN":"valueN"}. Note that it is is not supported for local filesystem destinations.
|
||||
-mtls array
|
||||
Whether to require valid client certificate for https requests to the corresponding -httpListenAddr . This flag works only if -tls flag is set. See also -mtlsCAFile . This flag is available only in Enterprise binaries. See https://docs.victoriametrics.com/victoriametrics/enterprise/
|
||||
Supports array of values separated by comma or specified via multiple flags.
|
||||
@@ -586,10 +597,14 @@ command-line flags:
|
||||
Optional URL to push metrics exposed at /metrics page. See https://docs.victoriametrics.com/victoriametrics/single-server-victoriametrics/#push-metrics . By default, metrics exposed at /metrics page aren't pushed to any remote storage
|
||||
Supports an array of values separated by comma or specified via multiple flags.
|
||||
Value can contain comma inside single-quoted or double-quoted string, {}, [] and () braces.
|
||||
-restore.disableSourceBackupValidation
|
||||
Disable validation of source backup presence and completeness when creating a restore mark.
|
||||
-runOnStart
|
||||
Upload backups immediately after start of the service. Otherwise the backup starts on new hour
|
||||
-s3ForcePathStyle
|
||||
Prefixing endpoint with bucket name when set false, true by default. (default true)
|
||||
-s3ObjectTags string
|
||||
S3 tags to be set for uploaded objects. Must be set in JSON format: {"param1":"value1",...,"paramN":"valueN"}.
|
||||
-s3StorageClass string
|
||||
The Storage Class applied to objects uploaded to AWS S3. Supported values are: GLACIER, DEEP_ARCHIVE, GLACIER_IR, INTELLIGENT_TIERING, ONEZONE_IA, OUTPOSTS, REDUCED_REDUNDANCY, STANDARD, STANDARD_IA.
|
||||
See https://docs.aws.amazon.com/AmazonS3/latest/userguide/storage-class-intro.html
|
||||
|
||||
@@ -485,6 +485,16 @@ Below is the list of configuration flags (it can be viewed by running `./vmgatew
|
||||
Value can contain comma inside single-quoted or double-quoted string, {}, [] and () braces.
|
||||
-ratelimit.refreshInterval duration
|
||||
(default 5s)
|
||||
-read.tlsCAFile string
|
||||
Path to TLS CA file to verify the server certificate when connecting to -read.url
|
||||
-read.tlsCertFile string
|
||||
Path to client-side TLS certificate file to use when connecting to -read.url
|
||||
-read.tlsInsecureSkipVerify
|
||||
Whether to skip verification of the server certificate when connecting to -read.url
|
||||
-read.tlsKeyFile string
|
||||
Path to client-side TLS key file to use when connecting to -read.url
|
||||
-read.tlsServerName string
|
||||
TLS server name to use for server certificate verification when connecting to -read.url
|
||||
-read.url string
|
||||
read access url address, example: http://vmselect:8481
|
||||
-remoteRead.disablePathAppend
|
||||
@@ -519,6 +529,16 @@ Below is the list of configuration flags (it can be viewed by running `./vmgatew
|
||||
Value can contain comma inside single-quoted or double-quoted string, {}, [] and () braces.
|
||||
-version
|
||||
Show VictoriaMetrics version
|
||||
-write.tlsCAFile string
|
||||
Path to TLS CA file to verify the server certificate when connecting to -write.url
|
||||
-write.tlsCertFile string
|
||||
Path to client-side TLS certificate file to use when connecting to -write.url
|
||||
-write.tlsInsecureSkipVerify
|
||||
Whether to skip verification of the server certificate when connecting to -write.url
|
||||
-write.tlsKeyFile string
|
||||
Path to client-side TLS key file to use when connecting to -write.url
|
||||
-write.tlsServerName string
|
||||
TLS server name to use for server certificate verification when connecting to -write.url
|
||||
-write.url string
|
||||
write access url address, example: http://vminsert:8480
|
||||
```
|
||||
|
||||
109
go.mod
109
go.mod
@@ -28,18 +28,18 @@ replace (
|
||||
)
|
||||
|
||||
require (
|
||||
cloud.google.com/go/storage v1.52.0
|
||||
cloud.google.com/go/storage v1.55.0
|
||||
github.com/Azure/azure-sdk-for-go/sdk/azcore v1.18.0
|
||||
github.com/Azure/azure-sdk-for-go/sdk/azidentity v1.9.0
|
||||
github.com/Azure/azure-sdk-for-go/sdk/azidentity v1.10.0
|
||||
github.com/Azure/azure-sdk-for-go/sdk/storage/azblob v1.6.1
|
||||
github.com/VictoriaMetrics/easyproto v0.1.4
|
||||
github.com/VictoriaMetrics/fastcache v1.12.2
|
||||
github.com/VictoriaMetrics/metrics v1.36.0
|
||||
github.com/VictoriaMetrics/fastcache v1.12.5
|
||||
github.com/VictoriaMetrics/metrics v1.37.0
|
||||
github.com/VictoriaMetrics/metricsql v0.84.5
|
||||
github.com/aws/aws-sdk-go-v2 v1.36.3
|
||||
github.com/aws/aws-sdk-go-v2/config v1.29.14
|
||||
github.com/aws/aws-sdk-go-v2/feature/s3/manager v1.17.74
|
||||
github.com/aws/aws-sdk-go-v2/service/s3 v1.79.3
|
||||
github.com/aws/aws-sdk-go-v2/feature/s3/manager v1.17.77
|
||||
github.com/aws/aws-sdk-go-v2/service/s3 v1.80.0
|
||||
github.com/bmatcuk/doublestar/v4 v4.8.1
|
||||
github.com/cespare/xxhash/v2 v2.3.0
|
||||
github.com/cheggaaa/pb/v3 v3.1.7
|
||||
@@ -47,7 +47,7 @@ require (
|
||||
github.com/gogo/protobuf v1.3.2
|
||||
github.com/golang/snappy v1.0.0
|
||||
github.com/google/go-cmp v0.7.0
|
||||
github.com/googleapis/gax-go/v2 v2.14.1
|
||||
github.com/googleapis/gax-go/v2 v2.14.2
|
||||
github.com/influxdata/influxdb v1.12.0
|
||||
github.com/klauspost/compress v1.18.0
|
||||
github.com/mattn/go-isatty v0.0.20
|
||||
@@ -56,27 +56,26 @@ require (
|
||||
github.com/valyala/fastjson v1.6.4
|
||||
github.com/valyala/fastrand v1.1.0
|
||||
github.com/valyala/fasttemplate v1.2.2
|
||||
github.com/valyala/gozstd v1.21.2
|
||||
github.com/valyala/gozstd v1.22.0
|
||||
github.com/valyala/histogram v1.2.0
|
||||
github.com/valyala/quicktemplate v1.8.0
|
||||
golang.org/x/net v0.39.0
|
||||
golang.org/x/oauth2 v0.29.0
|
||||
golang.org/x/net v0.40.0
|
||||
golang.org/x/oauth2 v0.30.0
|
||||
golang.org/x/sys v0.33.0
|
||||
google.golang.org/api v0.231.0
|
||||
google.golang.org/api v0.235.0
|
||||
gopkg.in/yaml.v2 v2.4.0
|
||||
)
|
||||
|
||||
require (
|
||||
cloud.google.com/go v0.121.0 // indirect
|
||||
cloud.google.com/go v0.121.2 // indirect
|
||||
cloud.google.com/go/auth v0.16.1 // indirect
|
||||
cloud.google.com/go/auth/oauth2adapt v0.2.8 // indirect
|
||||
cloud.google.com/go/compute/metadata v0.6.0 // indirect
|
||||
cloud.google.com/go/compute/metadata v0.7.0 // indirect
|
||||
cloud.google.com/go/iam v1.5.2 // indirect
|
||||
github.com/Azure/azure-sdk-for-go/sdk/internal v1.11.1 // indirect
|
||||
github.com/AzureAD/microsoft-authentication-library-for-go v1.4.2 // indirect
|
||||
github.com/VividCortex/ewma v1.2.0 // indirect
|
||||
github.com/alecthomas/units v0.0.0-20240927000941-0f3dac36c52b // indirect
|
||||
github.com/aws/aws-sdk-go v1.55.7 // indirect
|
||||
github.com/aws/aws-sdk-go-v2/aws/protocol/eventstream v1.6.10 // indirect
|
||||
github.com/aws/aws-sdk-go-v2/credentials v1.17.67 // indirect
|
||||
github.com/aws/aws-sdk-go-v2/feature/ec2/imds v1.16.30 // indirect
|
||||
@@ -85,7 +84,7 @@ require (
|
||||
github.com/aws/aws-sdk-go-v2/internal/ini v1.8.3 // indirect
|
||||
github.com/aws/aws-sdk-go-v2/internal/v4a v1.3.34 // indirect
|
||||
github.com/aws/aws-sdk-go-v2/service/internal/accept-encoding v1.12.3 // indirect
|
||||
github.com/aws/aws-sdk-go-v2/service/internal/checksum v1.7.1 // indirect
|
||||
github.com/aws/aws-sdk-go-v2/service/internal/checksum v1.7.2 // indirect
|
||||
github.com/aws/aws-sdk-go-v2/service/internal/presigned-url v1.12.15 // indirect
|
||||
github.com/aws/aws-sdk-go-v2/service/internal/s3shared v1.18.15 // indirect
|
||||
github.com/aws/aws-sdk-go-v2/service/sso v1.25.3 // indirect
|
||||
@@ -99,16 +98,16 @@ require (
|
||||
github.com/dennwc/varint v1.0.0 // indirect
|
||||
github.com/fatih/color v1.18.0 // indirect
|
||||
github.com/felixge/httpsnoop v1.0.4 // indirect
|
||||
github.com/go-logr/logr v1.4.2 // indirect
|
||||
github.com/go-logr/logr v1.4.3 // indirect
|
||||
github.com/go-logr/stdr v1.2.2 // indirect
|
||||
github.com/go-viper/mapstructure/v2 v2.2.1 // indirect
|
||||
github.com/gobwas/glob v0.2.3 // indirect
|
||||
github.com/golang-jwt/jwt/v5 v5.2.2 // indirect
|
||||
github.com/google/s2a-go v0.1.9 // indirect
|
||||
github.com/google/uuid v1.6.0 // indirect
|
||||
github.com/googleapis/enterprise-certificate-proxy v0.3.6 // indirect
|
||||
github.com/grafana/regexp v0.0.0-20240518133315-a468a5bfb3bc // indirect
|
||||
github.com/hashicorp/go-version v1.7.0 // indirect
|
||||
github.com/jmespath/go-jmespath v0.4.0 // indirect
|
||||
github.com/jpillora/backoff v1.0.0 // indirect
|
||||
github.com/json-iterator/go v1.1.12 // indirect
|
||||
github.com/knadh/koanf/maps v0.1.2 // indirect
|
||||
@@ -123,61 +122,65 @@ require (
|
||||
github.com/modern-go/reflect2 v1.0.2 // indirect
|
||||
github.com/munnerz/goautoneg v0.0.0-20191010083416-a7dc8b61c822 // indirect
|
||||
github.com/mwitkow/go-conntrack v0.0.0-20190716064945-2f068394615f // indirect
|
||||
github.com/oklog/ulid/v2 v2.1.0 // indirect
|
||||
github.com/open-telemetry/opentelemetry-collector-contrib/internal/exp/metrics v0.125.0 // indirect
|
||||
github.com/open-telemetry/opentelemetry-collector-contrib/pkg/pdatautil v0.125.0 // indirect
|
||||
github.com/open-telemetry/opentelemetry-collector-contrib/processor/deltatocumulativeprocessor v0.125.0 // indirect
|
||||
github.com/oklog/ulid/v2 v2.1.1 // indirect
|
||||
github.com/open-telemetry/opentelemetry-collector-contrib/internal/exp/metrics v0.127.0 // indirect
|
||||
github.com/open-telemetry/opentelemetry-collector-contrib/pkg/pdatautil v0.127.0 // indirect
|
||||
github.com/open-telemetry/opentelemetry-collector-contrib/processor/deltatocumulativeprocessor v0.127.0 // indirect
|
||||
github.com/pkg/browser v0.0.0-20240102092130-5ac0b6a4141c // indirect
|
||||
github.com/pmezard/go-difflib v1.0.1-0.20181226105442-5d4384ee4fb2 // indirect
|
||||
github.com/prometheus/client_golang v1.22.0 // indirect
|
||||
github.com/prometheus/client_model v0.6.2 // indirect
|
||||
github.com/prometheus/common v0.63.0 // indirect
|
||||
github.com/prometheus/common v0.64.0 // indirect
|
||||
github.com/prometheus/procfs v0.16.1 // indirect
|
||||
github.com/prometheus/sigv4 v0.1.2 // indirect
|
||||
github.com/prometheus/sigv4 v0.2.0 // indirect
|
||||
github.com/puzpuzpuz/xsync/v3 v3.5.1 // indirect
|
||||
github.com/rivo/uniseg v0.4.7 // indirect
|
||||
github.com/rogpeppe/go-internal v1.14.1 // indirect
|
||||
github.com/russross/blackfriday/v2 v2.1.0 // indirect
|
||||
github.com/spf13/pflag v1.0.6 // indirect
|
||||
github.com/stretchr/testify v1.10.0 // indirect
|
||||
github.com/valyala/bytebufferpool v1.0.0 // indirect
|
||||
github.com/xrash/smetrics v0.0.0-20240521201337-686a1a2994c1 // indirect
|
||||
go.opentelemetry.io/auto/sdk v1.1.0 // indirect
|
||||
go.opentelemetry.io/collector/component v1.31.0 // indirect
|
||||
go.opentelemetry.io/collector/confmap v1.31.0 // indirect
|
||||
go.opentelemetry.io/collector/confmap/xconfmap v0.125.0 // indirect
|
||||
go.opentelemetry.io/collector/consumer v1.31.0 // indirect
|
||||
go.opentelemetry.io/collector/featuregate v1.31.0 // indirect
|
||||
go.opentelemetry.io/collector/internal/telemetry v0.125.0 // indirect
|
||||
go.opentelemetry.io/collector/pdata v1.31.0 // indirect
|
||||
go.opentelemetry.io/collector/pipeline v0.125.0 // indirect
|
||||
go.opentelemetry.io/collector/processor v1.31.0 // indirect
|
||||
go.opentelemetry.io/collector/semconv v0.125.0 // indirect
|
||||
go.opentelemetry.io/contrib/bridges/otelzap v0.10.0 // indirect
|
||||
go.opentelemetry.io/contrib/instrumentation/google.golang.org/grpc/otelgrpc v0.60.0 // indirect
|
||||
go.opentelemetry.io/contrib/instrumentation/net/http/httptrace/otelhttptrace v0.60.0 // indirect
|
||||
go.opentelemetry.io/contrib/instrumentation/net/http/otelhttp v0.60.0 // indirect
|
||||
go.opentelemetry.io/otel v1.35.0 // indirect
|
||||
go.opentelemetry.io/otel/log v0.11.0 // indirect
|
||||
go.opentelemetry.io/otel/metric v1.35.0 // indirect
|
||||
go.opentelemetry.io/otel/sdk v1.35.0 // indirect
|
||||
go.opentelemetry.io/otel/trace v1.35.0 // indirect
|
||||
go.opentelemetry.io/collector/component v1.33.0 // indirect
|
||||
go.opentelemetry.io/collector/confmap v1.33.0 // indirect
|
||||
go.opentelemetry.io/collector/confmap/xconfmap v0.127.0 // indirect
|
||||
go.opentelemetry.io/collector/consumer v1.33.0 // indirect
|
||||
go.opentelemetry.io/collector/featuregate v1.33.0 // indirect
|
||||
go.opentelemetry.io/collector/internal/telemetry v0.127.0 // indirect
|
||||
go.opentelemetry.io/collector/pdata v1.33.0 // indirect
|
||||
go.opentelemetry.io/collector/pipeline v0.127.0 // indirect
|
||||
go.opentelemetry.io/collector/processor v1.33.0 // indirect
|
||||
go.opentelemetry.io/collector/semconv v0.127.0 // indirect
|
||||
go.opentelemetry.io/contrib/bridges/otelzap v0.11.0 // indirect
|
||||
go.opentelemetry.io/contrib/instrumentation/google.golang.org/grpc/otelgrpc v0.61.0 // indirect
|
||||
go.opentelemetry.io/contrib/instrumentation/net/http/httptrace/otelhttptrace v0.61.0 // indirect
|
||||
go.opentelemetry.io/contrib/instrumentation/net/http/otelhttp v0.61.0 // indirect
|
||||
go.opentelemetry.io/otel v1.36.0 // indirect
|
||||
go.opentelemetry.io/otel/log v0.12.2 // indirect
|
||||
go.opentelemetry.io/otel/metric v1.36.0 // indirect
|
||||
go.opentelemetry.io/otel/sdk v1.36.0 // indirect
|
||||
go.opentelemetry.io/otel/trace v1.36.0 // indirect
|
||||
go.uber.org/atomic v1.11.0 // indirect
|
||||
go.uber.org/goleak v1.3.0 // indirect
|
||||
go.uber.org/multierr v1.11.0 // indirect
|
||||
go.uber.org/zap v1.27.0 // indirect
|
||||
golang.org/x/crypto v0.37.0 // indirect
|
||||
golang.org/x/exp v0.0.0-20250408133849-7e4ce0ab07d0 // indirect
|
||||
golang.org/x/sync v0.13.0 // indirect
|
||||
golang.org/x/text v0.24.0 // indirect
|
||||
golang.org/x/crypto v0.38.0 // indirect
|
||||
golang.org/x/exp v0.0.0-20250531010427-b6e5de432a8b // indirect
|
||||
golang.org/x/sync v0.14.0 // indirect
|
||||
golang.org/x/text v0.25.0 // indirect
|
||||
golang.org/x/time v0.11.0 // indirect
|
||||
google.golang.org/genproto v0.0.0-20250428153025-10db94c68c34 // indirect
|
||||
google.golang.org/genproto/googleapis/api v0.0.0-20250428153025-10db94c68c34 // indirect
|
||||
google.golang.org/genproto/googleapis/rpc v0.0.0-20250428153025-10db94c68c34 // indirect
|
||||
google.golang.org/grpc v1.72.0 // indirect
|
||||
google.golang.org/genproto v0.0.0-20250528174236-200df99c418a // indirect
|
||||
google.golang.org/genproto/googleapis/api v0.0.0-20250528174236-200df99c418a // indirect
|
||||
google.golang.org/genproto/googleapis/rpc v0.0.0-20250528174236-200df99c418a // indirect
|
||||
google.golang.org/grpc v1.72.2 // indirect
|
||||
google.golang.org/protobuf v1.36.6 // indirect
|
||||
gopkg.in/yaml.v3 v3.0.1 // indirect
|
||||
k8s.io/apimachinery v0.33.0 // indirect
|
||||
k8s.io/client-go v0.33.0 // indirect
|
||||
k8s.io/apimachinery v0.33.1 // indirect
|
||||
k8s.io/client-go v0.33.1 // indirect
|
||||
k8s.io/klog/v2 v2.130.1 // indirect
|
||||
k8s.io/utils v0.0.0-20250321185631-1f6e0b77f77e // indirect
|
||||
k8s.io/utils v0.0.0-20250502105355-0f33e8f1c979 // indirect
|
||||
sigs.k8s.io/yaml v1.4.0 // indirect
|
||||
)
|
||||
|
||||
tool github.com/valyala/quicktemplate/qtc
|
||||
|
||||
266
go.sum
266
go.sum
@@ -1,11 +1,11 @@
|
||||
cloud.google.com/go v0.121.0 h1:pgfwva8nGw7vivjZiRfrmglGWiCJBP+0OmDpenG/Fwg=
|
||||
cloud.google.com/go v0.121.0/go.mod h1:rS7Kytwheu/y9buoDmu5EIpMMCI4Mb8ND4aeN4Vwj7Q=
|
||||
cloud.google.com/go v0.121.2 h1:v2qQpN6Dx9x2NmwrqlesOt3Ys4ol5/lFZ6Mg1B7OJCg=
|
||||
cloud.google.com/go v0.121.2/go.mod h1:nRFlrHq39MNVWu+zESP2PosMWA0ryJw8KUBZ2iZpxbw=
|
||||
cloud.google.com/go/auth v0.16.1 h1:XrXauHMd30LhQYVRHLGvJiYeczweKQXZxsTbV9TiguU=
|
||||
cloud.google.com/go/auth v0.16.1/go.mod h1:1howDHJ5IETh/LwYs3ZxvlkXF48aSqqJUM+5o02dNOI=
|
||||
cloud.google.com/go/auth/oauth2adapt v0.2.8 h1:keo8NaayQZ6wimpNSmW5OPc283g65QNIiLpZnkHRbnc=
|
||||
cloud.google.com/go/auth/oauth2adapt v0.2.8/go.mod h1:XQ9y31RkqZCcwJWNSx2Xvric3RrU88hAYYbjDWYDL+c=
|
||||
cloud.google.com/go/compute/metadata v0.6.0 h1:A6hENjEsCDtC1k8byVsgwvVcioamEHvZ4j01OwKxG9I=
|
||||
cloud.google.com/go/compute/metadata v0.6.0/go.mod h1:FjyFAW1MW0C203CEOMDTu3Dk1FlqW3Rga40jzHL4hfg=
|
||||
cloud.google.com/go/compute/metadata v0.7.0 h1:PBWF+iiAerVNe8UCHxdOt6eHLVc3ydFeOCw78U8ytSU=
|
||||
cloud.google.com/go/compute/metadata v0.7.0/go.mod h1:j5MvL9PprKL39t166CoB1uVHfQMs4tFQZZcKwksXUjo=
|
||||
cloud.google.com/go/iam v1.5.2 h1:qgFRAGEmd8z6dJ/qyEchAuL9jpswyODjA2lS+w234g8=
|
||||
cloud.google.com/go/iam v1.5.2/go.mod h1:SE1vg0N81zQqLzQEwxL2WI6yhetBdbNQuTvIKCSkUHE=
|
||||
cloud.google.com/go/longrunning v0.6.7 h1:IGtfDWHhQCgCjwQjV9iiLnUta9LBCo8R9QmAFsS/PrE=
|
||||
@@ -14,8 +14,8 @@ cloud.google.com/go/storage v1.43.0 h1:CcxnSohZwizt4LCzQHWvBf1/kvtHUn7gk9QERXPyX
|
||||
cloud.google.com/go/storage v1.43.0/go.mod h1:ajvxEa7WmZS1PxvKRq4bq0tFT3vMd502JwstCcYv0Q0=
|
||||
github.com/Azure/azure-sdk-for-go/sdk/azcore v1.18.0 h1:Gt0j3wceWMwPmiazCa8MzMA0MfhmPIz0Qp0FJ6qcM0U=
|
||||
github.com/Azure/azure-sdk-for-go/sdk/azcore v1.18.0/go.mod h1:Ot/6aikWnKWi4l9QB7qVSwa8iMphQNqkWALMoNT3rzM=
|
||||
github.com/Azure/azure-sdk-for-go/sdk/azidentity v1.9.0 h1:OVoM452qUFBrX+URdH3VpR299ma4kfom0yB0URYky9g=
|
||||
github.com/Azure/azure-sdk-for-go/sdk/azidentity v1.9.0/go.mod h1:kUjrAo8bgEwLeZ/CmHqNl3Z/kPm7y6FKfxxK0izYUg4=
|
||||
github.com/Azure/azure-sdk-for-go/sdk/azidentity v1.10.0 h1:j8BorDEigD8UFOSZQiSqAMOOleyQOOQPnUAwV+Ls1gA=
|
||||
github.com/Azure/azure-sdk-for-go/sdk/azidentity v1.10.0/go.mod h1:JdM5psgjfBf5fo2uWOZhflPWyDBZ/O/CNAH9CtsuZE4=
|
||||
github.com/Azure/azure-sdk-for-go/sdk/azidentity/cache v0.3.2 h1:yz1bePFlP5Vws5+8ez6T3HWXPmwOK7Yvq8QxDBD3SKY=
|
||||
github.com/Azure/azure-sdk-for-go/sdk/azidentity/cache v0.3.2/go.mod h1:Pa9ZNPuoNu/GztvBSKk9J1cDJW6vk/n0zLtV4mgd8N8=
|
||||
github.com/Azure/azure-sdk-for-go/sdk/internal v1.11.1 h1:FPKJS1T+clwv+OLGt13a8UjqeRuh0O4SJ3lUriThc+4=
|
||||
@@ -38,10 +38,10 @@ github.com/Microsoft/go-winio v0.6.1 h1:9/kr64B9VUZrLm5YYwbGtUJnMgqWVOdUAXu6Migc
|
||||
github.com/Microsoft/go-winio v0.6.1/go.mod h1:LRdKpFKfdobln8UmuiYcKPot9D2v6svN5+sAH+4kjUM=
|
||||
github.com/VictoriaMetrics/easyproto v0.1.4 h1:r8cNvo8o6sR4QShBXQd1bKw/VVLSQma/V2KhTBPf+Sc=
|
||||
github.com/VictoriaMetrics/easyproto v0.1.4/go.mod h1:QlGlzaJnDfFd8Lk6Ci/fuLxfTo3/GThPs2KH23mv710=
|
||||
github.com/VictoriaMetrics/fastcache v1.12.2 h1:N0y9ASrJ0F6h0QaC3o6uJb3NIZ9VKLjCM7NQbSmF7WI=
|
||||
github.com/VictoriaMetrics/fastcache v1.12.2/go.mod h1:AmC+Nzz1+3G2eCPapF6UcsnkThDcMsQicp4xDukwJYI=
|
||||
github.com/VictoriaMetrics/metrics v1.36.0 h1:f3SZMpLgIG4hJm2zfDs6wicxQ/QNWBZekY5rEGgbHKs=
|
||||
github.com/VictoriaMetrics/metrics v1.36.0/go.mod h1:r7hveu6xMdUACXvB8TYdAj8WEsKzWB0EkpJN+RDtOf8=
|
||||
github.com/VictoriaMetrics/fastcache v1.12.5 h1:966OX9JjqYmDAFdp3wEXLwzukiHIm+GVlZHv6B8KW3k=
|
||||
github.com/VictoriaMetrics/fastcache v1.12.5/go.mod h1:K+JGPBn0sueFlLjZ8rcVM0cKkWKNElKyQXmw57QOoYI=
|
||||
github.com/VictoriaMetrics/metrics v1.37.0 h1:u5Yr+HFofQyn7kgmmkufgkX0nEA6G1oEyK2eaKsVaUM=
|
||||
github.com/VictoriaMetrics/metrics v1.37.0/go.mod h1:r7hveu6xMdUACXvB8TYdAj8WEsKzWB0EkpJN+RDtOf8=
|
||||
github.com/VictoriaMetrics/metricsql v0.84.5 h1:3JeIKpEh9yCNBVoeKJovICRvNea6h6m50h/RGW36P2g=
|
||||
github.com/VictoriaMetrics/metricsql v0.84.5/go.mod h1:d4EisFO6ONP/HIGDYTAtwrejJBBeKGQYiRl095bS4QQ=
|
||||
github.com/VividCortex/ewma v1.2.0 h1:f58SaIzcDXrSy3kWaHNvuJgJ3Nmz59Zji6XoJR/q1ow=
|
||||
@@ -52,8 +52,8 @@ github.com/allegro/bigcache v1.2.1-0.20190218064605-e24eb225f156 h1:eMwmnE/GDgah
|
||||
github.com/allegro/bigcache v1.2.1-0.20190218064605-e24eb225f156/go.mod h1:Cb/ax3seSYIx7SuZdm2G2xzfwmv3TPSk2ucNfQESPXM=
|
||||
github.com/armon/go-metrics v0.4.1 h1:hR91U9KYmb6bLBYLQjyM+3j+rcd/UhE+G78SFnF8gJA=
|
||||
github.com/armon/go-metrics v0.4.1/go.mod h1:E6amYzXo6aW1tqzoZGT755KkbgrJsSdpwZ+3JqfkOG4=
|
||||
github.com/aws/aws-sdk-go v1.55.7 h1:UJrkFq7es5CShfBwlWAC8DA077vp8PyVbQd3lqLiztE=
|
||||
github.com/aws/aws-sdk-go v1.55.7/go.mod h1:eRwEWoyTWFMVYVQzKMNHWP5/RV4xIUGMQfXQHfHkpNU=
|
||||
github.com/aws/aws-sdk-go v1.55.6 h1:cSg4pvZ3m8dgYcgqB97MrcdjUmZ1BeMYKUxMMB89IPk=
|
||||
github.com/aws/aws-sdk-go v1.55.6/go.mod h1:eRwEWoyTWFMVYVQzKMNHWP5/RV4xIUGMQfXQHfHkpNU=
|
||||
github.com/aws/aws-sdk-go-v2 v1.32.8 h1:cZV+NUS/eGxKXMtmyhtYPJ7Z4YLoI/V8bkTdRZfYhGo=
|
||||
github.com/aws/aws-sdk-go-v2 v1.32.8/go.mod h1:P5WJBrYqqbWVaOxgH0X/FYYD47/nooaPOZPlQdmiN2U=
|
||||
github.com/aws/aws-sdk-go-v2/aws/protocol/eventstream v1.6.10 h1:zAybnyUQXIZ5mok5Jqwlf58/TFE7uvd3IAsa1aF9cXs=
|
||||
@@ -98,7 +98,6 @@ github.com/beorn7/perks v1.0.1 h1:VlbKKnNfV8bJzeqoa4cOKqO6bYr3WgKZxO8Z16+hsOM=
|
||||
github.com/beorn7/perks v1.0.1/go.mod h1:G2ZrVWU2WbWT9wwq4/hrbKbnv/1ERSJQ0ibhJ6rlkpw=
|
||||
github.com/bmatcuk/doublestar/v4 v4.8.1 h1:54Bopc5c2cAvhLRAzqOGCYHYyhcDHsFF4wWIR5wKP38=
|
||||
github.com/bmatcuk/doublestar/v4 v4.8.1/go.mod h1:xBQ8jztBU6kakFMg+8WGxn0c6z1fTSPVIjEY1Wr7jzc=
|
||||
github.com/cespare/xxhash/v2 v2.2.0/go.mod h1:VGX0DQ3Q6kWi7AoAeZDth3/j3BFtOZR5XLFGgcrjCOs=
|
||||
github.com/cespare/xxhash/v2 v2.3.0 h1:UL815xU9SqsFlibzuggzjXhog7bL6oX9BbNZnL2UFvs=
|
||||
github.com/cespare/xxhash/v2 v2.3.0/go.mod h1:VGX0DQ3Q6kWi7AoAeZDth3/j3BFtOZR5XLFGgcrjCOs=
|
||||
github.com/cheggaaa/pb/v3 v3.1.7 h1:2FsIW307kt7A/rz/ZI2lvPO+v3wKazzE4K/0LtTWsOI=
|
||||
@@ -147,8 +146,8 @@ github.com/fsnotify/fsnotify v1.8.0/go.mod h1:8jBTzvmWwFyi3Pb8djgCCO5IBqzKJ/Jwo8
|
||||
github.com/fxamacker/cbor/v2 v2.7.0 h1:iM5WgngdRBanHcxugY4JySA0nk1wZorNOpTgCMedv5E=
|
||||
github.com/fxamacker/cbor/v2 v2.7.0/go.mod h1:pxXPTn3joSm21Gbwsv0w9OSA2y1HFR9qXEeXQVeNoDQ=
|
||||
github.com/go-logr/logr v1.2.2/go.mod h1:jdQByPbusPIv2/zmleS9BjJVeZ6kBagPoEUsqbVz/1A=
|
||||
github.com/go-logr/logr v1.4.2 h1:6pFjapn8bFcIbiKo3XT4j/BhANplGihG6tvd+8rYgrY=
|
||||
github.com/go-logr/logr v1.4.2/go.mod h1:9T104GzyrTigFIr8wt5mBrctHMim0Nb2HLGrmQ40KvY=
|
||||
github.com/go-logr/logr v1.4.3 h1:CjnDlHq8ikf6E492q6eKboGOC0T8CDaOvkHCIg8idEI=
|
||||
github.com/go-logr/logr v1.4.3/go.mod h1:9T104GzyrTigFIr8wt5mBrctHMim0Nb2HLGrmQ40KvY=
|
||||
github.com/go-logr/stdr v1.2.2 h1:hSWxHoqTgW2S2qGc0LTAI563KZ5YKYRhT3MFKZMbjag=
|
||||
github.com/go-logr/stdr v1.2.2/go.mod h1:mMo/vtBO5dYbehREoey6XUKy/eSumjCCveDpRre4VKE=
|
||||
github.com/go-openapi/jsonpointer v0.21.0 h1:YgdVicSA9vH5RiHs9TZW5oyafXZFc6+2Vc1rr/O9oNQ=
|
||||
@@ -163,13 +162,14 @@ github.com/go-viper/mapstructure/v2 v2.2.1 h1:ZAaOCxANMuZx5RCeg0mBdEZk7DZasvvZIx
|
||||
github.com/go-viper/mapstructure/v2 v2.2.1/go.mod h1:oJDH3BJKyqBA2TXFhDsKDGDTlndYOZ6rGS0BRZIxGhM=
|
||||
github.com/go-zookeeper/zk v1.0.4 h1:DPzxraQx7OrPyXq2phlGlNSIyWEsAox0RJmjTseMV6I=
|
||||
github.com/go-zookeeper/zk v1.0.4/go.mod h1:nOB03cncLtlp4t+UAkGSV+9beXP/akpekBwL+UX1Qcw=
|
||||
github.com/gobwas/glob v0.2.3 h1:A4xDbljILXROh+kObIiy5kIaPYD8e96x1tgBhUI5J+Y=
|
||||
github.com/gobwas/glob v0.2.3/go.mod h1:d3Ez4x06l9bZtSvzIay5+Yzi0fmZzPgnTbPcKjJAkT8=
|
||||
github.com/gogo/protobuf v1.3.2 h1:Ov1cvc58UF3b5XjBnZv7+opcTcQFZebYjWzi34vdm4Q=
|
||||
github.com/gogo/protobuf v1.3.2/go.mod h1:P1XiOD3dCwIKUDQYPy72D8LYyHL2YPYrpS2s69NZV8Q=
|
||||
github.com/golang-jwt/jwt/v5 v5.2.2 h1:Rl4B7itRWVtYIHFrSNd7vhTiz9UpLdi6gZhZ3wEeDy8=
|
||||
github.com/golang-jwt/jwt/v5 v5.2.2/go.mod h1:pqrtFR0X4osieyHYxtmOUWsAWrfe1Q5UVIyoH402zdk=
|
||||
github.com/golang/protobuf v1.5.4 h1:i7eJL8qZTpSEXOPTxNKhASYpMn+8e5Q6AdndVa1dWek=
|
||||
github.com/golang/protobuf v1.5.4/go.mod h1:lnTiLA8Wa4RWRcIUkrtSVa5nRhsEGBg48fD6rSs7xps=
|
||||
github.com/golang/snappy v0.0.4/go.mod h1:/XxbfmMg8lxefKM7IXC3fBNl/7bRcc72aCRzEWrmP2Q=
|
||||
github.com/golang/snappy v1.0.0 h1:Oy607GVXHs7RtbggtPBnr2RmDArIsAefDwvrdWvRhGs=
|
||||
github.com/golang/snappy v1.0.0/go.mod h1:/XxbfmMg8lxefKM7IXC3fBNl/7bRcc72aCRzEWrmP2Q=
|
||||
github.com/google/gnostic-models v0.6.9 h1:MU/8wDLif2qCXZmzncUQ/BOfxWfthHi63KqpoNbWqVw=
|
||||
@@ -188,8 +188,8 @@ github.com/google/uuid v1.6.0 h1:NIvaJDMOsjHA8n1jAhLSgzrAzy1Hgr+hNrb57e+94F0=
|
||||
github.com/google/uuid v1.6.0/go.mod h1:TIyPZe4MgqvfeYDBFedMoGGpEw/LqOeaOT+nhxU+yHo=
|
||||
github.com/googleapis/enterprise-certificate-proxy v0.3.6 h1:GW/XbdyBFQ8Qe+YAmFU9uHLo7OnF5tL52HFAgMmyrf4=
|
||||
github.com/googleapis/enterprise-certificate-proxy v0.3.6/go.mod h1:MkHOF77EYAE7qfSuSS9PU6g4Nt4e11cnsDUowfwewLA=
|
||||
github.com/googleapis/gax-go/v2 v2.14.1 h1:hb0FFeiPaQskmvakKu5EbCbpntQn48jyHuvrkurSS/Q=
|
||||
github.com/googleapis/gax-go/v2 v2.14.1/go.mod h1:Hb/NubMaVM88SrNkvl8X/o8XWwDJEPqouaLeN2IUxoA=
|
||||
github.com/googleapis/gax-go/v2 v2.14.2 h1:eBLnkZ9635krYIPD+ag1USrOAI0Nr0QYF3+/3GqO0k0=
|
||||
github.com/googleapis/gax-go/v2 v2.14.2/go.mod h1:ON64QhlJkhVtSqp4v1uaK92VyZ2gmvDQsweuyLV+8+w=
|
||||
github.com/gophercloud/gophercloud/v2 v2.6.0 h1:XJKQ0in3iHOZHVAFMXq/OhjCuvvG+BKR0unOqRfG1EI=
|
||||
github.com/gophercloud/gophercloud/v2 v2.6.0/go.mod h1:Ki/ILhYZr/5EPebrPL9Ej+tUg4lqx71/YH2JWVeU+Qk=
|
||||
github.com/gorilla/websocket v1.5.4-0.20250319132907-e064f32e3674 h1:JeSE6pjso5THxAzdVpqr6/geYxZytqFMBCOtn/ujyeo=
|
||||
@@ -230,8 +230,6 @@ github.com/ionos-cloud/sdk-go/v6 v6.3.2 h1:2mUmrZZz6cPyT9IRX0T8fBLc/7XU/eTxP2Y5t
|
||||
github.com/ionos-cloud/sdk-go/v6 v6.3.2/go.mod h1:SXrO9OGyWjd2rZhAhEpdYN6VUAODzzqRdqA9BCviQtI=
|
||||
github.com/jmespath/go-jmespath v0.4.0 h1:BEgLn5cpjn8UN1mAw4NjwDrS35OdebyEtFe+9YPoQUg=
|
||||
github.com/jmespath/go-jmespath v0.4.0/go.mod h1:T8mJZnbsbmF+m6zOOFylbeCJqk5+pHWvzYPziyZiYoo=
|
||||
github.com/jmespath/go-jmespath/internal/testify v1.5.1 h1:shLQSRRSCCPj3f2gpwzGwWFoC7ycTf1rcQZHOlsJ6N8=
|
||||
github.com/jmespath/go-jmespath/internal/testify v1.5.1/go.mod h1:L3OGu8Wl2/fWfCI6z80xFu9LTZmf1ZRjMHUOPmWr69U=
|
||||
github.com/josharian/intern v1.0.0 h1:vlS4z54oSdjm0bgjRigI+G1HpF+tI+9rE5LLzOg8HmY=
|
||||
github.com/josharian/intern v1.0.0/go.mod h1:5DoeVV0s6jJacbCEi61lwdGj/aVlrQvzHFFd8Hwg//Y=
|
||||
github.com/jpillora/backoff v1.0.0 h1:uvFg412JmmHBHw7iwprIxkPMI+sGQ4kzOWsMeHnm2EA=
|
||||
@@ -289,16 +287,16 @@ github.com/munnerz/goautoneg v0.0.0-20191010083416-a7dc8b61c822 h1:C3w9PqII01/Oq
|
||||
github.com/munnerz/goautoneg v0.0.0-20191010083416-a7dc8b61c822/go.mod h1:+n7T8mK8HuQTcFwEeznm/DIxMOiR9yIdICNftLE1DvQ=
|
||||
github.com/mwitkow/go-conntrack v0.0.0-20190716064945-2f068394615f h1:KUppIJq7/+SVif2QVs3tOP0zanoHgBEVAwHxUSIzRqU=
|
||||
github.com/mwitkow/go-conntrack v0.0.0-20190716064945-2f068394615f/go.mod h1:qRWi+5nqEBWmkhHvq77mSJWrCKwh8bxhgT7d/eI7P4U=
|
||||
github.com/oklog/ulid/v2 v2.1.0 h1:+9lhoxAP56we25tyYETBBY1YLA2SaoLvUFgrP2miPJU=
|
||||
github.com/oklog/ulid/v2 v2.1.0/go.mod h1:rcEKHmBBKfef9DhnvX7y1HZBYxjXb0cP5ExxNsTT1QQ=
|
||||
github.com/open-telemetry/opentelemetry-collector-contrib/internal/exp/metrics v0.125.0 h1:xNTSTF+Z0Vn3Nt2aUJ5JrJUUsrDA4l+oy2hVIGhPHxc=
|
||||
github.com/open-telemetry/opentelemetry-collector-contrib/internal/exp/metrics v0.125.0/go.mod h1:wBz+TYCFKo0gZtIxORKtTKaUZqTJFTZh/bkyQ9tUqMg=
|
||||
github.com/open-telemetry/opentelemetry-collector-contrib/pkg/pdatatest v0.125.0 h1:IzhLlqlwxWM0PcGeyq6ispujXRTyzeA37LNtcQHOvdg=
|
||||
github.com/open-telemetry/opentelemetry-collector-contrib/pkg/pdatatest v0.125.0/go.mod h1:/WDZg8/Uk2niDeFWkijYvWkQ9gaRF0Vkj/RxGDRcMEY=
|
||||
github.com/open-telemetry/opentelemetry-collector-contrib/pkg/pdatautil v0.125.0 h1:ZzDmvZcWi59c4gZLlkV+NbzDseuFNPePhgZ8XoZqfAI=
|
||||
github.com/open-telemetry/opentelemetry-collector-contrib/pkg/pdatautil v0.125.0/go.mod h1:Hulx7f7AcWKM7crzT0HKxubNqN4qMF8wGyrC3W0BIYc=
|
||||
github.com/open-telemetry/opentelemetry-collector-contrib/processor/deltatocumulativeprocessor v0.125.0 h1:nuXuleB2L/E8nctDbyRWKGv3DlAggzc4mtnQKf291PY=
|
||||
github.com/open-telemetry/opentelemetry-collector-contrib/processor/deltatocumulativeprocessor v0.125.0/go.mod h1:AFs92cGgB/uaKbX48kuI7eawXr6eG93sCMvaCV5a/yw=
|
||||
github.com/oklog/ulid/v2 v2.1.1 h1:suPZ4ARWLOJLegGFiZZ1dFAkqzhMjL3J1TzI+5wHz8s=
|
||||
github.com/oklog/ulid/v2 v2.1.1/go.mod h1:rcEKHmBBKfef9DhnvX7y1HZBYxjXb0cP5ExxNsTT1QQ=
|
||||
github.com/open-telemetry/opentelemetry-collector-contrib/internal/exp/metrics v0.127.0 h1:+rH1wkeYNBwK2FGpEejlgQ+y7rAky8NI+jZmXPe4ba8=
|
||||
github.com/open-telemetry/opentelemetry-collector-contrib/internal/exp/metrics v0.127.0/go.mod h1:iEHea6+K/GmU8euv5xc8jCWCITUySuGsd6raknzduEM=
|
||||
github.com/open-telemetry/opentelemetry-collector-contrib/pkg/pdatatest v0.127.0 h1:1gE/wca+n2hptpCrH60oqbTdXUMvMyZSe0lBkaBmUpQ=
|
||||
github.com/open-telemetry/opentelemetry-collector-contrib/pkg/pdatatest v0.127.0/go.mod h1:kEufI2rLrjeBxAyV+SElguqAyZNU3OUVOVhPCC+eJDw=
|
||||
github.com/open-telemetry/opentelemetry-collector-contrib/pkg/pdatautil v0.127.0 h1:htRqI1VzOR/9ATKKl28Ps4q/GR9T6tG+lwSdXnbufRE=
|
||||
github.com/open-telemetry/opentelemetry-collector-contrib/pkg/pdatautil v0.127.0/go.mod h1:eYArfh5F/dmAP8LKFcZfTThRUGYyuN/zaUA2G+H88qg=
|
||||
github.com/open-telemetry/opentelemetry-collector-contrib/processor/deltatocumulativeprocessor v0.127.0 h1:ti7n1evZjVhrb4nfNkz/DoX786Te7K6LIijDrwuJDiI=
|
||||
github.com/open-telemetry/opentelemetry-collector-contrib/processor/deltatocumulativeprocessor v0.127.0/go.mod h1:T2+yXuRD1SnC7agO/EQYPXHhBe6DKdoWdomGTUMJwyM=
|
||||
github.com/opencontainers/go-digest v1.0.0 h1:apOUWs51W5PlhuyGyz9FCeeBIOUDA/6nW8Oi/yOhh5U=
|
||||
github.com/opencontainers/go-digest v1.0.0/go.mod h1:0JzlMkj0TRzQZfJkVvzbP0HBR3IKzErnv2BNG4W4MAM=
|
||||
github.com/opencontainers/image-spec v1.0.2 h1:9yCKha/T5XdGtO0q9Q9a6T5NUCsTn/DrBg0D7ufOcFM=
|
||||
@@ -319,29 +317,29 @@ github.com/prometheus/client_golang v1.22.0 h1:rb93p9lokFEsctTys46VnV1kLCDpVZ0a/
|
||||
github.com/prometheus/client_golang v1.22.0/go.mod h1:R7ljNsLXhuQXYZYtw6GAE9AZg8Y7vEW5scdCXrWRXC0=
|
||||
github.com/prometheus/client_model v0.6.2 h1:oBsgwpGs7iVziMvrGhE53c/GrLUsZdHnqNwqPLxwZyk=
|
||||
github.com/prometheus/client_model v0.6.2/go.mod h1:y3m2F6Gdpfy6Ut/GBsUqTWZqCUvMVzSfMLjcu6wAwpE=
|
||||
github.com/prometheus/common v0.63.0 h1:YR/EIY1o3mEFP/kZCD7iDMnLPlGyuU2Gb3HIcXnA98k=
|
||||
github.com/prometheus/common v0.63.0/go.mod h1:VVFF/fBIoToEnWRVkYoXEkq3R3paCoxG9PXP74SnV18=
|
||||
github.com/prometheus/common v0.64.0 h1:pdZeA+g617P7oGv1CzdTzyeShxAGrTBsolKNOLQPGO4=
|
||||
github.com/prometheus/common v0.64.0/go.mod h1:0gZns+BLRQ3V6NdaerOhMbwwRbNh9hkGINtQAsP5GS8=
|
||||
github.com/prometheus/procfs v0.16.1 h1:hZ15bTNuirocR6u0JZ6BAHHmwS1p8B4P6MRqxtzMyRg=
|
||||
github.com/prometheus/procfs v0.16.1/go.mod h1:teAbpZRB1iIAJYREa1LsoWUXykVXA1KlTmWl8x/U+Is=
|
||||
github.com/prometheus/prometheus v0.303.1 h1:He/2jRE6sB23Ew38AIoR1WRR3fCMgPlJA2E0obD2WSY=
|
||||
github.com/prometheus/prometheus v0.303.1/go.mod h1:WEq2ogBPZoLjj9x5K67VEk7ECR0nRD9XCjaOt1lsYck=
|
||||
github.com/prometheus/sigv4 v0.1.2 h1:R7570f8AoM5YnTUPFm3mjZH5q2k4D+I/phCWvZ4PXG8=
|
||||
github.com/prometheus/sigv4 v0.1.2/go.mod h1:GF9fwrvLgkQwDdQ5BXeV9XUSCH/IPNqzvAoaohfjqMU=
|
||||
github.com/prometheus/sigv4 v0.2.0 h1:qDFKnHYFswJxdzGeRP63c4HlH3Vbn1Yf/Ao2zabtVXk=
|
||||
github.com/prometheus/sigv4 v0.2.0/go.mod h1:D04rqmAaPPEUkjRQxGqjoxdyJuyCh6E0M18fZr0zBiE=
|
||||
github.com/puzpuzpuz/xsync/v3 v3.5.1 h1:GJYJZwO6IdxN/IKbneznS6yPkVC+c3zyY/j19c++5Fg=
|
||||
github.com/puzpuzpuz/xsync/v3 v3.5.1/go.mod h1:VjzYrABPabuM4KyBh1Ftq6u8nhwY5tBPKP9jpmh0nnA=
|
||||
github.com/redis/go-redis/v9 v9.7.3 h1:YpPyAayJV+XErNsatSElgRZZVCwXX9QzkKYNvO7x0wM=
|
||||
github.com/redis/go-redis/v9 v9.7.3/go.mod h1:bGUrSggJ9X9GUmZpZNEOQKaANxSGgOEBRltRTZHSvrA=
|
||||
github.com/redis/go-redis/v9 v9.8.0 h1:q3nRvjrlge/6UD7eTu/DSg2uYiU2mCL0G/uzBWqhicI=
|
||||
github.com/redis/go-redis/v9 v9.8.0/go.mod h1:huWgSWd8mW6+m0VPhJjSSQ+d6Nh1VICQ6Q5lHuCH/Iw=
|
||||
github.com/rivo/uniseg v0.2.0/go.mod h1:J6wj4VEh+S6ZtnVlnTBMWIodfgj8LQOQFoIToxlJtxc=
|
||||
github.com/rivo/uniseg v0.4.7 h1:WUdvkW8uEhrYfLC4ZzdpI2ztxP1I582+49Oc5Mq64VQ=
|
||||
github.com/rivo/uniseg v0.4.7/go.mod h1:FN3SvrM+Zdj16jyLfmOkMNblXMcoc8DfTHruCPUcx88=
|
||||
github.com/rogpeppe/go-internal v1.13.1 h1:KvO1DLK/DRN07sQ1LQKScxyZJuNnedQ5/wKSR38lUII=
|
||||
github.com/rogpeppe/go-internal v1.13.1/go.mod h1:uMEvuHeurkdAXX61udpOXGD/AzZDWNMNyH2VO9fmH0o=
|
||||
github.com/rogpeppe/go-internal v1.14.1 h1:UQB4HGPB6osV0SQTLymcB4TgvyWu6ZyliaW0tI/otEQ=
|
||||
github.com/rogpeppe/go-internal v1.14.1/go.mod h1:MaRKkUm5W0goXpeCfT7UZI6fk/L7L7so1lCWt35ZSgc=
|
||||
github.com/russross/blackfriday/v2 v2.1.0 h1:JIOH55/0cWyOuilr9/qlrm0BSXldqnqwMsf35Ld67mk=
|
||||
github.com/russross/blackfriday/v2 v2.1.0/go.mod h1:+Rmxgy9KzJVeS9/2gXHxylqXiyQDYRxCVz55jmeOWTM=
|
||||
github.com/scaleway/scaleway-sdk-go v1.0.0-beta.32 h1:4+LP7qmsLSGbmc66m1s5dKRMBwztRppfxFKlYqYte/c=
|
||||
github.com/scaleway/scaleway-sdk-go v1.0.0-beta.32/go.mod h1:kzh+BSAvpoyHHdHBCDhmSWtBc1NbLMZ2lWHqnBoxFks=
|
||||
github.com/spf13/pflag v1.0.5 h1:iy+VFUOCP1a+8yFto/drg2CJ5u0yRoB7fZw3DKv/JXA=
|
||||
github.com/spf13/pflag v1.0.5/go.mod h1:McXfInJRrz4CZXVZOBLb0bTZqETkiAhM9Iw0y3An2Bg=
|
||||
github.com/spf13/pflag v1.0.6 h1:jFzHGLGAlb3ruxLB8MhbI6A8+AQX/2eW4qeyNZXNp2o=
|
||||
github.com/spf13/pflag v1.0.6/go.mod h1:McXfInJRrz4CZXVZOBLb0bTZqETkiAhM9Iw0y3An2Bg=
|
||||
github.com/stretchr/objx v0.1.0/go.mod h1:HFkY916IF+rwdDfMAkV7OtwuqBVzrE8GR6GFx+wExME=
|
||||
github.com/stretchr/objx v0.4.0/go.mod h1:YvHI0jy2hoMjB+UWwv71VJQ9isScKT/TqJzVSSt89Yw=
|
||||
github.com/stretchr/objx v0.5.0/go.mod h1:Yh+to48EsGEfYuaHDzXPcE3xhTkx73EhmCGUpEOglKo=
|
||||
@@ -364,8 +362,8 @@ github.com/valyala/fastrand v1.1.0 h1:f+5HkLW4rsgzdNoleUOB69hyT9IlD2ZQh9GyDMfb5G
|
||||
github.com/valyala/fastrand v1.1.0/go.mod h1:HWqCzkrkg6QXT8V2EXWvXCoow7vLwOFN002oeRzjapQ=
|
||||
github.com/valyala/fasttemplate v1.2.2 h1:lxLXG0uE3Qnshl9QyaK6XJxMXlQZELvChBOCmQD0Loo=
|
||||
github.com/valyala/fasttemplate v1.2.2/go.mod h1:KHLXt3tVN2HBp8eijSv/kGJopbvo7S+qRAEEKiv+SiQ=
|
||||
github.com/valyala/gozstd v1.21.2 h1:SBZ6sYA9y+u32XSds1TwOJJatcqmA3TgfLwGtV78Fcw=
|
||||
github.com/valyala/gozstd v1.21.2/go.mod h1:y5Ew47GLlP37EkTB+B4s7r6A5rdaeB7ftbl9zoYiIPQ=
|
||||
github.com/valyala/gozstd v1.22.0 h1:y9gANljS8mrehiLWrnLK3B98ITnLneIO6FiK2jpvNUo=
|
||||
github.com/valyala/gozstd v1.22.0/go.mod h1:y5Ew47GLlP37EkTB+B4s7r6A5rdaeB7ftbl9zoYiIPQ=
|
||||
github.com/valyala/histogram v1.2.0 h1:wyYGAZZt3CpwUiIb9AU/Zbllg1llXyrtApRS815OLoQ=
|
||||
github.com/valyala/histogram v1.2.0/go.mod h1:Hb4kBwb4UxsaNbbbh+RRz8ZR6pdodR57tzWUS3BUzXY=
|
||||
github.com/valyala/quicktemplate v1.8.0 h1:zU0tjbIqTRgKQzFY1L42zq0qR3eh4WoQQdIdqCysW5k=
|
||||
@@ -380,62 +378,64 @@ github.com/yuin/goldmark v1.1.27/go.mod h1:3hX8gzYuyVAZsxl0MRgGTJEmQBFcNTphYh9de
|
||||
github.com/yuin/goldmark v1.2.1/go.mod h1:3hX8gzYuyVAZsxl0MRgGTJEmQBFcNTphYh9decYSb74=
|
||||
go.opentelemetry.io/auto/sdk v1.1.0 h1:cH53jehLUN6UFLY71z+NDOiNJqDdPRaXzTel0sJySYA=
|
||||
go.opentelemetry.io/auto/sdk v1.1.0/go.mod h1:3wSPjt5PWp2RhlCcmmOial7AvC4DQqZb7a7wCow3W8A=
|
||||
go.opentelemetry.io/collector/component v1.31.0 h1:9LzU8X1RhV3h8/QsAoTX23aFUfoJ3EUc9O/vK+hFpSI=
|
||||
go.opentelemetry.io/collector/component v1.31.0/go.mod h1:JbZl/KywXJxpUXPbt96qlEXJSym1zQ2hauMxYMuvlxM=
|
||||
go.opentelemetry.io/collector/component/componentstatus v0.125.0 h1:zlxGQZYd9kknRZSjRpOYW5SBjl0a5zYFYRPbreobXoU=
|
||||
go.opentelemetry.io/collector/component/componentstatus v0.125.0/go.mod h1:bHXc2W8bqqo9adOvCgvhcO7pYzJOSpyV4cuQ1wiIl04=
|
||||
go.opentelemetry.io/collector/component/componenttest v0.125.0 h1:E2mpnMQbkMpYoZ3Q8pHx4kod7kedjwRs1xqDpzCe/84=
|
||||
go.opentelemetry.io/collector/component/componenttest v0.125.0/go.mod h1:pQtsE1u/SPZdTphP5BZP64XbjXSq6wc+mDut5Ws/JDI=
|
||||
go.opentelemetry.io/collector/confmap v1.31.0 h1:+AW5VJc1rCtgEyGd+1J5uSNw/kVZ98+lKO/pqXEwVvU=
|
||||
go.opentelemetry.io/collector/confmap v1.31.0/go.mod h1:TdutQlIoHDPXcZ2xZ0QWGRkSFC8oTKO61zTx569dvrY=
|
||||
go.opentelemetry.io/collector/confmap/xconfmap v0.125.0 h1:Y0LPtz+xgtRYVAk2gZmvnBROEJj8C3YDiFPj5URbsX8=
|
||||
go.opentelemetry.io/collector/confmap/xconfmap v0.125.0/go.mod h1:8hNqCMs9Gzahh4W1h5XWOrQ+bE6NfP13WAggNyExJJs=
|
||||
go.opentelemetry.io/collector/consumer v1.31.0 h1:L+y66ywxLHnAxnUxv0JDwUf5bFj53kMxCCyEfRKlM7s=
|
||||
go.opentelemetry.io/collector/consumer v1.31.0/go.mod h1:rPsqy5ni+c6xNMUkOChleZYO/nInVY6eaBNZ1FmWJVk=
|
||||
go.opentelemetry.io/collector/consumer/consumertest v0.125.0 h1:TUkxomGS4DAtjBvcWQd2UY4FDLLEKMQD6iOIDUr/5dM=
|
||||
go.opentelemetry.io/collector/consumer/consumertest v0.125.0/go.mod h1:vkHf3y85cFLDHARO/cTREVjLjOPAV+cQg7lkC44DWOY=
|
||||
go.opentelemetry.io/collector/consumer/xconsumer v0.125.0 h1:oTreUlk1KpMSWwuHFnstW+orrjGTyvs2xd3o/Dpy+hI=
|
||||
go.opentelemetry.io/collector/consumer/xconsumer v0.125.0/go.mod h1:FX0G37r0W+wXRgxxFtwEJ4rlsCB+p0cIaxtU3C4hskw=
|
||||
go.opentelemetry.io/collector/featuregate v1.31.0 h1:20q7plPQZwmAiaYAa6l1m/i2qDITZuWlhjr4EkmeQls=
|
||||
go.opentelemetry.io/collector/featuregate v1.31.0/go.mod h1:Y/KsHbvREENKvvN9RlpiWk/IGBK+CATBYzIIpU7nccc=
|
||||
go.opentelemetry.io/collector/internal/telemetry v0.125.0 h1:6lcGOxw3dAg7LfXTKdN8ZjR+l7KvzLdEiPMhhLwG4r4=
|
||||
go.opentelemetry.io/collector/internal/telemetry v0.125.0/go.mod h1:5GyFslLqjZgq1DZTtFiluxYhhXrCofHgOOOybodDPGE=
|
||||
go.opentelemetry.io/collector/pdata v1.31.0 h1:P5WuLr1l2JcIvr6Dw2hl01ltp2ZafPnC4Isv+BLTBqU=
|
||||
go.opentelemetry.io/collector/pdata v1.31.0/go.mod h1:m41io9nWpy7aCm/uD1L9QcKiZwOP0ldj83JEA34dmlk=
|
||||
go.opentelemetry.io/collector/pdata/pprofile v0.125.0 h1:Qqlx8w1HpiYZ9RQqjmMQIysI0cHNO1nh3E/fCTeFysA=
|
||||
go.opentelemetry.io/collector/pdata/pprofile v0.125.0/go.mod h1:p/yK023VxAp8hm27/1G5DPTcMIpnJy3cHGAFUQZGyaQ=
|
||||
go.opentelemetry.io/collector/pdata/testdata v0.125.0 h1:due1Hl0EEVRVwfCkiamRy5E8lS6yalv0lo8Zl/SJtGw=
|
||||
go.opentelemetry.io/collector/pdata/testdata v0.125.0/go.mod h1:1GpEWlgdMrd+fWsBk37ZC2YmOP5YU3gFQ4rWuCu9g24=
|
||||
go.opentelemetry.io/collector/pipeline v0.125.0 h1:oitBgcAFqntDB4ihQJUHJSQ8IHqKFpPkaTVbTYdIUzM=
|
||||
go.opentelemetry.io/collector/pipeline v0.125.0/go.mod h1:TO02zju/K6E+oFIOdi372Wk0MXd+Szy72zcTsFQwXl4=
|
||||
go.opentelemetry.io/collector/processor v1.31.0 h1:+u7sBUpnCBsHYoALp4hfr9VEjLHHYa4uKENGITe0K9Q=
|
||||
go.opentelemetry.io/collector/processor v1.31.0/go.mod h1:5hDYJ7/hTdfd2tF2Rj5Hs6+mfyFz2O7CaPzVvW1qHQc=
|
||||
go.opentelemetry.io/collector/processor/processortest v0.125.0 h1:ZVAN4iZPDcWhpzKqnuok2NIuS5hwGVVQUOWkJFR12tA=
|
||||
go.opentelemetry.io/collector/processor/processortest v0.125.0/go.mod h1:VAw0IRG35cWTBjBtreXeXJEgqkRegfjrH/EuLhNX2+I=
|
||||
go.opentelemetry.io/collector/processor/xprocessor v0.125.0 h1:VWYPMW1VmDq6xB7M5SYjBpQCCIq3MhQ3W++wU47QpZM=
|
||||
go.opentelemetry.io/collector/processor/xprocessor v0.125.0/go.mod h1:bCxUyFVlksANg8wjYZqWVsRB33lkLQ294rTrju/IZiM=
|
||||
go.opentelemetry.io/collector/semconv v0.125.0 h1:SyRP617YGvNSWRSKMy7Lbk9RaJSR+qFAAfyxJOeZe4s=
|
||||
go.opentelemetry.io/collector/semconv v0.125.0/go.mod h1:te6VQ4zZJO5Lp8dM2XIhDxDiL45mwX0YAQQWRQ0Qr9U=
|
||||
go.opentelemetry.io/contrib/bridges/otelzap v0.10.0 h1:ojdSRDvjrnm30beHOmwsSvLpoRF40MlwNCA+Oo93kXU=
|
||||
go.opentelemetry.io/contrib/bridges/otelzap v0.10.0/go.mod h1:oTTm4g7NEtHSV2i/0FeVdPaPgUIZPfQkFbq0vbzqnv0=
|
||||
go.opentelemetry.io/contrib/instrumentation/google.golang.org/grpc/otelgrpc v0.60.0 h1:x7wzEgXfnzJcHDwStJT+mxOz4etr2EcexjqhBvmoakw=
|
||||
go.opentelemetry.io/contrib/instrumentation/google.golang.org/grpc/otelgrpc v0.60.0/go.mod h1:rg+RlpR5dKwaS95IyyZqj5Wd4E13lk/msnTS0Xl9lJM=
|
||||
go.opentelemetry.io/contrib/instrumentation/net/http/httptrace/otelhttptrace v0.60.0 h1:0tY123n7CdWMem7MOVdKOt0YfshufLCwfE5Bob+hQuM=
|
||||
go.opentelemetry.io/contrib/instrumentation/net/http/httptrace/otelhttptrace v0.60.0/go.mod h1:CosX/aS4eHnG9D7nESYpV753l4j9q5j3SL/PUYd2lR8=
|
||||
go.opentelemetry.io/contrib/instrumentation/net/http/otelhttp v0.60.0 h1:sbiXRNDSWJOTobXh5HyQKjq6wUC5tNybqjIqDpAY4CU=
|
||||
go.opentelemetry.io/contrib/instrumentation/net/http/otelhttp v0.60.0/go.mod h1:69uWxva0WgAA/4bu2Yy70SLDBwZXuQ6PbBpbsa5iZrQ=
|
||||
go.opentelemetry.io/otel v1.35.0 h1:xKWKPxrxB6OtMCbmMY021CqC45J+3Onta9MqjhnusiQ=
|
||||
go.opentelemetry.io/otel v1.35.0/go.mod h1:UEqy8Zp11hpkUrL73gSlELM0DupHoiq72dR+Zqel/+Y=
|
||||
go.opentelemetry.io/otel/log v0.11.0 h1:c24Hrlk5WJ8JWcwbQxdBqxZdOK7PcP/LFtOtwpDTe3Y=
|
||||
go.opentelemetry.io/otel/log v0.11.0/go.mod h1:U/sxQ83FPmT29trrifhQg+Zj2lo1/IPN1PF6RTFqdwc=
|
||||
go.opentelemetry.io/otel/metric v1.35.0 h1:0znxYu2SNyuMSQT4Y9WDWej0VpcsxkuklLa4/siN90M=
|
||||
go.opentelemetry.io/otel/metric v1.35.0/go.mod h1:nKVFgxBZ2fReX6IlyW28MgZojkoAkJGaE8CpgeAU3oE=
|
||||
go.opentelemetry.io/otel/sdk v1.35.0 h1:iPctf8iprVySXSKJffSS79eOjl9pvxV9ZqOWT0QejKY=
|
||||
go.opentelemetry.io/otel/sdk v1.35.0/go.mod h1:+ga1bZliga3DxJ3CQGg3updiaAJoNECOgJREo9KHGQg=
|
||||
go.opentelemetry.io/otel/sdk/metric v1.35.0 h1:1RriWBmCKgkeHEhM7a2uMjMUfP7MsOF5JpUCaEqEI9o=
|
||||
go.opentelemetry.io/otel/sdk/metric v1.35.0/go.mod h1:is6XYCUMpcKi+ZsOvfluY5YstFnhW0BidkR+gL+qN+w=
|
||||
go.opentelemetry.io/otel/trace v1.35.0 h1:dPpEfJu1sDIqruz7BHFG3c7528f6ddfSWfFDVt/xgMs=
|
||||
go.opentelemetry.io/otel/trace v1.35.0/go.mod h1:WUk7DtFp1Aw2MkvqGdwiXYDZZNvA/1J8o6xRXLrIkyc=
|
||||
go.opentelemetry.io/collector/component v1.33.0 h1:AoP5ZGEU7Q3YDYQx2CgYy82Xmy3gLgh1WCMeLtTXXFo=
|
||||
go.opentelemetry.io/collector/component v1.33.0/go.mod h1:/5v3hl1GSQT45D6T7sE/LB6nlQMMRHCYDX1glJamh7E=
|
||||
go.opentelemetry.io/collector/component/componentstatus v0.127.0 h1:3oZU2b7Giyc+tnrStYDWJAPHt2QxWOWuhTumGiHl9OQ=
|
||||
go.opentelemetry.io/collector/component/componentstatus v0.127.0/go.mod h1:9afwixYMvsb1xvmxxg33XzMU7ZTe4pBitkugj5DDZdQ=
|
||||
go.opentelemetry.io/collector/component/componenttest v0.127.0 h1:2cieQeh5OS1zf73Aad4b8Rf5vCDk5Hlb6oeJH7Q1VYs=
|
||||
go.opentelemetry.io/collector/component/componenttest v0.127.0/go.mod h1:0jHbHYRXSNS+nm2vSsxpdAsIj+EDehxKRGk4oclyHKs=
|
||||
go.opentelemetry.io/collector/confmap v1.33.0 h1:dCLSrONMssTWhnbELZZpJoWMn+P+DVJc8r10JJCeS/4=
|
||||
go.opentelemetry.io/collector/confmap v1.33.0/go.mod h1:fq5ccP4lzF3IVK/Cs0kWsiH0dynejXkMc8gaNwvkvtk=
|
||||
go.opentelemetry.io/collector/confmap/xconfmap v0.127.0 h1:isSNkBXltLxUWstxJyHcJ3qVo9qp9GABCVhzIvZgIdM=
|
||||
go.opentelemetry.io/collector/confmap/xconfmap v0.127.0/go.mod h1:K9GaSgmMYxM1/QlAVNIj2fX9LekInm9dwFnIeF1HCgs=
|
||||
go.opentelemetry.io/collector/consumer v1.33.0 h1:y6ohYtFsXHdD3eJ67SRHSgumRQRNlR6N+DuyjOq3hYo=
|
||||
go.opentelemetry.io/collector/consumer v1.33.0/go.mod h1:WwB/nHWw6KwumVy7OayUmvRa7V3UsfK+f8qwW8/c5rY=
|
||||
go.opentelemetry.io/collector/consumer/consumertest v0.127.0 h1:rtp7ilS1P1xVfmZu0XnWohhi1N2d+wtWo9ORo8A1Xb8=
|
||||
go.opentelemetry.io/collector/consumer/consumertest v0.127.0/go.mod h1:SFn8ifdrKulaQWDIvQskmEjSNdMZMQ5upQYJXLFEvzg=
|
||||
go.opentelemetry.io/collector/consumer/xconsumer v0.127.0 h1:23qpVECDiqad44d9HtQ1M4P4g2xbB4A7R1b9yux2Gag=
|
||||
go.opentelemetry.io/collector/consumer/xconsumer v0.127.0/go.mod h1:vZ06tk8nu2OyeizjN6AtlaftY79WuODi2rC3U7lxsb4=
|
||||
go.opentelemetry.io/collector/featuregate v1.33.0 h1:ronhxafsUE7H3Cem4U2PXrvDZhxA9Gixx4Wik7X32X8=
|
||||
go.opentelemetry.io/collector/featuregate v1.33.0/go.mod h1:Y/KsHbvREENKvvN9RlpiWk/IGBK+CATBYzIIpU7nccc=
|
||||
go.opentelemetry.io/collector/internal/telemetry v0.127.0 h1:/wAnPmFjUN7MwnRyDYJzUJZa5n0qK9zM1F7PgMWM5Y0=
|
||||
go.opentelemetry.io/collector/internal/telemetry v0.127.0/go.mod h1:Un7Zn//l0BkE6hk6wirsTGwnJJpxw/gJWgzYL3eSruk=
|
||||
go.opentelemetry.io/collector/pdata v1.33.0 h1:PuqiZzdCoBJo9NmMzuYfzazpeFZyLmbDVcRrvb497lg=
|
||||
go.opentelemetry.io/collector/pdata v1.33.0/go.mod h1:TDvbHuvIK+g6xqu1gxtz8ti4pB2x1WcBpjFob5KfleU=
|
||||
go.opentelemetry.io/collector/pdata/pprofile v0.127.0 h1:t0fpwMunK+dkUTPFc0zim8qfAan086eMqpSufnt+H30=
|
||||
go.opentelemetry.io/collector/pdata/pprofile v0.127.0/go.mod h1:6S6q2+vaF7qfDxLKctQUB+CN7hThuz73p4le6mYLWnQ=
|
||||
go.opentelemetry.io/collector/pdata/testdata v0.127.0 h1:1j6KWO/7TyyUaYpIeyxWzsE/klVYGFhbsTCJp4GaTco=
|
||||
go.opentelemetry.io/collector/pdata/testdata v0.127.0/go.mod h1:UXvOckTD4hhAA9nzRQik0lVBU/hJ+SFes+ar9LjzYBk=
|
||||
go.opentelemetry.io/collector/pipeline v0.127.0 h1:WdllRrWwsJ1yAr9l4LRiArb0ekdNaGuMJP8zQ6lZlos=
|
||||
go.opentelemetry.io/collector/pipeline v0.127.0/go.mod h1:TO02zju/K6E+oFIOdi372Wk0MXd+Szy72zcTsFQwXl4=
|
||||
go.opentelemetry.io/collector/processor v1.33.0 h1:oI8gBA/HvGQru/45tUp1kGXz9EzemhGS0ufInPZzQoA=
|
||||
go.opentelemetry.io/collector/processor v1.33.0/go.mod h1:frlKFbtD+VBSK2vqbiDX1qy0bzkfdjpnUEdIl9wCZeA=
|
||||
go.opentelemetry.io/collector/processor/processortest v0.127.0 h1:NKSOBWg5ggJO0km5FJ/UeFU5MORvbqNJEhdT1O74OtA=
|
||||
go.opentelemetry.io/collector/processor/processortest v0.127.0/go.mod h1:6Q0HdaiuakBwfnVjEhf3HtilfIlXRu0DKQGgfv5FasY=
|
||||
go.opentelemetry.io/collector/processor/xprocessor v0.127.0 h1:WEXmmIbh/ifag9yS42CUHHMOwbdGvbr8jr6MLrL2MDU=
|
||||
go.opentelemetry.io/collector/processor/xprocessor v0.127.0/go.mod h1:IHpB7FxRjgzHr3+EwfleRx33iMkkNq5GxzlGaxuRhBY=
|
||||
go.opentelemetry.io/collector/semconv v0.127.0 h1:Mh5VEhH0bXAHQSvjHK31sN0Ct8vSNqaxG7aghQBC8Y8=
|
||||
go.opentelemetry.io/collector/semconv v0.127.0/go.mod h1:OPXer4l43X23cnjLXIZnRj/qQOjSuq4TgBLI76P9hns=
|
||||
go.opentelemetry.io/contrib/bridges/otelzap v0.11.0 h1:u2E32P7j1a/gRgZDWhIXC+Shd4rLg70mnE7QLI/Ssnw=
|
||||
go.opentelemetry.io/contrib/bridges/otelzap v0.11.0/go.mod h1:pJPCLM8gzX4ASqLlyAXjHBEYxgbOQJ/9bidWxD6PEPQ=
|
||||
go.opentelemetry.io/contrib/instrumentation/google.golang.org/grpc/otelgrpc v0.61.0 h1:q4XOmH/0opmeuJtPsbFNivyl7bCt7yRBbeEm2sC/XtQ=
|
||||
go.opentelemetry.io/contrib/instrumentation/google.golang.org/grpc/otelgrpc v0.61.0/go.mod h1:snMWehoOh2wsEwnvvwtDyFCxVeDAODenXHtn5vzrKjo=
|
||||
go.opentelemetry.io/contrib/instrumentation/net/http/httptrace/otelhttptrace v0.61.0 h1:lREC4C0ilyP4WibDhQ7Gg2ygAQFP8oR07Fst/5cafwI=
|
||||
go.opentelemetry.io/contrib/instrumentation/net/http/httptrace/otelhttptrace v0.61.0/go.mod h1:HfvuU0kW9HewH14VCOLImqKvUgONodURG7Alj/IrnGI=
|
||||
go.opentelemetry.io/contrib/instrumentation/net/http/otelhttp v0.61.0 h1:F7Jx+6hwnZ41NSFTO5q4LYDtJRXBf2PD0rNBkeB/lus=
|
||||
go.opentelemetry.io/contrib/instrumentation/net/http/otelhttp v0.61.0/go.mod h1:UHB22Z8QsdRDrnAtX4PntOl36ajSxcdUMt1sF7Y6E7Q=
|
||||
go.opentelemetry.io/otel v1.36.0 h1:UumtzIklRBY6cI/lllNZlALOF5nNIzJVb16APdvgTXg=
|
||||
go.opentelemetry.io/otel v1.36.0/go.mod h1:/TcFMXYjyRNh8khOAO9ybYkqaDBb/70aVwkNML4pP8E=
|
||||
go.opentelemetry.io/otel/log v0.12.2 h1:yob9JVHn2ZY24byZeaXpTVoPS6l+UrrxmxmPKohXTwc=
|
||||
go.opentelemetry.io/otel/log v0.12.2/go.mod h1:ShIItIxSYxufUMt+1H5a2wbckGli3/iCfuEbVZi/98E=
|
||||
go.opentelemetry.io/otel/log/logtest v0.0.0-20250521073539-a85ae98dcedc h1:TU7eU/nib68C+4ZMQ5t4em5Jhf50kRorSCV4w+v65vo=
|
||||
go.opentelemetry.io/otel/log/logtest v0.0.0-20250521073539-a85ae98dcedc/go.mod h1:4AsFc5k1BDLWm5jt0yagrodTEA9xS9McwcnYm+Jf73A=
|
||||
go.opentelemetry.io/otel/metric v1.36.0 h1:MoWPKVhQvJ+eeXWHFBOPoBOi20jh6Iq2CcCREuTYufE=
|
||||
go.opentelemetry.io/otel/metric v1.36.0/go.mod h1:zC7Ks+yeyJt4xig9DEw9kuUFe5C3zLbVjV2PzT6qzbs=
|
||||
go.opentelemetry.io/otel/sdk v1.36.0 h1:b6SYIuLRs88ztox4EyrvRti80uXIFy+Sqzoh9kFULbs=
|
||||
go.opentelemetry.io/otel/sdk v1.36.0/go.mod h1:+lC+mTgD+MUWfjJubi2vvXWcVxyr9rmlshZni72pXeY=
|
||||
go.opentelemetry.io/otel/sdk/metric v1.36.0 h1:r0ntwwGosWGaa0CrSt8cuNuTcccMXERFwHX4dThiPis=
|
||||
go.opentelemetry.io/otel/sdk/metric v1.36.0/go.mod h1:qTNOhFDfKRwX0yXOqJYegL5WRaW376QbB7P4Pb0qva4=
|
||||
go.opentelemetry.io/otel/trace v1.36.0 h1:ahxWNuqZjpdiFAyrIoQ4GIiAIhxAunQR6MUoKrsNd4w=
|
||||
go.opentelemetry.io/otel/trace v1.36.0/go.mod h1:gQ+OnDZzrybY4k4seLzPAWNwVBBVlF2szhehOBB/tGA=
|
||||
go.uber.org/atomic v1.11.0 h1:ZvwS0R+56ePWxUNi+Atn9dWONBPp/AUETXlHW0DxSjE=
|
||||
go.uber.org/atomic v1.11.0/go.mod h1:LUxbIzbOniOlMKjJjyPfpl4v+PKK2cNJn91OQbhoJI0=
|
||||
go.uber.org/goleak v1.3.0 h1:2K3zAYmnTNqV73imy9J1T3WC+gmCePx2hEGkimedGto=
|
||||
@@ -447,10 +447,10 @@ go.uber.org/zap v1.27.0/go.mod h1:GB2qFLM7cTU87MWRP2mPIjqfIDnGu+VIO4V/SdhGo2E=
|
||||
golang.org/x/crypto v0.0.0-20190308221718-c2843e01d9a2/go.mod h1:djNgcEr1/C05ACkg1iLfiJU5Ep61QUkGW8qpdssI0+w=
|
||||
golang.org/x/crypto v0.0.0-20191011191535-87dc89f01550/go.mod h1:yigFU9vqHzYiE8UmvKecakEJjdnWj3jj499lnFckfCI=
|
||||
golang.org/x/crypto v0.0.0-20200622213623-75b288015ac9/go.mod h1:LzIPMQfyMNhhGPhUkYOs5KpL4U8rLKemX1yGLhDgUto=
|
||||
golang.org/x/crypto v0.37.0 h1:kJNSjF/Xp7kU0iB2Z+9viTPMW4EqqsrywMXLJOOsXSE=
|
||||
golang.org/x/crypto v0.37.0/go.mod h1:vg+k43peMZ0pUMhYmVAWysMK35e6ioLh3wB8ZCAfbVc=
|
||||
golang.org/x/exp v0.0.0-20250408133849-7e4ce0ab07d0 h1:R84qjqJb5nVJMxqWYb3np9L5ZsaDtB+a39EqjV0JSUM=
|
||||
golang.org/x/exp v0.0.0-20250408133849-7e4ce0ab07d0/go.mod h1:S9Xr4PYopiDyqSyp5NjCrhFrqg6A5zA2E/iPHPhqnS8=
|
||||
golang.org/x/crypto v0.38.0 h1:jt+WWG8IZlBnVbomuhg2Mdq0+BBQaHbtqHEFEigjUV8=
|
||||
golang.org/x/crypto v0.38.0/go.mod h1:MvrbAqul58NNYPKnOra203SB9vpuZW0e+RRZV+Ggqjw=
|
||||
golang.org/x/exp v0.0.0-20250531010427-b6e5de432a8b h1:QoALfVG9rhQ/M7vYDScfPdWjGL9dlsVVM5VGh7aKoAA=
|
||||
golang.org/x/exp v0.0.0-20250531010427-b6e5de432a8b/go.mod h1:U6Lno4MTRCDY+Ba7aCcauB9T60gsv5s4ralQzP72ZoQ=
|
||||
golang.org/x/mod v0.2.0/go.mod h1:s0Qsj1ACt9ePp/hMypM3fl4fZqREWJwdYDEqhRiZZUA=
|
||||
golang.org/x/mod v0.3.0/go.mod h1:s0Qsj1ACt9ePp/hMypM3fl4fZqREWJwdYDEqhRiZZUA=
|
||||
golang.org/x/mod v0.24.0 h1:ZfthKaKaT4NrhGVZHO1/WDTwGES4De8KtWO0SIbNJMU=
|
||||
@@ -459,51 +459,50 @@ golang.org/x/net v0.0.0-20190404232315-eb5bcb51f2a3/go.mod h1:t9HGtf8HONx5eT2rtn
|
||||
golang.org/x/net v0.0.0-20190620200207-3b0461eec859/go.mod h1:z5CRVTTTmAJ677TzLLGU+0bjPO0LkuOLi4/5GtJWs/s=
|
||||
golang.org/x/net v0.0.0-20200226121028-0de0cce0169b/go.mod h1:z5CRVTTTmAJ677TzLLGU+0bjPO0LkuOLi4/5GtJWs/s=
|
||||
golang.org/x/net v0.0.0-20201021035429-f5854403a974/go.mod h1:sp8m0HH+o8qH0wwXwYZr8TS3Oi6o0r6Gce1SSxlDquU=
|
||||
golang.org/x/net v0.39.0 h1:ZCu7HMWDxpXpaiKdhzIfaltL9Lp31x/3fCP11bc6/fY=
|
||||
golang.org/x/net v0.39.0/go.mod h1:X7NRbYVEA+ewNkCNyJ513WmMdQ3BineSwVtN2zD/d+E=
|
||||
golang.org/x/oauth2 v0.29.0 h1:WdYw2tdTK1S8olAzWHdgeqfy+Mtm9XNhv/xJsY65d98=
|
||||
golang.org/x/oauth2 v0.29.0/go.mod h1:onh5ek6nERTohokkhCD/y2cV4Do3fxFHFuAejCkRWT8=
|
||||
golang.org/x/net v0.40.0 h1:79Xs7wF06Gbdcg4kdCCIQArK11Z1hr5POQ6+fIYHNuY=
|
||||
golang.org/x/net v0.40.0/go.mod h1:y0hY0exeL2Pku80/zKK7tpntoX23cqL3Oa6njdgRtds=
|
||||
golang.org/x/oauth2 v0.30.0 h1:dnDm7JmhM45NNpd8FDDeLhK6FwqbOf4MLCM9zb1BOHI=
|
||||
golang.org/x/oauth2 v0.30.0/go.mod h1:B++QgG3ZKulg6sRPGD/mqlHQs5rB3Ml9erfeDY7xKlU=
|
||||
golang.org/x/sync v0.0.0-20190423024810-112230192c58/go.mod h1:RxMgew5VJxzue5/jJTE5uejpjVlOe/izrB70Jof72aM=
|
||||
golang.org/x/sync v0.0.0-20190911185100-cd5d95a43a6e/go.mod h1:RxMgew5VJxzue5/jJTE5uejpjVlOe/izrB70Jof72aM=
|
||||
golang.org/x/sync v0.0.0-20201020160332-67f06af15bc9/go.mod h1:RxMgew5VJxzue5/jJTE5uejpjVlOe/izrB70Jof72aM=
|
||||
golang.org/x/sync v0.13.0 h1:AauUjRAJ9OSnvULf/ARrrVywoJDy0YS2AwQ98I37610=
|
||||
golang.org/x/sync v0.13.0/go.mod h1:1dzgHSNfp02xaA81J2MS99Qcpr2w7fw1gpm99rleRqA=
|
||||
golang.org/x/sync v0.14.0 h1:woo0S4Yywslg6hp4eUFjTVOyKt0RookbpAHG4c1HmhQ=
|
||||
golang.org/x/sync v0.14.0/go.mod h1:1dzgHSNfp02xaA81J2MS99Qcpr2w7fw1gpm99rleRqA=
|
||||
golang.org/x/sys v0.0.0-20190215142949-d0b11bdaac8a/go.mod h1:STP8DvDyc/dI5b8T5hshtkjS+E42TnysNCUPdjciGhY=
|
||||
golang.org/x/sys v0.0.0-20190412213103-97732733099d/go.mod h1:h1NjWce9XRLGQEsW7wpKNCjG9DtNlClVuFLEZdDNbEs=
|
||||
golang.org/x/sys v0.0.0-20200930185726-fdedc70b468f/go.mod h1:h1NjWce9XRLGQEsW7wpKNCjG9DtNlClVuFLEZdDNbEs=
|
||||
golang.org/x/sys v0.1.0/go.mod h1:oPkhp1MJrh7nUepCBck5+mAzfO9JrbApNNgaTdGDITg=
|
||||
golang.org/x/sys v0.6.0/go.mod h1:oPkhp1MJrh7nUepCBck5+mAzfO9JrbApNNgaTdGDITg=
|
||||
golang.org/x/sys v0.14.0/go.mod h1:/VUhepiaJMQUp4+oa/7Zr1D23ma6VTLIYjOOTFZPUcA=
|
||||
golang.org/x/sys v0.33.0 h1:q3i8TbbEz+JRD9ywIRlyRAQbM0qF7hu24q3teo2hbuw=
|
||||
golang.org/x/sys v0.33.0/go.mod h1:BJP2sWEmIv4KK5OTEluFJCKSidICx8ciO85XgH3Ak8k=
|
||||
golang.org/x/term v0.31.0 h1:erwDkOK1Msy6offm1mOgvspSkslFnIGsFnxOKoufg3o=
|
||||
golang.org/x/term v0.31.0/go.mod h1:R4BeIy7D95HzImkxGkTW1UQTtP54tio2RyHz7PwK0aw=
|
||||
golang.org/x/term v0.32.0 h1:DR4lr0TjUs3epypdhTOkMmuF5CDFJ/8pOnbzMZPQ7bg=
|
||||
golang.org/x/term v0.32.0/go.mod h1:uZG1FhGx848Sqfsq4/DlJr3xGGsYMu/L5GW4abiaEPQ=
|
||||
golang.org/x/text v0.3.0/go.mod h1:NqM8EUOU14njkJ3fqMW+pc6Ldnwhi/IjpwHt7yyuwOQ=
|
||||
golang.org/x/text v0.3.3/go.mod h1:5Zoc/QRtKVWzQhOtBMvqHzDpF6irO9z98xDceosuGiQ=
|
||||
golang.org/x/text v0.24.0 h1:dd5Bzh4yt5KYA8f9CJHCP4FB4D51c2c6JvN37xJJkJ0=
|
||||
golang.org/x/text v0.24.0/go.mod h1:L8rBsPeo2pSS+xqN0d5u2ikmjtmoJbDBT1b7nHvFCdU=
|
||||
golang.org/x/text v0.25.0 h1:qVyWApTSYLk/drJRO5mDlNYskwQznZmkpV2c8q9zls4=
|
||||
golang.org/x/text v0.25.0/go.mod h1:WEdwpYrmk1qmdHvhkSTNPm3app7v4rsT8F2UD6+VHIA=
|
||||
golang.org/x/time v0.11.0 h1:/bpjEDfN9tkoN/ryeYHnv5hcMlc8ncjMcM4XBk5NWV0=
|
||||
golang.org/x/time v0.11.0/go.mod h1:CDIdPxbZBQxdj6cxyCIdrNogrJKMJ7pr37NYpMcMDSg=
|
||||
golang.org/x/tools v0.0.0-20180917221912-90fa682c2a6e/go.mod h1:n7NCudcB/nEzxVGmLbDWY5pfWTLqBcC2KZ6jyYvM4mQ=
|
||||
golang.org/x/tools v0.0.0-20191119224855-298f0cb1881e/go.mod h1:b+2E5dAYhXwXZwtnZ6UAqBI28+e2cm9otk0dWdXHAEo=
|
||||
golang.org/x/tools v0.0.0-20200619180055-7c47624df98f/go.mod h1:EkVYQZoAsY45+roYkvgYkIh4xh/qjgUK9TdY2XT94GE=
|
||||
golang.org/x/tools v0.0.0-20210106214847-113979e3529a/go.mod h1:emZCQorbCU4vsT4fOWvOPXz4eW1wZW4PmDk9uLelYpA=
|
||||
golang.org/x/tools v0.32.0 h1:Q7N1vhpkQv7ybVzLFtTjvQya2ewbwNDZzUgfXGqtMWU=
|
||||
golang.org/x/tools v0.32.0/go.mod h1:ZxrU41P/wAbZD8EDa6dDCa6XfpkhJ7HFMjHJXfBDu8s=
|
||||
golang.org/x/tools v0.33.0 h1:4qz2S3zmRxbGIhDIAgjxvFutSvH5EfnsYrRBj0UI0bc=
|
||||
golang.org/x/tools v0.33.0/go.mod h1:CIJMaWEY88juyUfo7UbgPqbC8rU2OqfAV1h2Qp0oMYI=
|
||||
golang.org/x/xerrors v0.0.0-20190717185122-a985d3407aa7/go.mod h1:I/5z698sn9Ka8TeJc9MKroUUfqBBauWjQqLJ2OPfmY0=
|
||||
golang.org/x/xerrors v0.0.0-20191011141410-1b5146add898/go.mod h1:I/5z698sn9Ka8TeJc9MKroUUfqBBauWjQqLJ2OPfmY0=
|
||||
golang.org/x/xerrors v0.0.0-20191204190536-9bdfabe68543/go.mod h1:I/5z698sn9Ka8TeJc9MKroUUfqBBauWjQqLJ2OPfmY0=
|
||||
golang.org/x/xerrors v0.0.0-20200804184101-5ec99f83aff1/go.mod h1:I/5z698sn9Ka8TeJc9MKroUUfqBBauWjQqLJ2OPfmY0=
|
||||
google.golang.org/api v0.231.0 h1:LbUD5FUl0C4qwia2bjXhCMH65yz1MLPzA/0OYEsYY7Q=
|
||||
google.golang.org/api v0.231.0/go.mod h1:H52180fPI/QQlUc0F4xWfGZILdv09GCWKt2bcsn164A=
|
||||
google.golang.org/genproto v0.0.0-20250428153025-10db94c68c34 h1:oklGWmm0ZiCw4efmdYZo5MF9t6nRvGzM5+0klSjOmGM=
|
||||
google.golang.org/genproto v0.0.0-20250428153025-10db94c68c34/go.mod h1:hiH/EqX5GBdTyIpkqMqDGUHDiBniln8b4FCw+NzPxQY=
|
||||
google.golang.org/genproto/googleapis/api v0.0.0-20250428153025-10db94c68c34 h1:0PeQib/pH3nB/5pEmFeVQJotzGohV0dq4Vcp09H5yhE=
|
||||
google.golang.org/genproto/googleapis/api v0.0.0-20250428153025-10db94c68c34/go.mod h1:0awUlEkap+Pb1UMeJwJQQAdJQrt3moU7J2moTy69irI=
|
||||
google.golang.org/genproto/googleapis/rpc v0.0.0-20250428153025-10db94c68c34 h1:h6p3mQqrmT1XkHVTfzLdNz1u7IhINeZkz67/xTbOuWs=
|
||||
google.golang.org/genproto/googleapis/rpc v0.0.0-20250428153025-10db94c68c34/go.mod h1:qQ0YXyHHx3XkvlzUtpXDkS29lDSafHMZBAZDc03LQ3A=
|
||||
google.golang.org/grpc v1.72.0 h1:S7UkcVa60b5AAQTaO6ZKamFp1zMZSU0fGDK2WZLbBnM=
|
||||
google.golang.org/grpc v1.72.0/go.mod h1:wH5Aktxcg25y1I3w7H69nHfXdOG3UiadoBtjh3izSDM=
|
||||
google.golang.org/api v0.235.0 h1:C3MkpQSRxS1Jy6AkzTGKKrpSCOd2WOGrezZ+icKSkKo=
|
||||
google.golang.org/api v0.235.0/go.mod h1:QpeJkemzkFKe5VCE/PMv7GsUfn9ZF+u+q1Q7w6ckxTg=
|
||||
google.golang.org/genproto v0.0.0-20250528174236-200df99c418a h1:KXuwdBmgjb4T3l4ZzXhP6HxxFKXD9FcK5/8qfJI4WwU=
|
||||
google.golang.org/genproto v0.0.0-20250528174236-200df99c418a/go.mod h1:Nlk93rrS2X7rV8hiC2gh2A/AJspZhElz9Oh2KGsjLEY=
|
||||
google.golang.org/genproto/googleapis/api v0.0.0-20250528174236-200df99c418a h1:SGktgSolFCo75dnHJF2yMvnns6jCmHFJ0vE4Vn2JKvQ=
|
||||
google.golang.org/genproto/googleapis/api v0.0.0-20250528174236-200df99c418a/go.mod h1:a77HrdMjoeKbnd2jmgcWdaS++ZLZAEq3orIOAEIKiVw=
|
||||
google.golang.org/genproto/googleapis/rpc v0.0.0-20250528174236-200df99c418a h1:v2PbRU4K3llS09c7zodFpNePeamkAwG3mPrAery9VeE=
|
||||
google.golang.org/genproto/googleapis/rpc v0.0.0-20250528174236-200df99c418a/go.mod h1:qQ0YXyHHx3XkvlzUtpXDkS29lDSafHMZBAZDc03LQ3A=
|
||||
google.golang.org/grpc v1.72.2 h1:TdbGzwb82ty4OusHWepvFWGLgIbNo1/SUynEN0ssqv8=
|
||||
google.golang.org/grpc v1.72.2/go.mod h1:wH5Aktxcg25y1I3w7H69nHfXdOG3UiadoBtjh3izSDM=
|
||||
google.golang.org/protobuf v1.36.6 h1:z1NpPI8ku2WgiWnf+t9wTPsn6eP1L7ksHUlkfLvd9xY=
|
||||
google.golang.org/protobuf v1.36.6/go.mod h1:jduwjTPXsFjZGTmRluh+L6NjiWu7pchiJ2/5YcXBHnY=
|
||||
gopkg.in/check.v1 v0.0.0-20161208181325-20d25e280405/go.mod h1:Co6ibVJAznAaIkqp8huTwlJQCZ016jof/cbN4VW5Yz0=
|
||||
@@ -515,24 +514,23 @@ gopkg.in/inf.v0 v0.9.1 h1:73M5CoZyi3ZLMOyDlQh031Cx6N9NDJ2Vvfl76EDAgDc=
|
||||
gopkg.in/inf.v0 v0.9.1/go.mod h1:cWUDdTG/fYaXco+Dcufb5Vnc6Gp2YChqWtbxRZE0mXw=
|
||||
gopkg.in/ini.v1 v1.67.0 h1:Dgnx+6+nfE+IfzjUEISNeydPJh9AXNNsWbGP9KzCsOA=
|
||||
gopkg.in/ini.v1 v1.67.0/go.mod h1:pNLf8WUiyNEtQjuu5G5vTm06TEv9tsIgeAvK8hOrP4k=
|
||||
gopkg.in/yaml.v2 v2.2.8/go.mod h1:hI93XBmqTisBFMUTm0b8Fm+jr3Dg1NNxqwp+5A1VGuI=
|
||||
gopkg.in/yaml.v2 v2.4.0 h1:D8xgwECY7CYvx+Y2n4sBz93Jn9JRvxdiyyo8CTfuKaY=
|
||||
gopkg.in/yaml.v2 v2.4.0/go.mod h1:RDklbk79AGWmwhnvt/jBztapEOGDOx6ZbXqjP6csGnQ=
|
||||
gopkg.in/yaml.v3 v3.0.0-20200313102051-9f266ea9e77c/go.mod h1:K4uyk7z7BCEPqu6E+C64Yfv1cQ7kz7rIZviUmN+EgEM=
|
||||
gopkg.in/yaml.v3 v3.0.1 h1:fxVm/GzAzEWqLHuvctI91KS9hhNmmWOoWu0XTYJS7CA=
|
||||
gopkg.in/yaml.v3 v3.0.1/go.mod h1:K4uyk7z7BCEPqu6E+C64Yfv1cQ7kz7rIZviUmN+EgEM=
|
||||
k8s.io/api v0.33.0 h1:yTgZVn1XEe6opVpP1FylmNrIFWuDqe2H0V8CT5gxfIU=
|
||||
k8s.io/api v0.33.0/go.mod h1:CTO61ECK/KU7haa3qq8sarQ0biLq2ju405IZAd9zsiM=
|
||||
k8s.io/apimachinery v0.33.0 h1:1a6kHrJxb2hs4t8EE5wuR/WxKDwGN1FKH3JvDtA0CIQ=
|
||||
k8s.io/apimachinery v0.33.0/go.mod h1:BHW0YOu7n22fFv/JkYOEfkUYNRN0fj0BlvMFWA7b+SM=
|
||||
k8s.io/client-go v0.33.0 h1:UASR0sAYVUzs2kYuKn/ZakZlcs2bEHaizrrHUZg0G98=
|
||||
k8s.io/client-go v0.33.0/go.mod h1:kGkd+l/gNGg8GYWAPr0xF1rRKvVWvzh9vmZAMXtaKOg=
|
||||
k8s.io/api v0.33.1 h1:tA6Cf3bHnLIrUK4IqEgb2v++/GYUtqiu9sRVk3iBXyw=
|
||||
k8s.io/api v0.33.1/go.mod h1:87esjTn9DRSRTD4fWMXamiXxJhpOIREjWOSjsW1kEHw=
|
||||
k8s.io/apimachinery v0.33.1 h1:mzqXWV8tW9Rw4VeW9rEkqvnxj59k1ezDUl20tFK/oM4=
|
||||
k8s.io/apimachinery v0.33.1/go.mod h1:BHW0YOu7n22fFv/JkYOEfkUYNRN0fj0BlvMFWA7b+SM=
|
||||
k8s.io/client-go v0.33.1 h1:ZZV/Ks2g92cyxWkRRnfUDsnhNn28eFpt26aGc8KbXF4=
|
||||
k8s.io/client-go v0.33.1/go.mod h1:JAsUrl1ArO7uRVFWfcj6kOomSlCv+JpvIsp6usAGefA=
|
||||
k8s.io/klog/v2 v2.130.1 h1:n9Xl7H1Xvksem4KFG4PYbdQCQxqc/tTUyrgXaOhHSzk=
|
||||
k8s.io/klog/v2 v2.130.1/go.mod h1:3Jpz1GvMt720eyJH1ckRHK1EDfpxISzJ7I9OYgaDtPE=
|
||||
k8s.io/kube-openapi v0.0.0-20250318190949-c8a335a9a2ff h1:/usPimJzUKKu+m+TE36gUyGcf03XZEP0ZIKgKj35LS4=
|
||||
k8s.io/kube-openapi v0.0.0-20250318190949-c8a335a9a2ff/go.mod h1:5jIi+8yX4RIb8wk3XwBo5Pq2ccx4FP10ohkbSKCZoK8=
|
||||
k8s.io/utils v0.0.0-20250321185631-1f6e0b77f77e h1:KqK5c/ghOm8xkHYhlodbp6i6+r+ChV2vuAuVRdFbLro=
|
||||
k8s.io/utils v0.0.0-20250321185631-1f6e0b77f77e/go.mod h1:OLgZIPagt7ERELqWJFomSt595RzquPNLL48iOWgYOg0=
|
||||
k8s.io/utils v0.0.0-20250502105355-0f33e8f1c979 h1:jgJW5IePPXLGB8e/1wvd0Ich9QE97RvvF3a8J3fP/Lg=
|
||||
k8s.io/utils v0.0.0-20250502105355-0f33e8f1c979/go.mod h1:OLgZIPagt7ERELqWJFomSt595RzquPNLL48iOWgYOg0=
|
||||
sigs.k8s.io/json v0.0.0-20241010143419-9aa6b5e7a4b3 h1:/Rv+M11QRah1itp8VhT6HoVx1Ray9eB4DBr+K+/sCJ8=
|
||||
sigs.k8s.io/json v0.0.0-20241010143419-9aa6b5e7a4b3/go.mod h1:18nIHnGi6636UCz6m8i4DhaJ65T6EruyzmoQqI2BVDo=
|
||||
sigs.k8s.io/randfill v1.0.0 h1:JfjMILfT8A6RbawdsK2JXGBR5AQVfd+9TbzrlneTyrU=
|
||||
|
||||
10
lib/atomicutil/cacheline.go
Normal file
10
lib/atomicutil/cacheline.go
Normal file
@@ -0,0 +1,10 @@
|
||||
package atomicutil
|
||||
|
||||
import (
|
||||
"unsafe"
|
||||
|
||||
"golang.org/x/sys/cpu"
|
||||
)
|
||||
|
||||
// CacheLineSize is the size of a CPU cache line
|
||||
const CacheLineSize = unsafe.Sizeof(cpu.CacheLinePad{})
|
||||
@@ -19,8 +19,8 @@ type Slice[T any] struct {
|
||||
type itemPadded[T any] struct {
|
||||
x T
|
||||
|
||||
// The padding prevents false sharing on widespread platforms with cache line size >= 128.
|
||||
_ [128]byte
|
||||
// The padding prevents false sharing
|
||||
_ [CacheLineSize]byte
|
||||
}
|
||||
|
||||
// Get returns *T item for the given workerID in a goroutine-safe manner.
|
||||
|
||||
17
lib/atomicutil/uint64.go
Normal file
17
lib/atomicutil/uint64.go
Normal file
@@ -0,0 +1,17 @@
|
||||
package atomicutil
|
||||
|
||||
import (
|
||||
"sync/atomic"
|
||||
"unsafe"
|
||||
)
|
||||
|
||||
// Uint64 is like atomic.Uint64, but is protected from false sharing.
|
||||
type Uint64 struct {
|
||||
// The padding prevents false sharing with the previous memory location
|
||||
_ [CacheLineSize - unsafe.Sizeof(atomic.Uint64{})%CacheLineSize]byte
|
||||
|
||||
atomic.Uint64
|
||||
|
||||
// The padding prevents false sharing with the next memory location
|
||||
_ [CacheLineSize - unsafe.Sizeof(atomic.Uint64{})%CacheLineSize]byte
|
||||
}
|
||||
@@ -14,9 +14,12 @@ import (
|
||||
"github.com/VictoriaMetrics/VictoriaMetrics/lib/backup/fsremote"
|
||||
"github.com/VictoriaMetrics/VictoriaMetrics/lib/backup/gcsremote"
|
||||
"github.com/VictoriaMetrics/VictoriaMetrics/lib/backup/s3remote"
|
||||
"github.com/VictoriaMetrics/VictoriaMetrics/lib/flagutil"
|
||||
)
|
||||
|
||||
var (
|
||||
objectMetadata = flag.String("objectMetadata", "", `Metadata to be set for uploaded objects to object storage. Must be set in JSON format: {"param1":"value1",...,"paramN":"valueN"}. Is ignored for local filesystem.`)
|
||||
|
||||
credsFilePath = flag.String("credsFilePath", "", "Path to file with GCS or S3 credentials. Credentials are loaded from default locations if not set.\n"+
|
||||
"See https://cloud.google.com/iam/docs/creating-managing-service-account-keys and https://docs.aws.amazon.com/general/latest/gr/aws-security-credentials.html")
|
||||
configFilePath = flag.String("configFilePath", "", "Path to file with S3 configs. Configs are loaded from default location if not set.\n"+
|
||||
@@ -29,6 +32,7 @@ var (
|
||||
"DEEP_ARCHIVE, GLACIER_IR, INTELLIGENT_TIERING, ONEZONE_IA, OUTPOSTS, REDUCED_REDUNDANCY, STANDARD, STANDARD_IA.\n"+
|
||||
"See https://docs.aws.amazon.com/AmazonS3/latest/userguide/storage-class-intro.html")
|
||||
s3TLSInsecureSkipVerify = flag.Bool("s3TLSInsecureSkipVerify", false, "Whether to skip TLS verification when connecting to the S3 endpoint.")
|
||||
s3Tags = flag.String("s3ObjectTags", "", `S3 tags to be set for uploaded objects. Must be set in JSON format: {"param1":"value1",...,"paramN":"valueN"}.`)
|
||||
)
|
||||
|
||||
func runParallel(concurrency int, parts []common.Part, f func(p common.Part) error, progress func(elapsed time.Duration)) error {
|
||||
@@ -186,6 +190,10 @@ func getPartsSize(parts []common.Part) uint64 {
|
||||
|
||||
// NewRemoteFS returns new remote fs from the given path.
|
||||
func NewRemoteFS(ctx context.Context, path string) (common.RemoteFS, error) {
|
||||
m, err := flagutil.ParseJSONMap(*objectMetadata)
|
||||
if err != nil {
|
||||
return nil, fmt.Errorf("cannot parse s3 objectMetadata %q: %w", *objectMetadata, err)
|
||||
}
|
||||
if len(path) == 0 {
|
||||
return nil, fmt.Errorf("path cannot be empty")
|
||||
}
|
||||
@@ -215,6 +223,7 @@ func NewRemoteFS(ctx context.Context, path string) (common.RemoteFS, error) {
|
||||
CredsFilePath: *credsFilePath,
|
||||
Bucket: bucket,
|
||||
Dir: dir,
|
||||
Metadata: m,
|
||||
}
|
||||
if err := fs.Init(ctx); err != nil {
|
||||
return nil, fmt.Errorf("cannot initialize connection to gcs: %w", err)
|
||||
@@ -230,6 +239,7 @@ func NewRemoteFS(ctx context.Context, path string) (common.RemoteFS, error) {
|
||||
fs := &azremote.FS{
|
||||
Container: bucket,
|
||||
Dir: dir,
|
||||
Metadata: m,
|
||||
}
|
||||
if err := fs.Init(ctx); err != nil {
|
||||
return nil, fmt.Errorf("cannot initialize connection to AZBlob: %w", err)
|
||||
@@ -242,6 +252,11 @@ func NewRemoteFS(ctx context.Context, path string) (common.RemoteFS, error) {
|
||||
}
|
||||
bucket := dir[:n]
|
||||
dir = dir[n:]
|
||||
tags, err := flagutil.ParseJSONMap(*s3Tags)
|
||||
if err != nil {
|
||||
return nil, fmt.Errorf("cannot parse s3 tags %q: %w", *s3Tags, err)
|
||||
}
|
||||
|
||||
fs := &s3remote.FS{
|
||||
CredsFilePath: *credsFilePath,
|
||||
ConfigFilePath: *configFilePath,
|
||||
@@ -252,6 +267,8 @@ func NewRemoteFS(ctx context.Context, path string) (common.RemoteFS, error) {
|
||||
ProfileName: *configProfile,
|
||||
Bucket: bucket,
|
||||
Dir: dir,
|
||||
Metadata: m,
|
||||
Tags: tags,
|
||||
}
|
||||
if err := fs.Init(ctx); err != nil {
|
||||
return nil, fmt.Errorf("cannot initialize connection to s3: %w", err)
|
||||
|
||||
@@ -34,6 +34,12 @@ type FS struct {
|
||||
// Directory in the bucket to write to.
|
||||
Dir string
|
||||
|
||||
// Metadata to be set for uploaded objects.
|
||||
Metadata map[string]string
|
||||
|
||||
// Metadata converted to representation required by azure sdk.
|
||||
metadata map[string]*string
|
||||
|
||||
client *container.Client
|
||||
|
||||
ctx context.Context
|
||||
@@ -63,6 +69,12 @@ func (fs *FS) Init(ctx context.Context) error {
|
||||
containerClient := sc.NewContainerClient(fs.Container)
|
||||
fs.client = containerClient
|
||||
|
||||
meta := make(map[string]*string, len(fs.Metadata))
|
||||
for k, v := range fs.Metadata {
|
||||
meta[k] = &v
|
||||
}
|
||||
fs.metadata = meta
|
||||
|
||||
return nil
|
||||
}
|
||||
|
||||
@@ -249,6 +261,9 @@ func (fs *FS) CopyPart(srcFS common.OriginFS, p common.Part) error {
|
||||
// Continue checking
|
||||
}
|
||||
}
|
||||
if err := fs.maybeSetMetadata(dbc); err != nil {
|
||||
return fmt.Errorf("cannot set metadata for %q at %s: %w", p.Path, fs, err)
|
||||
}
|
||||
|
||||
if *copyStatus != blob.CopyStatusTypeSuccess {
|
||||
return fmt.Errorf("copy of %q from %s to %s failed: expected status %q, received %q (description: %q)", p.Path, src, fs, blob.CopyStatusTypeSuccess, *copyStatus, *copyStatusDescription)
|
||||
@@ -288,7 +303,9 @@ func (fs *FS) UploadPart(p common.Part, r io.Reader) error {
|
||||
if err != nil {
|
||||
return fmt.Errorf("cannot upload data to %q at %s (remote path %q): %w", p.Path, fs, bc.URL(), err)
|
||||
}
|
||||
|
||||
if err := fs.maybeSetMetadata(bc); err != nil {
|
||||
return fmt.Errorf("cannot set metadata for %q at %s: %w", p.Path, fs, err)
|
||||
}
|
||||
return nil
|
||||
}
|
||||
|
||||
@@ -383,6 +400,9 @@ func (fs *FS) CreateFile(filePath string, data []byte) error {
|
||||
if err != nil {
|
||||
return fmt.Errorf("cannot upload %d bytes to %q at %s (remote path %q): %w", len(data), filePath, fs, bc.URL(), err)
|
||||
}
|
||||
if err := fs.maybeSetMetadata(bc); err != nil {
|
||||
return fmt.Errorf("cannot set metadata for %q at %s: %w", path, fs, err)
|
||||
}
|
||||
|
||||
return nil
|
||||
}
|
||||
@@ -434,3 +454,15 @@ func cleanDirectory(dir string) string {
|
||||
|
||||
return dir
|
||||
}
|
||||
|
||||
// maybeSetMetadata sets metadata for the blob if metadata is not empty.
|
||||
func (fs *FS) maybeSetMetadata(bc *blockblob.Client) error {
|
||||
if len(fs.metadata) == 0 {
|
||||
return nil
|
||||
}
|
||||
_, err := bc.SetMetadata(fs.ctx, fs.metadata, &blob.SetMetadataOptions{})
|
||||
if err != nil {
|
||||
return fmt.Errorf("cannot set metadata for %q at %s: %w", bc.URL(), fs, err)
|
||||
}
|
||||
return nil
|
||||
}
|
||||
|
||||
@@ -34,6 +34,9 @@ type FS struct {
|
||||
// Directory in the bucket to write to.
|
||||
Dir string
|
||||
|
||||
// Metadata to be set for uploaded objects.
|
||||
Metadata map[string]string
|
||||
|
||||
bkt *storage.BucketHandle
|
||||
|
||||
ctx context.Context
|
||||
@@ -161,6 +164,9 @@ func (fs *FS) CopyPart(srcFS common.OriginFS, p common.Part) error {
|
||||
dstObj := fs.object(p)
|
||||
|
||||
copier := dstObj.CopierFrom(srcObj)
|
||||
if len(fs.Metadata) > 0 {
|
||||
copier.Metadata = fs.Metadata
|
||||
}
|
||||
attr, err := copier.Run(fs.ctx)
|
||||
if err != nil {
|
||||
return fmt.Errorf("cannot copy %q from %s to %s: %w", p.Path, src, fs, err)
|
||||
@@ -195,6 +201,9 @@ func (fs *FS) DownloadPart(p common.Part, w io.Writer) error {
|
||||
func (fs *FS) UploadPart(p common.Part, r io.Reader) error {
|
||||
o := fs.object(p)
|
||||
w := o.NewWriter(fs.ctx)
|
||||
if len(fs.Metadata) > 0 {
|
||||
w.Metadata = fs.Metadata
|
||||
}
|
||||
n, err := io.Copy(w, r)
|
||||
if err1 := w.Close(); err1 != nil && err == nil {
|
||||
err = err1
|
||||
@@ -272,6 +281,9 @@ func (fs *FS) CreateFile(filePath string, data []byte) error {
|
||||
path := path.Join(fs.Dir, filePath)
|
||||
o := fs.bkt.Object(path)
|
||||
w := o.NewWriter(fs.ctx)
|
||||
if len(fs.Metadata) > 0 {
|
||||
w.Metadata = fs.Metadata
|
||||
}
|
||||
n, err := w.Write(data)
|
||||
if err != nil {
|
||||
_ = w.Close()
|
||||
|
||||
@@ -8,6 +8,7 @@ import (
|
||||
"io"
|
||||
"net/http"
|
||||
"path"
|
||||
"sort"
|
||||
"strings"
|
||||
"time"
|
||||
|
||||
@@ -85,6 +86,18 @@ type FS struct {
|
||||
|
||||
ctx context.Context
|
||||
cancel context.CancelFunc
|
||||
|
||||
// Metadata to be set for uploaded objects.
|
||||
Metadata map[string]string
|
||||
|
||||
// S3 tags to be set for uploaded objects.
|
||||
Tags map[string]string
|
||||
|
||||
// parsed Metadata to be used with aws-sdk-go-v2
|
||||
metadata map[string]*string
|
||||
|
||||
// parsed Tags to be used with aws-sdk-go-v2
|
||||
tags *string
|
||||
}
|
||||
|
||||
// Init initializes fs.
|
||||
@@ -178,6 +191,23 @@ func (fs *FS) Init(ctx context.Context) error {
|
||||
// We manage upload concurrency by ourselves.
|
||||
u.Concurrency = 1
|
||||
})
|
||||
|
||||
m := make(map[string]*string)
|
||||
for k, v := range fs.Metadata {
|
||||
m[k] = &v
|
||||
}
|
||||
fs.metadata = m
|
||||
|
||||
if len(fs.Tags) > 0 {
|
||||
tags := make([]string, 0, len(fs.Tags))
|
||||
for k, v := range fs.Tags {
|
||||
tags = append(tags, fmt.Sprintf("%s=%s", k, v))
|
||||
}
|
||||
sort.Strings(tags)
|
||||
tagsString := strings.Join(tags, "&")
|
||||
fs.tags = &tagsString
|
||||
}
|
||||
|
||||
return nil
|
||||
}
|
||||
|
||||
@@ -258,10 +288,13 @@ func (fs *FS) CopyPart(srcFS common.OriginFS, p common.Part) error {
|
||||
copySource := fmt.Sprintf("/%s/%s", src.Bucket, srcPath)
|
||||
|
||||
input := &s3.CopyObjectInput{
|
||||
Bucket: aws.String(fs.Bucket),
|
||||
CopySource: aws.String(copySource),
|
||||
Key: aws.String(dstPath),
|
||||
StorageClass: fs.StorageClass,
|
||||
Bucket: aws.String(fs.Bucket),
|
||||
CopySource: aws.String(copySource),
|
||||
Key: aws.String(dstPath),
|
||||
StorageClass: fs.StorageClass,
|
||||
Metadata: fs.Metadata,
|
||||
MetadataDirective: s3types.MetadataDirectiveReplace,
|
||||
Tagging: fs.tags,
|
||||
}
|
||||
|
||||
_, err := fs.s3.CopyObject(fs.ctx, input)
|
||||
@@ -307,6 +340,8 @@ func (fs *FS) UploadPart(p common.Part, r io.Reader) error {
|
||||
Key: aws.String(path),
|
||||
Body: sr,
|
||||
StorageClass: fs.StorageClass,
|
||||
Metadata: fs.Metadata,
|
||||
Tagging: fs.tags,
|
||||
}
|
||||
|
||||
_, err := fs.uploader.Upload(fs.ctx, input)
|
||||
@@ -397,6 +432,8 @@ func (fs *FS) CreateFile(filePath string, data []byte) error {
|
||||
Key: aws.String(path),
|
||||
Body: sr,
|
||||
StorageClass: fs.StorageClass,
|
||||
Metadata: fs.Metadata,
|
||||
Tagging: fs.tags,
|
||||
}
|
||||
_, err := fs.uploader.Upload(fs.ctx, input)
|
||||
if err != nil {
|
||||
|
||||
@@ -1,9 +1,10 @@
|
||||
package fasttime
|
||||
|
||||
import (
|
||||
"sync/atomic"
|
||||
"testing"
|
||||
"time"
|
||||
|
||||
"github.com/VictoriaMetrics/VictoriaMetrics/lib/atomicutil"
|
||||
)
|
||||
|
||||
func init() {
|
||||
@@ -17,8 +18,8 @@ func init() {
|
||||
}()
|
||||
}
|
||||
|
||||
var currentTimestamp = func() *atomic.Uint64 {
|
||||
var x atomic.Uint64
|
||||
var currentTimestamp = func() *atomicutil.Uint64 {
|
||||
var x atomicutil.Uint64
|
||||
x.Store(uint64(time.Now().Unix()))
|
||||
return &x
|
||||
}()
|
||||
|
||||
@@ -1,6 +1,7 @@
|
||||
package flagutil
|
||||
|
||||
import (
|
||||
"encoding/json"
|
||||
"flag"
|
||||
"fmt"
|
||||
"strconv"
|
||||
@@ -32,6 +33,25 @@ type RetentionDuration struct {
|
||||
valueString string
|
||||
}
|
||||
|
||||
var (
|
||||
_ json.Marshaler = (*RetentionDuration)(nil)
|
||||
_ json.Unmarshaler = (*RetentionDuration)(nil)
|
||||
)
|
||||
|
||||
// MarshalJSON implements json.Marshaler interface
|
||||
func (d *RetentionDuration) MarshalJSON() ([]byte, error) {
|
||||
return json.Marshal(d.valueString)
|
||||
}
|
||||
|
||||
// UnmarshalJSON implements json.Unmarshaler interface
|
||||
func (d *RetentionDuration) UnmarshalJSON(data []byte) error {
|
||||
var s string
|
||||
if err := json.Unmarshal(data, &s); err != nil {
|
||||
return err
|
||||
}
|
||||
return d.Set(s)
|
||||
}
|
||||
|
||||
// Duration returns d as time.Duration
|
||||
func (d *RetentionDuration) Duration() time.Duration {
|
||||
return time.Millisecond * time.Duration(d.msecs)
|
||||
|
||||
@@ -8,15 +8,15 @@ import (
|
||||
"regexp"
|
||||
"strings"
|
||||
"sync"
|
||||
"sync/atomic"
|
||||
"time"
|
||||
|
||||
"github.com/VictoriaMetrics/VictoriaMetrics/lib/atomicutil"
|
||||
"github.com/VictoriaMetrics/VictoriaMetrics/lib/fasttime"
|
||||
"github.com/VictoriaMetrics/VictoriaMetrics/lib/filestream"
|
||||
"github.com/VictoriaMetrics/VictoriaMetrics/lib/logger"
|
||||
)
|
||||
|
||||
var tmpFileNum atomic.Uint64
|
||||
var tmpFileNum atomicutil.Uint64
|
||||
|
||||
// MustSyncPath syncs contents of the given path.
|
||||
func MustSyncPath(path string) {
|
||||
@@ -224,8 +224,8 @@ func MustRemoveDirAtomic(dir string) {
|
||||
MustSyncPath(parentDir)
|
||||
}
|
||||
|
||||
var atomicDirRemoveCounter = func() *atomic.Uint64 {
|
||||
var x atomic.Uint64
|
||||
var atomicDirRemoveCounter = func() *atomicutil.Uint64 {
|
||||
var x atomicutil.Uint64
|
||||
x.Store(uint64(time.Now().UnixNano()))
|
||||
return &x
|
||||
}()
|
||||
|
||||
@@ -2,7 +2,7 @@ package logstorage
|
||||
|
||||
import (
|
||||
"math"
|
||||
"slices"
|
||||
"sort"
|
||||
"strconv"
|
||||
"strings"
|
||||
"sync"
|
||||
@@ -15,6 +15,7 @@ import (
|
||||
"github.com/VictoriaMetrics/VictoriaMetrics/lib/encoding"
|
||||
"github.com/VictoriaMetrics/VictoriaMetrics/lib/fastnum"
|
||||
"github.com/VictoriaMetrics/VictoriaMetrics/lib/logger"
|
||||
"github.com/VictoriaMetrics/VictoriaMetrics/lib/prefixfilter"
|
||||
"github.com/VictoriaMetrics/VictoriaMetrics/lib/slicesutil"
|
||||
)
|
||||
|
||||
@@ -300,20 +301,56 @@ func (br *blockResult) addResultColumnConst(rc resultColumn) {
|
||||
})
|
||||
}
|
||||
|
||||
// initAllColumns initializes all the columns in br except of unneededColumnNames.
|
||||
func (br *blockResult) initAllColumns(unneededColumnNames []string) {
|
||||
if !slices.Contains(unneededColumnNames, "_time") {
|
||||
// Add _time column
|
||||
// initColumns initializes columns in br according to pf.
|
||||
func (br *blockResult) initColumns(pf *prefixfilter.Filter) {
|
||||
fields, ok := pf.GetAllowStrings()
|
||||
if ok {
|
||||
// Fast path
|
||||
br.initColumnsByFields(fields)
|
||||
} else {
|
||||
// Slow path
|
||||
br.initColumnsByFilter(pf)
|
||||
}
|
||||
|
||||
br.csInitFast()
|
||||
}
|
||||
|
||||
func (br *blockResult) initColumnsByFields(fields []string) {
|
||||
for _, f := range fields {
|
||||
switch f {
|
||||
case "_time":
|
||||
br.addTimeColumn()
|
||||
case "_stream_id":
|
||||
br.addStreamIDColumn()
|
||||
case "_stream":
|
||||
if !br.addStreamColumn() {
|
||||
// Skip the current block, since the associated stream tags are missing
|
||||
br.reset()
|
||||
return
|
||||
}
|
||||
default:
|
||||
v := br.bs.getConstColumnValue(f)
|
||||
if v != "" {
|
||||
br.addConstColumn(f, v)
|
||||
} else if ch := br.bs.getColumnHeader(f); ch != nil {
|
||||
br.addColumn(ch)
|
||||
} else {
|
||||
br.addConstColumn(f, "")
|
||||
}
|
||||
}
|
||||
}
|
||||
}
|
||||
|
||||
func (br *blockResult) initColumnsByFilter(pf *prefixfilter.Filter) {
|
||||
if pf.MatchString("_time") {
|
||||
br.addTimeColumn()
|
||||
}
|
||||
|
||||
if !slices.Contains(unneededColumnNames, "_stream_id") {
|
||||
// Add _stream_id column
|
||||
if pf.MatchString("_stream_id") {
|
||||
br.addStreamIDColumn()
|
||||
}
|
||||
|
||||
if !slices.Contains(unneededColumnNames, "_stream") {
|
||||
// Add _stream column
|
||||
if pf.MatchString("_stream") {
|
||||
if !br.addStreamColumn() {
|
||||
// Skip the current block, since the associated stream tags are missing
|
||||
br.reset()
|
||||
@@ -321,7 +358,7 @@ func (br *blockResult) initAllColumns(unneededColumnNames []string) {
|
||||
}
|
||||
}
|
||||
|
||||
if !slices.Contains(unneededColumnNames, "_msg") {
|
||||
if pf.MatchString("_msg") {
|
||||
// Add _msg column
|
||||
v := br.bs.getConstColumnValue("_msg")
|
||||
if v != "" {
|
||||
@@ -337,9 +374,10 @@ func (br *blockResult) initAllColumns(unneededColumnNames []string) {
|
||||
csh := br.bs.getColumnsHeader()
|
||||
for _, cc := range csh.constColumns {
|
||||
if cc.Name == "" {
|
||||
// We already added _msg column above
|
||||
continue
|
||||
}
|
||||
if !slices.Contains(unneededColumnNames, cc.Name) {
|
||||
if pf.MatchString(cc.Name) {
|
||||
br.addConstColumn(cc.Name, cc.Value)
|
||||
}
|
||||
}
|
||||
@@ -349,43 +387,13 @@ func (br *blockResult) initAllColumns(unneededColumnNames []string) {
|
||||
for i := range chs {
|
||||
ch := &chs[i]
|
||||
if ch.name == "" {
|
||||
// We already added _msg column above
|
||||
continue
|
||||
}
|
||||
if !slices.Contains(unneededColumnNames, ch.name) {
|
||||
if pf.MatchString(ch.name) {
|
||||
br.addColumn(ch)
|
||||
}
|
||||
}
|
||||
|
||||
br.csInitFast()
|
||||
}
|
||||
|
||||
// initRequestedColumns initializes neededColumnNames at br.
|
||||
func (br *blockResult) initRequestedColumns(neededColumnNames []string) {
|
||||
for _, columnName := range neededColumnNames {
|
||||
switch columnName {
|
||||
case "_stream_id":
|
||||
br.addStreamIDColumn()
|
||||
case "_stream":
|
||||
if !br.addStreamColumn() {
|
||||
// Skip the current block, since the associated stream tags are missing.
|
||||
br.reset()
|
||||
return
|
||||
}
|
||||
case "_time":
|
||||
br.addTimeColumn()
|
||||
default:
|
||||
v := br.bs.getConstColumnValue(columnName)
|
||||
if v != "" {
|
||||
br.addConstColumn(columnName, v)
|
||||
} else if ch := br.bs.getColumnHeader(columnName); ch != nil {
|
||||
br.addColumn(ch)
|
||||
} else {
|
||||
br.addConstColumn(columnName, "")
|
||||
}
|
||||
}
|
||||
}
|
||||
|
||||
br.csInitFast()
|
||||
}
|
||||
|
||||
// mustInit initializes br with the given bs and bm.
|
||||
@@ -1753,132 +1761,266 @@ func (br *blockResult) getBucketedValue(s string, bf *byStatsField) string {
|
||||
return s
|
||||
}
|
||||
|
||||
// copyColumns copies columns from srcColumnNames to dstColumnNames.
|
||||
func (br *blockResult) copyColumns(srcColumnNames, dstColumnNames []string) {
|
||||
for i, srcName := range srcColumnNames {
|
||||
br.copySingleColumn(srcName, dstColumnNames[i])
|
||||
// copyColumnsByFilters copies columns from srcColumnFilters to dstColumnFilters.
|
||||
//
|
||||
// srcColumnFilters and dstColumnFilters may contain column names and column name prefixes ending with '*'.
|
||||
func (br *blockResult) copyColumnsByFilters(srcColumnFilters, dstColumnFilters []string) {
|
||||
for i, srcFilter := range srcColumnFilters {
|
||||
dstFilter := dstColumnFilters[i]
|
||||
br.copyColumnsByFilter(srcFilter, dstFilter)
|
||||
}
|
||||
}
|
||||
|
||||
func (br *blockResult) copySingleColumn(srcName, dstName string) {
|
||||
func (br *blockResult) copyColumnsByFilter(srcFilter, dstFilter string) {
|
||||
found := false
|
||||
cs := br.getColumns()
|
||||
csBufLen := len(br.csBuf)
|
||||
|
||||
for _, c := range cs {
|
||||
if c.name != dstName {
|
||||
br.csBuf = append(br.csBuf, *c)
|
||||
if !prefixfilter.MatchFilter(srcFilter, c.name) {
|
||||
continue
|
||||
}
|
||||
if c.name == srcName {
|
||||
cCopy := *c
|
||||
cCopy.name = dstName
|
||||
br.csBuf = append(br.csBuf, cCopy)
|
||||
found = true
|
||||
}
|
||||
}
|
||||
if !found {
|
||||
br.addConstColumn(dstName, "")
|
||||
}
|
||||
br.csBuf = append(br.csBuf[:0], br.csBuf[csBufLen:]...)
|
||||
br.csInitialized = false
|
||||
}
|
||||
|
||||
// renameColumns renames columns from srcColumnNames to dstColumnNames.
|
||||
func (br *blockResult) renameColumns(srcColumnNames, dstColumnNames []string) {
|
||||
for i, srcName := range srcColumnNames {
|
||||
br.renameSingleColumn(srcName, dstColumnNames[i])
|
||||
aLen := len(br.a.b)
|
||||
br.a.b = prefixfilter.AppendReplace(br.a.b, srcFilter, dstFilter, c.name)
|
||||
fieldName := bytesutil.ToUnsafeString(br.a.b[aLen:])
|
||||
|
||||
cCopy := *c
|
||||
cCopy.name = fieldName
|
||||
br.csAdd(cCopy)
|
||||
found = true
|
||||
}
|
||||
|
||||
if !found && !prefixfilter.IsWildcardFilter(srcFilter) {
|
||||
br.addConstColumn(dstFilter, "")
|
||||
}
|
||||
}
|
||||
|
||||
func (br *blockResult) renameSingleColumn(srcName, dstName string) {
|
||||
// renameColumnsByFilters renames columns from srcColumnFilters to dstColumnFilters.
|
||||
//
|
||||
// srcColumnFilters and dstColumnFilters may contain column names and column name prefixes ending with '*'.
|
||||
func (br *blockResult) renameColumnsByFilters(srcColumnFilters, dstColumnFilters []string) {
|
||||
for i, srcFilter := range srcColumnFilters {
|
||||
dstFilter := dstColumnFilters[i]
|
||||
br.renameColumnsByFilter(srcFilter, dstFilter)
|
||||
}
|
||||
}
|
||||
|
||||
func (br *blockResult) renameColumnsByFilter(srcFilter, dstFilter string) {
|
||||
found := false
|
||||
cs := br.getColumns()
|
||||
csBufLen := len(br.csBuf)
|
||||
|
||||
br.csInitialized = false
|
||||
csBuf := br.csBuf
|
||||
csBufLen := len(csBuf)
|
||||
|
||||
for _, c := range cs {
|
||||
if c.name == srcName {
|
||||
cCopy := *c
|
||||
cCopy.name = dstName
|
||||
br.csBuf = append(br.csBuf, cCopy)
|
||||
found = true
|
||||
} else if c.name != dstName {
|
||||
br.csBuf = append(br.csBuf, *c)
|
||||
if !prefixfilter.MatchFilter(srcFilter, c.name) {
|
||||
csBuf = append(csBuf, *c)
|
||||
}
|
||||
}
|
||||
if !found {
|
||||
br.addConstColumn(dstName, "")
|
||||
|
||||
for _, c := range cs {
|
||||
if !prefixfilter.MatchFilter(srcFilter, c.name) {
|
||||
continue
|
||||
}
|
||||
|
||||
aLen := len(br.a.b)
|
||||
br.a.b = prefixfilter.AppendReplace(br.a.b, srcFilter, dstFilter, c.name)
|
||||
|
||||
c.name = bytesutil.ToUnsafeString(br.a.b[aLen:])
|
||||
csBuf = append(csBuf, *c)
|
||||
found = true
|
||||
}
|
||||
|
||||
br.csBuf = csBuf
|
||||
br.csBuf = append(br.csBuf[:0], br.csBuf[csBufLen:]...)
|
||||
br.csInitialized = false
|
||||
|
||||
if !found && !prefixfilter.IsWildcardFilter(srcFilter) {
|
||||
br.addConstColumn(dstFilter, "")
|
||||
}
|
||||
}
|
||||
|
||||
// deleteColumns deletes columns with the given columnNames.
|
||||
func (br *blockResult) deleteColumns(columnNames []string) {
|
||||
if len(columnNames) == 0 {
|
||||
// deleteColumnsByFilters deletes columns with the given columnFilters.
|
||||
//
|
||||
// columnFilters may contain column names and column name prefixes ending with '*'.
|
||||
func (br *blockResult) deleteColumnsByFilters(columnFilters []string) {
|
||||
if len(columnFilters) == 0 {
|
||||
return
|
||||
}
|
||||
|
||||
cs := br.getColumns()
|
||||
csBufLen := len(br.csBuf)
|
||||
|
||||
br.csInitialized = false
|
||||
csBuf := br.csBuf
|
||||
csBufLen := len(csBuf)
|
||||
|
||||
for _, c := range cs {
|
||||
if !slices.Contains(columnNames, c.name) {
|
||||
br.csBuf = append(br.csBuf, *c)
|
||||
if !prefixfilter.MatchFilters(columnFilters, c.name) {
|
||||
csBuf = append(csBuf, *c)
|
||||
}
|
||||
}
|
||||
|
||||
br.csBuf = csBuf
|
||||
br.csBuf = append(br.csBuf[:0], br.csBuf[csBufLen:]...)
|
||||
br.csInitialized = false
|
||||
}
|
||||
|
||||
// setColumns sets the resulting columns to the given columnNames.
|
||||
func (br *blockResult) setColumns(columnNames []string) {
|
||||
if br.areSameColumns(columnNames) {
|
||||
// setColumnFilters sets the resulting columns according to the given columnFilters.
|
||||
func (br *blockResult) setColumnFilters(columnFilters []string) {
|
||||
if br.areSameColumns(columnFilters) {
|
||||
// Fast path - nothing to change.
|
||||
return
|
||||
}
|
||||
|
||||
// Slow path - construct the requested columns
|
||||
cs := br.getColumns()
|
||||
csBufLen := len(br.csBuf)
|
||||
for _, c := range cs {
|
||||
if slices.Contains(columnNames, c.name) {
|
||||
br.csBuf = append(br.csBuf, *c)
|
||||
}
|
||||
}
|
||||
|
||||
for _, columnName := range columnNames {
|
||||
if idx := getBlockResultColumnIdxByName(cs, columnName); idx < 0 {
|
||||
br.addConstColumn(columnName, "")
|
||||
}
|
||||
}
|
||||
|
||||
br.csBuf = append(br.csBuf[:0], br.csBuf[csBufLen:]...)
|
||||
br.csInitialized = false
|
||||
csBuf := br.csBuf
|
||||
csBufLen := len(csBuf)
|
||||
|
||||
for _, c := range cs {
|
||||
if prefixfilter.MatchFilters(columnFilters, c.name) {
|
||||
csBuf = append(csBuf, *c)
|
||||
}
|
||||
}
|
||||
|
||||
br.csBuf = csBuf
|
||||
br.csBuf = append(br.csBuf[:0], br.csBuf[csBufLen:]...)
|
||||
|
||||
for _, columnFilter := range columnFilters {
|
||||
if prefixfilter.IsWildcardFilter(columnFilter) {
|
||||
continue
|
||||
}
|
||||
if idx := getBlockResultColumnIdxByName(cs, columnFilter); idx < 0 {
|
||||
br.addConstColumn(columnFilter, "")
|
||||
}
|
||||
}
|
||||
}
|
||||
|
||||
func (br *blockResult) areSameColumns(columnNames []string) bool {
|
||||
func (br *blockResult) areSameColumns(columnFilters []string) bool {
|
||||
cs := br.getColumns()
|
||||
if len(cs) != len(columnNames) {
|
||||
return false
|
||||
}
|
||||
for i, c := range cs {
|
||||
if c.name != columnNames[i] {
|
||||
for _, c := range cs {
|
||||
if !prefixfilter.MatchFilters(columnFilters, c.name) {
|
||||
return false
|
||||
}
|
||||
}
|
||||
|
||||
for _, columnFilter := range columnFilters {
|
||||
if prefixfilter.IsWildcardFilter(columnFilter) {
|
||||
continue
|
||||
}
|
||||
if idx := getBlockResultColumnIdxByName(cs, columnFilter); idx < 0 {
|
||||
return false
|
||||
}
|
||||
}
|
||||
|
||||
return true
|
||||
}
|
||||
|
||||
func (br *blockResult) getColumnByName(columnName string) *blockResultColumn {
|
||||
if columnName == "" {
|
||||
columnName = "_msg"
|
||||
func getMatchingColumns(br *blockResult, filters []string) *matchingColumns {
|
||||
v := matchingColumnsPool.Get()
|
||||
if v == nil {
|
||||
v = &matchingColumns{}
|
||||
}
|
||||
mc := v.(*matchingColumns)
|
||||
|
||||
if isSingleField(filters) {
|
||||
// Fast path - a single column is requested
|
||||
field := filters[0]
|
||||
c := br.getColumnByName(field)
|
||||
mc.cs = append(mc.cs[:0], c)
|
||||
return mc
|
||||
}
|
||||
|
||||
// Slower path - multiple columns are requested
|
||||
mc.cs = br.getMatchingColumnsSlow(mc.cs[:0], filters)
|
||||
return mc
|
||||
}
|
||||
|
||||
func putMatchingColumns(mc *matchingColumns) {
|
||||
mc.reset()
|
||||
matchingColumnsPool.Put(mc)
|
||||
}
|
||||
|
||||
type matchingColumns struct {
|
||||
cs []*blockResultColumn
|
||||
}
|
||||
|
||||
func (mc *matchingColumns) reset() {
|
||||
clear(mc.cs)
|
||||
mc.cs = mc.cs[:0]
|
||||
}
|
||||
|
||||
func (mc *matchingColumns) sort() {
|
||||
if len(mc.cs) > 1 && !sort.IsSorted(mc) {
|
||||
sort.Sort(mc)
|
||||
}
|
||||
}
|
||||
|
||||
func (mc *matchingColumns) Len() int {
|
||||
return len(mc.cs)
|
||||
}
|
||||
func (mc *matchingColumns) Less(i, j int) bool {
|
||||
cs := mc.cs
|
||||
return cs[i].name < cs[j].name
|
||||
}
|
||||
func (mc *matchingColumns) Swap(i, j int) {
|
||||
cs := mc.cs
|
||||
cs[i], cs[j] = cs[j], cs[i]
|
||||
}
|
||||
|
||||
var matchingColumnsPool sync.Pool
|
||||
|
||||
func (br *blockResult) getMatchingColumnsSlow(dst []*blockResultColumn, filters []string) []*blockResultColumn {
|
||||
cs := br.getColumns()
|
||||
|
||||
// Add columns matching the given filters
|
||||
for _, c := range cs {
|
||||
if prefixfilter.MatchFilters(filters, c.name) {
|
||||
dst = append(dst, c)
|
||||
}
|
||||
}
|
||||
|
||||
// Add empty columns for non-wildcard filters, which do not match non-empty columns.
|
||||
for _, f := range filters {
|
||||
if prefixfilter.IsWildcardFilter(f) {
|
||||
continue
|
||||
}
|
||||
|
||||
needEmptyField := true
|
||||
for _, c := range cs {
|
||||
if f == c.name {
|
||||
needEmptyField = false
|
||||
break
|
||||
}
|
||||
}
|
||||
|
||||
if needEmptyField {
|
||||
c := br.getEmptyColumnByName(f)
|
||||
dst = append(dst, c)
|
||||
}
|
||||
}
|
||||
|
||||
return dst
|
||||
}
|
||||
|
||||
func isSingleField(filters []string) bool {
|
||||
return len(filters) == 1 && !prefixfilter.IsWildcardFilter(filters[0])
|
||||
}
|
||||
|
||||
func (br *blockResult) getColumnByName(columnName string) *blockResultColumn {
|
||||
cs := br.getColumns()
|
||||
|
||||
columnName = getCanonicalColumnName(columnName)
|
||||
idx := getBlockResultColumnIdxByName(cs, columnName)
|
||||
if idx >= 0 {
|
||||
return cs[idx]
|
||||
}
|
||||
|
||||
// Search for empty column with the given name
|
||||
return br.getEmptyColumnByName(columnName)
|
||||
}
|
||||
|
||||
func (br *blockResult) getEmptyColumnByName(columnName string) *blockResultColumn {
|
||||
csEmpty := br.csEmpty
|
||||
for i := range csEmpty {
|
||||
if csEmpty[i].name == columnName {
|
||||
|
||||
Some files were not shown because too many files have changed in this diff Show More
Reference in New Issue
Block a user