Compare commits
30 Commits
docs/trace
...
feature/me
| Author | SHA1 | Date | |
|---|---|---|---|
|
|
520123508e | ||
|
|
1590626d0b | ||
|
|
d2487fdb19 | ||
|
|
0c1f624985 | ||
|
|
a3fb0fece1 | ||
|
|
0d842a7620 | ||
|
|
48bd251817 | ||
|
|
11ce870625 | ||
|
|
d84f96505b | ||
|
|
124163d4b2 | ||
|
|
65087f08c4 | ||
|
|
ca0479fff3 | ||
|
|
644c7a97c8 | ||
|
|
098cba5b73 | ||
|
|
5d0e8c0d1b | ||
|
|
442bfa6c35 | ||
|
|
ee031b21a7 | ||
|
|
deec361a64 | ||
|
|
fd4dce81ce | ||
|
|
5431696d83 | ||
|
|
1b71184bfb | ||
|
|
29c06b9543 | ||
|
|
369f3f0da1 | ||
|
|
6f93f0e1a7 | ||
|
|
96b773198f | ||
|
|
006381266b | ||
|
|
ae1dffe5d3 | ||
|
|
80e508eac7 | ||
|
|
86d8095417 | ||
|
|
df847e62c0 |
@@ -89,15 +89,18 @@ func (t *Type) ValidateExpr(expr string) error {
|
||||
return nil
|
||||
}
|
||||
|
||||
// SupportedType is true if given datasource type is supported
|
||||
func SupportedType(dsType string) bool {
|
||||
return dsType == "graphite" || dsType == "prometheus" || dsType == "vlogs"
|
||||
}
|
||||
|
||||
// UnmarshalYAML implements the yaml.Unmarshaler interface.
|
||||
func (t *Type) UnmarshalYAML(unmarshal func(any) error) error {
|
||||
var s string
|
||||
if err := unmarshal(&s); err != nil {
|
||||
return err
|
||||
}
|
||||
switch s {
|
||||
case "graphite", "prometheus", "vlogs":
|
||||
default:
|
||||
if !SupportedType(s) {
|
||||
return fmt.Errorf("unknown datasource type=%q, want prometheus, graphite or vlogs", s)
|
||||
}
|
||||
t.Name = s
|
||||
|
||||
@@ -148,9 +148,13 @@ func main() {
|
||||
if err != nil {
|
||||
logger.Fatalf("failed to init datasource: %s", err)
|
||||
}
|
||||
if err := replay(groupsCfg, q, rw); err != nil {
|
||||
totalRows, droppedRows, err := replay(groupsCfg, q, rw)
|
||||
if err != nil {
|
||||
logger.Fatalf("replay failed: %s", err)
|
||||
}
|
||||
if droppedRows > 0 {
|
||||
logger.Fatalf("failed to push all generated samples to remote write url, dropped %d samples out of %d", droppedRows, totalRows)
|
||||
}
|
||||
logger.Infof("replay succeed!")
|
||||
return
|
||||
}
|
||||
|
||||
@@ -216,7 +216,7 @@ var (
|
||||
)
|
||||
|
||||
// GetDroppedRows returns value of droppedRows metric
|
||||
func GetDroppedRows() int64 { return int64(droppedRows.Get()) }
|
||||
func GetDroppedRows() int { return int(droppedRows.Get()) }
|
||||
|
||||
// flush is a blocking function that marshals WriteRequest and sends
|
||||
// it to remote-write endpoint. Flush performs limited amount of retries
|
||||
|
||||
@@ -30,13 +30,13 @@ var (
|
||||
"Progress bar rendering might be verbose or break the logs parsing, so it is recommended to be disabled when not used in interactive mode.")
|
||||
)
|
||||
|
||||
func replay(groupsCfg []config.Group, qb datasource.QuerierBuilder, rw remotewrite.RWClient) error {
|
||||
func replay(groupsCfg []config.Group, qb datasource.QuerierBuilder, rw remotewrite.RWClient) (totalRows, droppedRows int, err error) {
|
||||
if *replayMaxDatapoints < 1 {
|
||||
return fmt.Errorf("replay.maxDatapointsPerQuery can't be lower than 1")
|
||||
return 0, 0, fmt.Errorf("replay.maxDatapointsPerQuery can't be lower than 1")
|
||||
}
|
||||
tFrom, err := time.Parse(time.RFC3339, *replayFrom)
|
||||
if err != nil {
|
||||
return fmt.Errorf("failed to parse replay.timeFrom=%q: %w", *replayFrom, err)
|
||||
return 0, 0, fmt.Errorf("failed to parse replay.timeFrom=%q: %w", *replayFrom, err)
|
||||
}
|
||||
|
||||
// use tFrom location for default value, otherwise filters could have different locations
|
||||
@@ -44,12 +44,12 @@ func replay(groupsCfg []config.Group, qb datasource.QuerierBuilder, rw remotewri
|
||||
if *replayTo != "" {
|
||||
tTo, err = time.Parse(time.RFC3339, *replayTo)
|
||||
if err != nil {
|
||||
return fmt.Errorf("failed to parse replay.timeTo=%q: %w", *replayTo, err)
|
||||
return 0, 0, fmt.Errorf("failed to parse replay.timeTo=%q: %w", *replayTo, err)
|
||||
}
|
||||
}
|
||||
|
||||
if !tTo.After(tFrom) {
|
||||
return fmt.Errorf("replay.timeTo=%v must be bigger than replay.timeFrom=%v", tTo, tFrom)
|
||||
return 0, 0, fmt.Errorf("replay.timeTo=%v must be bigger than replay.timeFrom=%v", tTo, tFrom)
|
||||
}
|
||||
labels := make(map[string]string)
|
||||
for _, s := range *externalLabels {
|
||||
@@ -58,7 +58,7 @@ func replay(groupsCfg []config.Group, qb datasource.QuerierBuilder, rw remotewri
|
||||
}
|
||||
n := strings.IndexByte(s, '=')
|
||||
if n < 0 {
|
||||
return fmt.Errorf("missing '=' in `-label`. It must contain label in the form `name=value`; got %q", s)
|
||||
return 0, 0, fmt.Errorf("missing '=' in `-label`. It must contain label in the form `name=value`; got %q", s)
|
||||
}
|
||||
labels[s[:n]] = s[n+1:]
|
||||
}
|
||||
@@ -69,18 +69,14 @@ func replay(groupsCfg []config.Group, qb datasource.QuerierBuilder, rw remotewri
|
||||
"\nmax data points per request: %d\n",
|
||||
tFrom, tTo, *replayMaxDatapoints)
|
||||
|
||||
var total int
|
||||
for _, cfg := range groupsCfg {
|
||||
ng := rule.NewGroup(cfg, qb, *evaluationInterval, labels)
|
||||
total += ng.Replay(tFrom, tTo, rw, *replayMaxDatapoints, *replayRuleRetryAttempts, *replayRulesDelay, *disableProgressBar)
|
||||
totalRows += ng.Replay(tFrom, tTo, rw, *replayMaxDatapoints, *replayRuleRetryAttempts, *replayRulesDelay, *disableProgressBar)
|
||||
}
|
||||
logger.Infof("replay evaluation finished, generated %d samples", total)
|
||||
logger.Infof("replay evaluation finished, generated %d samples", totalRows)
|
||||
if err := rw.Close(); err != nil {
|
||||
return err
|
||||
return 0, 0, err
|
||||
}
|
||||
droppedRows := remotewrite.GetDroppedRows()
|
||||
if droppedRows > 0 {
|
||||
return fmt.Errorf("failed to push all generated samples to remote write url, dropped %d samples out of %d", droppedRows, total)
|
||||
}
|
||||
return nil
|
||||
droppedRows = remotewrite.GetDroppedRows()
|
||||
return totalRows, droppedRows, nil
|
||||
}
|
||||
|
||||
@@ -8,38 +8,45 @@ import (
|
||||
|
||||
"github.com/VictoriaMetrics/VictoriaMetrics/app/vmalert/config"
|
||||
"github.com/VictoriaMetrics/VictoriaMetrics/app/vmalert/datasource"
|
||||
"github.com/VictoriaMetrics/VictoriaMetrics/app/vmalert/remotewrite"
|
||||
"github.com/VictoriaMetrics/VictoriaMetrics/lib/prompbmarshal"
|
||||
"github.com/VictoriaMetrics/VictoriaMetrics/lib/promutil"
|
||||
)
|
||||
|
||||
type fakeReplayQuerier struct {
|
||||
datasource.FakeQuerier
|
||||
registry map[string]map[string]struct{}
|
||||
registry map[string]map[string][]datasource.Metric
|
||||
}
|
||||
|
||||
func (fr *fakeReplayQuerier) BuildWithParams(_ datasource.QuerierParams) datasource.Querier {
|
||||
return fr
|
||||
}
|
||||
|
||||
type fakeRWClient struct{}
|
||||
|
||||
func (fc *fakeRWClient) Push(_ prompbmarshal.TimeSeries) error {
|
||||
return nil
|
||||
}
|
||||
|
||||
func (fc *fakeRWClient) Close() error {
|
||||
return nil
|
||||
}
|
||||
|
||||
func (fr *fakeReplayQuerier) QueryRange(_ context.Context, q string, from, to time.Time) (res datasource.Result, err error) {
|
||||
key := fmt.Sprintf("%s+%s", from.Format("15:04:05"), to.Format("15:04:05"))
|
||||
dps, ok := fr.registry[q]
|
||||
if !ok {
|
||||
return res, fmt.Errorf("unexpected query received: %q", q)
|
||||
}
|
||||
_, ok = dps[key]
|
||||
metrics, ok := dps[key]
|
||||
if !ok {
|
||||
return res, fmt.Errorf("unexpected time range received: %q", key)
|
||||
}
|
||||
delete(dps, key)
|
||||
if len(fr.registry[q]) < 1 {
|
||||
delete(fr.registry, q)
|
||||
}
|
||||
res.Data = metrics
|
||||
return res, nil
|
||||
}
|
||||
|
||||
func TestReplay(t *testing.T) {
|
||||
f := func(from, to string, maxDP int, ruleDelay time.Duration, cfg []config.Group, qb *fakeReplayQuerier) {
|
||||
f := func(from, to string, maxDP int, ruleDelay time.Duration, cfg []config.Group, qb *fakeReplayQuerier, expectTotalRows int) {
|
||||
t.Helper()
|
||||
|
||||
fromOrig, toOrig, maxDatapointsOrig := *replayFrom, *replayTo, *replayMaxDatapoints
|
||||
@@ -52,15 +59,16 @@ func TestReplay(t *testing.T) {
|
||||
|
||||
*replayRuleRetryAttempts = 1
|
||||
*replayRulesDelay = ruleDelay
|
||||
rwb := &remotewrite.DebugClient{}
|
||||
rwb := &fakeRWClient{}
|
||||
*replayFrom = from
|
||||
*replayTo = to
|
||||
*replayMaxDatapoints = maxDP
|
||||
if err := replay(cfg, qb, rwb); err != nil {
|
||||
totalRows, _, err := replay(cfg, qb, rwb)
|
||||
if err != nil {
|
||||
t.Fatalf("replay failed: %s", err)
|
||||
}
|
||||
if len(qb.registry) > 0 {
|
||||
t.Fatalf("not all requests were sent: %#v", qb.registry)
|
||||
if totalRows != expectTotalRows {
|
||||
t.Fatalf("unexpected total rows count: got %d, want %d", totalRows, expectTotalRows)
|
||||
}
|
||||
}
|
||||
|
||||
@@ -68,90 +76,154 @@ func TestReplay(t *testing.T) {
|
||||
f("2021-01-01T12:00:00.000Z", "2021-01-01T12:02:00.000Z", 10, time.Millisecond, []config.Group{
|
||||
{Rules: []config.Rule{{Record: "foo", Expr: "sum(up)"}}},
|
||||
}, &fakeReplayQuerier{
|
||||
registry: map[string]map[string]struct{}{
|
||||
"sum(up)": {"12:00:00+12:02:00": {}},
|
||||
registry: map[string]map[string][]datasource.Metric{
|
||||
"sum(up)": {"12:00:00+12:02:00": {
|
||||
{
|
||||
Timestamps: []int64{1},
|
||||
Values: []float64{1},
|
||||
},
|
||||
}},
|
||||
},
|
||||
})
|
||||
}, 1)
|
||||
|
||||
// one rule + multiple responses
|
||||
f("2021-01-01T12:00:00.000Z", "2021-01-01T12:02:30.000Z", 1, time.Millisecond, []config.Group{
|
||||
{Rules: []config.Rule{{Record: "foo", Expr: "sum(up)"}}},
|
||||
}, &fakeReplayQuerier{
|
||||
registry: map[string]map[string]struct{}{
|
||||
registry: map[string]map[string][]datasource.Metric{
|
||||
"sum(up)": {
|
||||
"12:00:00+12:01:00": {},
|
||||
"12:00:00+12:01:00": {
|
||||
{
|
||||
Timestamps: []int64{1},
|
||||
Values: []float64{1},
|
||||
},
|
||||
},
|
||||
"12:01:00+12:02:00": {},
|
||||
"12:02:00+12:02:30": {},
|
||||
"12:02:00+12:02:30": {
|
||||
{
|
||||
Timestamps: []int64{1},
|
||||
Values: []float64{1},
|
||||
},
|
||||
},
|
||||
},
|
||||
},
|
||||
})
|
||||
}, 2)
|
||||
|
||||
// datapoints per step
|
||||
f("2021-01-01T12:00:00.000Z", "2021-01-01T15:02:30.000Z", 60, time.Millisecond, []config.Group{
|
||||
{Interval: promutil.NewDuration(time.Minute), Rules: []config.Rule{{Record: "foo", Expr: "sum(up)"}}},
|
||||
}, &fakeReplayQuerier{
|
||||
registry: map[string]map[string]struct{}{
|
||||
registry: map[string]map[string][]datasource.Metric{
|
||||
"sum(up)": {
|
||||
"12:00:00+13:00:00": {},
|
||||
"13:00:00+14:00:00": {},
|
||||
"12:00:00+13:00:00": {
|
||||
{
|
||||
Timestamps: []int64{1, 2},
|
||||
Values: []float64{1, 2},
|
||||
},
|
||||
},
|
||||
"13:00:00+14:00:00": {
|
||||
{
|
||||
Timestamps: []int64{1},
|
||||
Values: []float64{1},
|
||||
},
|
||||
},
|
||||
"14:00:00+15:00:00": {},
|
||||
"15:00:00+15:02:30": {},
|
||||
},
|
||||
},
|
||||
})
|
||||
}, 3)
|
||||
|
||||
// multiple recording rules + multiple responses
|
||||
f("2021-01-01T12:00:00.000Z", "2021-01-01T12:02:30.000Z", 1, time.Millisecond, []config.Group{
|
||||
{Rules: []config.Rule{{Record: "foo", Expr: "sum(up)"}}},
|
||||
{Rules: []config.Rule{{Record: "bar", Expr: "max(up)"}}},
|
||||
}, &fakeReplayQuerier{
|
||||
registry: map[string]map[string]struct{}{
|
||||
registry: map[string]map[string][]datasource.Metric{
|
||||
"sum(up)": {
|
||||
"12:00:00+12:01:00": {},
|
||||
"12:00:00+12:01:00": {
|
||||
{
|
||||
Timestamps: []int64{1, 2},
|
||||
Values: []float64{1, 2},
|
||||
},
|
||||
},
|
||||
"12:01:00+12:02:00": {},
|
||||
"12:02:00+12:02:30": {},
|
||||
},
|
||||
"max(up)": {
|
||||
"12:00:00+12:01:00": {},
|
||||
"12:01:00+12:02:00": {},
|
||||
"12:01:00+12:02:00": {
|
||||
{
|
||||
Timestamps: []int64{1, 2},
|
||||
Values: []float64{1, 2},
|
||||
},
|
||||
},
|
||||
"12:02:00+12:02:30": {},
|
||||
},
|
||||
},
|
||||
})
|
||||
}, 4)
|
||||
|
||||
// multiple alerting rules + multiple responses
|
||||
// alerting rule generates two series `ALERTS` and `ALERTS_FOR_STATE` when triggered
|
||||
f("2021-01-01T12:00:00.000Z", "2021-01-01T12:02:30.000Z", 1, time.Millisecond, []config.Group{
|
||||
{Rules: []config.Rule{{Alert: "foo", Expr: "sum(up) > 1"}}},
|
||||
{Rules: []config.Rule{{Alert: "bar", Expr: "max(up) < 1"}}},
|
||||
}, &fakeReplayQuerier{
|
||||
registry: map[string]map[string]struct{}{
|
||||
registry: map[string]map[string][]datasource.Metric{
|
||||
"sum(up) > 1": {
|
||||
"12:00:00+12:01:00": {},
|
||||
"12:00:00+12:01:00": {
|
||||
{
|
||||
Timestamps: []int64{1, 2},
|
||||
Values: []float64{1, 2},
|
||||
},
|
||||
},
|
||||
"12:01:00+12:02:00": {},
|
||||
"12:02:00+12:02:30": {},
|
||||
},
|
||||
"max(up) < 1": {
|
||||
"12:00:00+12:01:00": {},
|
||||
"12:00:00+12:01:00": {
|
||||
{
|
||||
Timestamps: []int64{1},
|
||||
Values: []float64{1},
|
||||
},
|
||||
},
|
||||
"12:01:00+12:02:00": {},
|
||||
"12:02:00+12:02:30": {},
|
||||
},
|
||||
},
|
||||
})
|
||||
}, 6)
|
||||
|
||||
// multiple alerting rules in one group+ multiple responses + concurrency
|
||||
// multiple recording rules in one group+ multiple responses + concurrency
|
||||
f("2021-01-01T12:00:00.000Z", "2021-01-01T12:02:30.000Z", 1, 0, []config.Group{
|
||||
{Rules: []config.Rule{{Alert: "foo", Expr: "sum(up) > 1"}, {Alert: "bar", Expr: "max(up) < 1"}}, Concurrency: 2}}, &fakeReplayQuerier{
|
||||
registry: map[string]map[string]struct{}{
|
||||
{Rules: []config.Rule{{Record: "foo", Expr: "sum(up) > 1"}, {Record: "bar", Expr: "max(up) < 1"}}, Concurrency: 2}}, &fakeReplayQuerier{
|
||||
registry: map[string]map[string][]datasource.Metric{
|
||||
"sum(up) > 1": {
|
||||
"12:00:00+12:01:00": {},
|
||||
"12:01:00+12:02:00": {},
|
||||
"12:02:00+12:02:30": {},
|
||||
"12:00:00+12:01:00": {
|
||||
{
|
||||
Timestamps: []int64{1},
|
||||
Values: []float64{1},
|
||||
},
|
||||
},
|
||||
"12:01:00+12:02:00": {
|
||||
{
|
||||
Timestamps: []int64{1},
|
||||
Values: []float64{1},
|
||||
},
|
||||
},
|
||||
"12:02:00+12:02:30": {
|
||||
{
|
||||
Timestamps: []int64{1},
|
||||
Values: []float64{1},
|
||||
},
|
||||
},
|
||||
},
|
||||
"max(up) < 1": {
|
||||
"12:00:00+12:01:00": {},
|
||||
"12:01:00+12:02:00": {},
|
||||
"12:01:00+12:02:00": {{
|
||||
Timestamps: []int64{1},
|
||||
Values: []float64{1},
|
||||
}},
|
||||
"12:02:00+12:02:30": {},
|
||||
},
|
||||
},
|
||||
})
|
||||
}, 4)
|
||||
}
|
||||
|
||||
@@ -9,6 +9,7 @@ import (
|
||||
"strconv"
|
||||
"strings"
|
||||
|
||||
"github.com/VictoriaMetrics/VictoriaMetrics/app/vmalert/config"
|
||||
"github.com/VictoriaMetrics/VictoriaMetrics/app/vmalert/notifier"
|
||||
"github.com/VictoriaMetrics/VictoriaMetrics/app/vmalert/rule"
|
||||
"github.com/VictoriaMetrics/VictoriaMetrics/app/vmalert/tpl"
|
||||
@@ -27,6 +28,7 @@ var (
|
||||
// such as Grafana, and proxied via vmselect.
|
||||
{"api/v1/rules", "list all loaded groups and rules"},
|
||||
{"api/v1/alerts", "list all active alerts"},
|
||||
{"api/v1/notifiers", "list all notifiers"},
|
||||
{fmt.Sprintf("api/v1/alert?%s=<int>&%s=<int>", paramGroupID, paramAlertID), "get alert status by group and alert ID"},
|
||||
}
|
||||
systemLinks = [][2]string{
|
||||
@@ -42,6 +44,10 @@ var (
|
||||
{Name: "Notifiers", URL: "notifiers"},
|
||||
{Name: "Docs", URL: "https://docs.victoriametrics.com/victoriametrics/vmalert/"},
|
||||
}
|
||||
ruleTypeMap = map[string]string{
|
||||
"alert": ruleTypeAlerting,
|
||||
"record": ruleTypeRecording,
|
||||
}
|
||||
)
|
||||
|
||||
type requestHandler struct {
|
||||
@@ -89,10 +95,13 @@ func (rh *requestHandler) handler(w http.ResponseWriter, r *http.Request) bool {
|
||||
WriteRuleDetails(w, r, rule)
|
||||
return true
|
||||
case "/vmalert/groups":
|
||||
filter := r.URL.Query().Get("filter")
|
||||
rf := extractRulesFilter(r, filter)
|
||||
rf, err := newRulesFilter(r)
|
||||
if err != nil {
|
||||
httpserver.Errorf(w, r, "%s", err)
|
||||
return true
|
||||
}
|
||||
data := rh.groups(rf)
|
||||
WriteListGroups(w, r, data, filter)
|
||||
WriteListGroups(w, r, data, rf.filter)
|
||||
return true
|
||||
case "/vmalert/notifiers":
|
||||
WriteListTargets(w, r, notifier.GetTargets())
|
||||
@@ -102,23 +111,35 @@ func (rh *requestHandler) handler(w http.ResponseWriter, r *http.Request) bool {
|
||||
// served without `vmalert` prefix:
|
||||
case "/rules":
|
||||
// Grafana makes an extra request to `/rules`
|
||||
// handler in addition to `/api/v1/rules` calls in alerts UI,
|
||||
var data []apiGroup
|
||||
filter := r.URL.Query().Get("filter")
|
||||
rf := extractRulesFilter(r, filter)
|
||||
// handler in addition to `/api/v1/rules` calls in alerts UI
|
||||
var data []*apiGroup
|
||||
rf, err := newRulesFilter(r)
|
||||
if err != nil {
|
||||
httpserver.Errorf(w, r, "%s", err)
|
||||
return true
|
||||
}
|
||||
data = rh.groups(rf)
|
||||
WriteListGroups(w, r, data, filter)
|
||||
WriteListGroups(w, r, data, rf.filter)
|
||||
return true
|
||||
|
||||
case "/vmalert/api/v1/notifiers", "/api/v1/notifiers":
|
||||
data, err := rh.listNotifiers()
|
||||
if err != nil {
|
||||
httpserver.Errorf(w, r, "%s", err)
|
||||
return true
|
||||
}
|
||||
w.Header().Set("Content-Type", "application/json")
|
||||
w.Write(data)
|
||||
return true
|
||||
case "/vmalert/api/v1/rules", "/api/v1/rules":
|
||||
// path used by Grafana for ng alerting
|
||||
var data []byte
|
||||
var err error
|
||||
|
||||
filter := r.URL.Query().Get("filter")
|
||||
rf := extractRulesFilter(r, filter)
|
||||
rf, err := newRulesFilter(r)
|
||||
if err != nil {
|
||||
httpserver.Errorf(w, r, "%s", err)
|
||||
return true
|
||||
}
|
||||
data, err = rh.listGroups(rf)
|
||||
|
||||
if err != nil {
|
||||
httpserver.Errorf(w, r, "%s", err)
|
||||
return true
|
||||
@@ -129,7 +150,12 @@ func (rh *requestHandler) handler(w http.ResponseWriter, r *http.Request) bool {
|
||||
|
||||
case "/vmalert/api/v1/alerts", "/api/v1/alerts":
|
||||
// path used by Grafana for ng alerting
|
||||
data, err := rh.listAlerts()
|
||||
rf, err := newRulesFilter(r)
|
||||
if err != nil {
|
||||
httpserver.Errorf(w, r, "%s", err)
|
||||
return true
|
||||
}
|
||||
data, err := rh.listAlerts(rf)
|
||||
if err != nil {
|
||||
httpserver.Errorf(w, r, "%s", err)
|
||||
return true
|
||||
@@ -218,7 +244,7 @@ func (rh *requestHandler) getAlert(r *http.Request) (*apiAlert, error) {
|
||||
type listGroupsResponse struct {
|
||||
Status string `json:"status"`
|
||||
Data struct {
|
||||
Groups []apiGroup `json:"groups"`
|
||||
Groups []*apiGroup `json:"groups"`
|
||||
} `json:"data"`
|
||||
}
|
||||
|
||||
@@ -229,82 +255,102 @@ type rulesFilter struct {
|
||||
ruleNames []string
|
||||
ruleType string
|
||||
excludeAlerts bool
|
||||
onlyUnhealthy bool
|
||||
onlyNoMatch bool
|
||||
filter string
|
||||
dsType config.Type
|
||||
}
|
||||
|
||||
func extractRulesFilter(r *http.Request, filter string) rulesFilter {
|
||||
rf := rulesFilter{}
|
||||
func newRulesFilter(r *http.Request) (*rulesFilter, error) {
|
||||
rf := &rulesFilter{}
|
||||
query := r.URL.Query()
|
||||
|
||||
var ruleType string
|
||||
ruleTypeParam := r.URL.Query().Get("type")
|
||||
// for some reason, `type` in filter doesn't match `type` in response,
|
||||
// so we use this matching here
|
||||
if ruleTypeParam == "alert" {
|
||||
ruleType = ruleTypeAlerting
|
||||
} else if ruleTypeParam == "record" {
|
||||
ruleType = ruleTypeRecording
|
||||
ruleTypeParam := query.Get("type")
|
||||
if len(ruleTypeParam) > 0 {
|
||||
if ruleType, ok := ruleTypeMap[ruleTypeParam]; ok {
|
||||
rf.ruleType = ruleType
|
||||
} else {
|
||||
return nil, errResponse(fmt.Errorf(`invalid parameter "type": not supported value %q`, ruleTypeParam), http.StatusBadRequest)
|
||||
}
|
||||
}
|
||||
|
||||
dsType := query.Get("datasource_type")
|
||||
if len(dsType) > 0 {
|
||||
if config.SupportedType(dsType) {
|
||||
rf.dsType = config.NewRawType(dsType)
|
||||
} else {
|
||||
return nil, errResponse(fmt.Errorf(`invalid parameter "datasource_type": not supported value %q`, dsType), http.StatusBadRequest)
|
||||
}
|
||||
}
|
||||
|
||||
filter := strings.ToLower(query.Get("filter"))
|
||||
if len(filter) > 0 {
|
||||
if filter == "nomatch" || filter == "unhealthy" {
|
||||
rf.filter = filter
|
||||
} else {
|
||||
return nil, errResponse(fmt.Errorf(`invalid parameter "filter": not supported value %q`, filter), http.StatusBadRequest)
|
||||
}
|
||||
}
|
||||
rf.ruleType = ruleType
|
||||
|
||||
rf.excludeAlerts = httputil.GetBool(r, "exclude_alerts")
|
||||
rf.ruleNames = append([]string{}, r.Form["rule_name[]"]...)
|
||||
rf.groupNames = append([]string{}, r.Form["rule_group[]"]...)
|
||||
rf.files = append([]string{}, r.Form["file[]"]...)
|
||||
switch filter {
|
||||
case "unhealthy":
|
||||
rf.onlyUnhealthy = true
|
||||
case "noMatch":
|
||||
rf.onlyNoMatch = true
|
||||
}
|
||||
return rf
|
||||
return rf, nil
|
||||
}
|
||||
|
||||
func (rh *requestHandler) groups(rf rulesFilter) []apiGroup {
|
||||
func (rf *rulesFilter) matchesGroup(group *rule.Group) bool {
|
||||
if len(rf.groupNames) > 0 && !slices.Contains(rf.groupNames, group.Name) {
|
||||
return false
|
||||
}
|
||||
if len(rf.files) > 0 && !slices.Contains(rf.files, group.File) {
|
||||
return false
|
||||
}
|
||||
if len(rf.dsType.Name) > 0 && rf.dsType.String() != group.Type.String() {
|
||||
return false
|
||||
}
|
||||
return true
|
||||
}
|
||||
|
||||
func (rh *requestHandler) groups(rf *rulesFilter) []*apiGroup {
|
||||
rh.m.groupsMu.RLock()
|
||||
defer rh.m.groupsMu.RUnlock()
|
||||
|
||||
groups := make([]apiGroup, 0)
|
||||
groups := make([]*apiGroup, 0)
|
||||
for _, group := range rh.m.groups {
|
||||
if len(rf.groupNames) > 0 && !slices.Contains(rf.groupNames, group.Name) {
|
||||
if !rf.matchesGroup(group) {
|
||||
continue
|
||||
}
|
||||
if len(rf.files) > 0 && !slices.Contains(rf.files, group.File) {
|
||||
continue
|
||||
}
|
||||
|
||||
g := groupToAPI(group)
|
||||
// the returned list should always be non-nil
|
||||
// https://github.com/VictoriaMetrics/VictoriaMetrics/issues/4221
|
||||
filteredRules := make([]apiRule, 0)
|
||||
for _, r := range g.Rules {
|
||||
if rf.ruleType != "" && rf.ruleType != r.Type {
|
||||
for _, rule := range g.Rules {
|
||||
if rf.ruleType != "" && rf.ruleType != rule.Type {
|
||||
continue
|
||||
}
|
||||
if len(rf.ruleNames) > 0 && !slices.Contains(rf.ruleNames, r.Name) {
|
||||
if len(rf.ruleNames) > 0 && !slices.Contains(rf.ruleNames, rule.Name) {
|
||||
continue
|
||||
}
|
||||
if (rule.LastError == "" && rf.filter == "unhealthy") || (!isNoMatch(rule) && rf.filter == "nomatch") {
|
||||
continue
|
||||
}
|
||||
if rf.excludeAlerts {
|
||||
r.Alerts = nil
|
||||
rule.Alerts = nil
|
||||
}
|
||||
if (r.LastError == "" && rf.onlyUnhealthy) || (!isNoMatch(r) && rf.onlyNoMatch) {
|
||||
continue
|
||||
}
|
||||
if r.LastError != "" {
|
||||
if rule.LastError != "" {
|
||||
g.Unhealthy++
|
||||
} else {
|
||||
g.Healthy++
|
||||
}
|
||||
if isNoMatch(r) {
|
||||
if isNoMatch(rule) {
|
||||
g.NoMatch++
|
||||
}
|
||||
filteredRules = append(filteredRules, r)
|
||||
filteredRules = append(filteredRules, rule)
|
||||
}
|
||||
g.Rules = filteredRules
|
||||
groups = append(groups, g)
|
||||
}
|
||||
// sort list of groups for deterministic output
|
||||
slices.SortFunc(groups, func(a, b apiGroup) int {
|
||||
slices.SortFunc(groups, func(a, b *apiGroup) int {
|
||||
if a.Name != b.Name {
|
||||
return strings.Compare(a.Name, b.Name)
|
||||
}
|
||||
@@ -313,7 +359,7 @@ func (rh *requestHandler) groups(rf rulesFilter) []apiGroup {
|
||||
return groups
|
||||
}
|
||||
|
||||
func (rh *requestHandler) listGroups(rf rulesFilter) ([]byte, error) {
|
||||
func (rh *requestHandler) listGroups(rf *rulesFilter) ([]byte, error) {
|
||||
lr := listGroupsResponse{Status: "success"}
|
||||
lr.Data.Groups = rh.groups(rf)
|
||||
b, err := json.Marshal(lr)
|
||||
@@ -360,14 +406,17 @@ func (rh *requestHandler) groupAlerts() []groupAlerts {
|
||||
return gAlerts
|
||||
}
|
||||
|
||||
func (rh *requestHandler) listAlerts() ([]byte, error) {
|
||||
func (rh *requestHandler) listAlerts(rf *rulesFilter) ([]byte, error) {
|
||||
rh.m.groupsMu.RLock()
|
||||
defer rh.m.groupsMu.RUnlock()
|
||||
|
||||
lr := listAlertsResponse{Status: "success"}
|
||||
lr.Data.Alerts = make([]*apiAlert, 0)
|
||||
for _, g := range rh.m.groups {
|
||||
for _, r := range g.Rules {
|
||||
for _, group := range rh.m.groups {
|
||||
if !rf.matchesGroup(group) {
|
||||
continue
|
||||
}
|
||||
for _, r := range group.Rules {
|
||||
a, ok := r.(*rule.AlertingRule)
|
||||
if !ok {
|
||||
continue
|
||||
@@ -391,6 +440,42 @@ func (rh *requestHandler) listAlerts() ([]byte, error) {
|
||||
return b, nil
|
||||
}
|
||||
|
||||
type listNotifiersResponse struct {
|
||||
Status string `json:"status"`
|
||||
Data struct {
|
||||
Notifiers []*apiNotifier `json:"notifiers"`
|
||||
} `json:"data"`
|
||||
}
|
||||
|
||||
func (rh *requestHandler) listNotifiers() ([]byte, error) {
|
||||
targets := notifier.GetTargets()
|
||||
|
||||
lr := listNotifiersResponse{Status: "success"}
|
||||
lr.Data.Notifiers = make([]*apiNotifier, 0)
|
||||
for protoName, protoTargets := range targets {
|
||||
notifier := &apiNotifier{
|
||||
Kind: string(protoName),
|
||||
Targets: make([]*apiTarget, 0, len(protoTargets)),
|
||||
}
|
||||
for _, target := range protoTargets {
|
||||
notifier.Targets = append(notifier.Targets, &apiTarget{
|
||||
Address: target.Notifier.Addr(),
|
||||
Labels: target.Labels.ToMap(),
|
||||
})
|
||||
}
|
||||
lr.Data.Notifiers = append(lr.Data.Notifiers, notifier)
|
||||
}
|
||||
|
||||
b, err := json.Marshal(lr)
|
||||
if err != nil {
|
||||
return nil, &httpserver.ErrorWithStatusCode{
|
||||
Err: fmt.Errorf(`error encoding list of notifiers: %w`, err),
|
||||
StatusCode: http.StatusInternalServerError,
|
||||
}
|
||||
}
|
||||
return b, nil
|
||||
}
|
||||
|
||||
func errResponse(err error, sc int) *httpserver.ErrorWithStatusCode {
|
||||
return &httpserver.ErrorWithStatusCode{
|
||||
Err: err,
|
||||
|
||||
@@ -93,18 +93,18 @@
|
||||
{%= tpl.Footer(r) %}
|
||||
{% endfunc %}
|
||||
|
||||
{% func ListGroups(r *http.Request, groups []apiGroup, filter string) %}
|
||||
{% func ListGroups(r *http.Request, groups []*apiGroup, filter string) %}
|
||||
{%code
|
||||
prefix := vmalertutil.Prefix(r.URL.Path)
|
||||
filters := map[string]string{
|
||||
"": "All",
|
||||
"unhealthy": "Unhealthy",
|
||||
"noMatch": "No Match",
|
||||
"nomatch": "No Match",
|
||||
}
|
||||
icons := map[string]string{
|
||||
"": "all",
|
||||
"unhealthy": "unhealthy",
|
||||
"noMatch": "nomatch",
|
||||
"nomatch": "nomatch",
|
||||
}
|
||||
currentText := filters[filter]
|
||||
currentIcon := icons[filter]
|
||||
|
||||
@@ -316,7 +316,7 @@ func Welcome(r *http.Request) string {
|
||||
}
|
||||
|
||||
//line app/vmalert/web.qtpl:96
|
||||
func StreamListGroups(qw422016 *qt422016.Writer, r *http.Request, groups []apiGroup, filter string) {
|
||||
func StreamListGroups(qw422016 *qt422016.Writer, r *http.Request, groups []*apiGroup, filter string) {
|
||||
//line app/vmalert/web.qtpl:96
|
||||
qw422016.N().S(`
|
||||
`)
|
||||
@@ -325,12 +325,12 @@ func StreamListGroups(qw422016 *qt422016.Writer, r *http.Request, groups []apiGr
|
||||
filters := map[string]string{
|
||||
"": "All",
|
||||
"unhealthy": "Unhealthy",
|
||||
"noMatch": "No Match",
|
||||
"nomatch": "No Match",
|
||||
}
|
||||
icons := map[string]string{
|
||||
"": "all",
|
||||
"unhealthy": "unhealthy",
|
||||
"noMatch": "nomatch",
|
||||
"nomatch": "nomatch",
|
||||
}
|
||||
currentText := filters[filter]
|
||||
currentIcon := icons[filter]
|
||||
@@ -722,7 +722,7 @@ func StreamListGroups(qw422016 *qt422016.Writer, r *http.Request, groups []apiGr
|
||||
}
|
||||
|
||||
//line app/vmalert/web.qtpl:222
|
||||
func WriteListGroups(qq422016 qtio422016.Writer, r *http.Request, groups []apiGroup, filter string) {
|
||||
func WriteListGroups(qq422016 qtio422016.Writer, r *http.Request, groups []*apiGroup, filter string) {
|
||||
//line app/vmalert/web.qtpl:222
|
||||
qw422016 := qt422016.AcquireWriter(qq422016)
|
||||
//line app/vmalert/web.qtpl:222
|
||||
@@ -733,7 +733,7 @@ func WriteListGroups(qq422016 qtio422016.Writer, r *http.Request, groups []apiGr
|
||||
}
|
||||
|
||||
//line app/vmalert/web.qtpl:222
|
||||
func ListGroups(r *http.Request, groups []apiGroup, filter string) string {
|
||||
func ListGroups(r *http.Request, groups []*apiGroup, filter string) string {
|
||||
//line app/vmalert/web.qtpl:222
|
||||
qb422016 := qt422016.AcquireByteBuffer()
|
||||
//line app/vmalert/web.qtpl:222
|
||||
|
||||
@@ -19,25 +19,34 @@ import (
|
||||
func TestHandler(t *testing.T) {
|
||||
fq := &datasource.FakeQuerier{}
|
||||
fq.Add(datasource.Metric{
|
||||
Values: []float64{1}, Timestamps: []int64{0},
|
||||
Values: []float64{1},
|
||||
Timestamps: []int64{0},
|
||||
})
|
||||
g := rule.NewGroup(config.Group{
|
||||
Name: "group",
|
||||
File: "rules.yaml",
|
||||
Concurrency: 1,
|
||||
Rules: []config.Rule{
|
||||
{ID: 0, Alert: "alert"},
|
||||
{ID: 1, Record: "record"},
|
||||
},
|
||||
}, fq, 1*time.Minute, nil)
|
||||
ar := g.Rules[0].(*rule.AlertingRule)
|
||||
rr := g.Rules[1].(*rule.RecordingRule)
|
||||
|
||||
g.ExecOnce(context.Background(), func() []notifier.Notifier { return nil }, nil, time.Time{})
|
||||
|
||||
m := &manager{groups: map[uint64]*rule.Group{
|
||||
g.CreateID(): g,
|
||||
}}
|
||||
m := &manager{groups: map[uint64]*rule.Group{}}
|
||||
var ar *rule.AlertingRule
|
||||
var rr *rule.RecordingRule
|
||||
for _, dsType := range []string{"prometheus", "", "graphite"} {
|
||||
g := rule.NewGroup(config.Group{
|
||||
Name: "group",
|
||||
File: "rules.yaml",
|
||||
Type: config.NewRawType(dsType),
|
||||
Concurrency: 1,
|
||||
Rules: []config.Rule{
|
||||
{
|
||||
ID: 0,
|
||||
Alert: "alert",
|
||||
},
|
||||
{
|
||||
ID: 1,
|
||||
Record: "record",
|
||||
},
|
||||
},
|
||||
}, fq, 1*time.Minute, nil)
|
||||
ar = g.Rules[0].(*rule.AlertingRule)
|
||||
rr = g.Rules[1].(*rule.RecordingRule)
|
||||
g.ExecOnce(context.Background(), func() []notifier.Notifier { return nil }, nil, time.Time{})
|
||||
m.groups[g.CreateID()] = g
|
||||
}
|
||||
rh := &requestHandler{m: m}
|
||||
|
||||
getResp := func(t *testing.T, url string, to any, code int) {
|
||||
@@ -54,7 +63,7 @@ func TestHandler(t *testing.T) {
|
||||
t.Fatalf("err closing body %s", err)
|
||||
}
|
||||
}()
|
||||
if to != nil {
|
||||
if to != nil && code < 300 {
|
||||
if err = json.NewDecoder(resp.Body).Decode(to); err != nil {
|
||||
t.Fatalf("unexpected err %s", err)
|
||||
}
|
||||
@@ -95,14 +104,23 @@ func TestHandler(t *testing.T) {
|
||||
t.Run("/api/v1/alerts", func(t *testing.T) {
|
||||
lr := listAlertsResponse{}
|
||||
getResp(t, ts.URL+"/api/v1/alerts", &lr, 200)
|
||||
if length := len(lr.Data.Alerts); length != 1 {
|
||||
t.Fatalf("expected 1 alert got %d", length)
|
||||
if length := len(lr.Data.Alerts); length != 3 {
|
||||
t.Fatalf("expected 3 alert got %d", length)
|
||||
}
|
||||
|
||||
lr = listAlertsResponse{}
|
||||
getResp(t, ts.URL+"/vmalert/api/v1/alerts", &lr, 200)
|
||||
if length := len(lr.Data.Alerts); length != 1 {
|
||||
t.Fatalf("expected 1 alert got %d", length)
|
||||
if length := len(lr.Data.Alerts); length != 3 {
|
||||
t.Fatalf("expected 3 alert got %d", length)
|
||||
}
|
||||
|
||||
lr = listAlertsResponse{}
|
||||
getResp(t, ts.URL+"/api/v1/alerts?datasource_type=test", &lr, 400)
|
||||
|
||||
lr = listAlertsResponse{}
|
||||
getResp(t, ts.URL+"/api/v1/alerts?datasource_type=prometheus", &lr, 200)
|
||||
if length := len(lr.Data.Alerts); length != 2 {
|
||||
t.Fatalf("expected 2 alert got %d", length)
|
||||
}
|
||||
})
|
||||
t.Run("/api/v1/alert?alertID&groupID", func(t *testing.T) {
|
||||
@@ -138,14 +156,14 @@ func TestHandler(t *testing.T) {
|
||||
t.Run("/api/v1/rules", func(t *testing.T) {
|
||||
lr := listGroupsResponse{}
|
||||
getResp(t, ts.URL+"/api/v1/rules", &lr, 200)
|
||||
if length := len(lr.Data.Groups); length != 1 {
|
||||
t.Fatalf("expected 1 group got %d", length)
|
||||
if length := len(lr.Data.Groups); length != 3 {
|
||||
t.Fatalf("expected 3 group got %d", length)
|
||||
}
|
||||
|
||||
lr = listGroupsResponse{}
|
||||
getResp(t, ts.URL+"/vmalert/api/v1/rules", &lr, 200)
|
||||
if length := len(lr.Data.Groups); length != 1 {
|
||||
t.Fatalf("expected 1 group got %d", length)
|
||||
if length := len(lr.Data.Groups); length != 3 {
|
||||
t.Fatalf("expected 3 group got %d", length)
|
||||
}
|
||||
})
|
||||
t.Run("/api/v1/rule?ruleID&groupID", func(t *testing.T) {
|
||||
@@ -172,10 +190,10 @@ func TestHandler(t *testing.T) {
|
||||
})
|
||||
|
||||
t.Run("/api/v1/rules&filters", func(t *testing.T) {
|
||||
check := func(url string, expGroups, expRules int) {
|
||||
check := func(url string, statusCode, expGroups, expRules int) {
|
||||
t.Helper()
|
||||
lr := listGroupsResponse{}
|
||||
getResp(t, ts.URL+url, &lr, 200)
|
||||
getResp(t, ts.URL+url, &lr, statusCode)
|
||||
if length := len(lr.Data.Groups); length != expGroups {
|
||||
t.Fatalf("expected %d groups got %d", expGroups, length)
|
||||
}
|
||||
@@ -191,25 +209,31 @@ func TestHandler(t *testing.T) {
|
||||
}
|
||||
}
|
||||
|
||||
check("/api/v1/rules?type=alert", 1, 1)
|
||||
check("/api/v1/rules?type=record", 1, 1)
|
||||
check("/api/v1/rules?type=alert", 200, 3, 3)
|
||||
check("/api/v1/rules?type=record", 200, 3, 3)
|
||||
check("/api/v1/rules?type=records", 400, 0, 0)
|
||||
|
||||
check("/vmalert/api/v1/rules?type=alert", 1, 1)
|
||||
check("/vmalert/api/v1/rules?type=record", 1, 1)
|
||||
check("/vmalert/api/v1/rules?type=alert", 200, 3, 3)
|
||||
check("/vmalert/api/v1/rules?type=record", 200, 3, 3)
|
||||
check("/vmalert/api/v1/rules?type=recording", 400, 0, 0)
|
||||
|
||||
check("/vmalert/api/v1/rules?datasource_type=prometheus", 200, 2, 4)
|
||||
check("/vmalert/api/v1/rules?datasource_type=graphite", 200, 1, 2)
|
||||
check("/vmalert/api/v1/rules?datasource_type=graphiti", 400, 0, 0)
|
||||
|
||||
// no filtering expected due to bad params
|
||||
check("/api/v1/rules?type=badParam", 1, 2)
|
||||
check("/api/v1/rules?foo=bar", 1, 2)
|
||||
check("/api/v1/rules?type=badParam", 400, 0, 0)
|
||||
check("/api/v1/rules?foo=bar", 200, 3, 6)
|
||||
|
||||
check("/api/v1/rules?rule_group[]=foo&rule_group[]=bar", 0, 0)
|
||||
check("/api/v1/rules?rule_group[]=foo&rule_group[]=group&rule_group[]=bar", 1, 2)
|
||||
check("/api/v1/rules?rule_group[]=foo&rule_group[]=bar", 200, 0, 0)
|
||||
check("/api/v1/rules?rule_group[]=foo&rule_group[]=group&rule_group[]=bar", 200, 3, 6)
|
||||
|
||||
check("/api/v1/rules?rule_group[]=group&file[]=foo", 0, 0)
|
||||
check("/api/v1/rules?rule_group[]=group&file[]=rules.yaml", 1, 2)
|
||||
check("/api/v1/rules?rule_group[]=group&file[]=foo", 200, 0, 0)
|
||||
check("/api/v1/rules?rule_group[]=group&file[]=rules.yaml", 200, 3, 6)
|
||||
|
||||
check("/api/v1/rules?rule_group[]=group&file[]=rules.yaml&rule_name[]=foo", 1, 0)
|
||||
check("/api/v1/rules?rule_group[]=group&file[]=rules.yaml&rule_name[]=alert", 1, 1)
|
||||
check("/api/v1/rules?rule_group[]=group&file[]=rules.yaml&rule_name[]=alert&rule_name[]=record", 1, 2)
|
||||
check("/api/v1/rules?rule_group[]=group&file[]=rules.yaml&rule_name[]=foo", 200, 3, 0)
|
||||
check("/api/v1/rules?rule_group[]=group&file[]=rules.yaml&rule_name[]=alert", 200, 3, 3)
|
||||
check("/api/v1/rules?rule_group[]=group&file[]=rules.yaml&rule_name[]=alert&rule_name[]=record", 200, 3, 6)
|
||||
})
|
||||
t.Run("/api/v1/rules&exclude_alerts=true", func(t *testing.T) {
|
||||
// check if response returns active alerts by default
|
||||
@@ -259,7 +283,7 @@ func TestEmptyResponse(t *testing.T) {
|
||||
t.Fatalf("err closing body %s", err)
|
||||
}
|
||||
}()
|
||||
if to != nil {
|
||||
if to != nil && code < 300 {
|
||||
if err = json.NewDecoder(resp.Body).Decode(to); err != nil {
|
||||
t.Fatalf("unexpected err %s", err)
|
||||
}
|
||||
|
||||
@@ -20,6 +20,16 @@ const (
|
||||
paramRuleID = "rule_id"
|
||||
)
|
||||
|
||||
type apiNotifier struct {
|
||||
Kind string `json:"kind"`
|
||||
Targets []*apiTarget `json:"targets"`
|
||||
}
|
||||
|
||||
type apiTarget struct {
|
||||
Address string `json:"address"`
|
||||
Labels map[string]string `json:"labels"`
|
||||
}
|
||||
|
||||
// apiAlert represents a notifier.AlertingRule state
|
||||
// for WEB view
|
||||
// https://github.com/prometheus/compliance/blob/main/alert_generator/specification.md#get-apiv1rules
|
||||
@@ -108,7 +118,7 @@ type apiGroup struct {
|
||||
|
||||
// groupAlerts represents a group of alerts for WEB view
|
||||
type groupAlerts struct {
|
||||
Group apiGroup
|
||||
Group *apiGroup
|
||||
Alerts []*apiAlert
|
||||
}
|
||||
|
||||
@@ -327,7 +337,7 @@ func newAlertAPI(ar *rule.AlertingRule, a *notifier.Alert) *apiAlert {
|
||||
return aa
|
||||
}
|
||||
|
||||
func groupToAPI(g *rule.Group) apiGroup {
|
||||
func groupToAPI(g *rule.Group) *apiGroup {
|
||||
g = g.DeepCopy()
|
||||
ag := apiGroup{
|
||||
// encode as string to avoid rounding
|
||||
@@ -353,7 +363,7 @@ func groupToAPI(g *rule.Group) apiGroup {
|
||||
for _, r := range g.Rules {
|
||||
ag.Rules = append(ag.Rules, ruleToAPI(r))
|
||||
}
|
||||
return ag
|
||||
return &ag
|
||||
}
|
||||
|
||||
func urlValuesToStrings(values url.Values) []string {
|
||||
|
||||
@@ -70,7 +70,7 @@ var (
|
||||
Usage: "VictoriaMetrics address to perform import requests. \n" +
|
||||
"Should be the same as --httpListenAddr value for single-node version or vminsert component. \n" +
|
||||
"When importing into the clustered version do not forget to set additionally --vm-account-id flag. \n" +
|
||||
"Please note, that `vmctl` performs initial readiness check for the given address by checking `/health` endpoint.",
|
||||
"Please note, that vmctl performs initial readiness check for the given address by checking /health endpoint.",
|
||||
},
|
||||
&cli.StringFlag{
|
||||
Name: vmUser,
|
||||
@@ -514,27 +514,27 @@ var (
|
||||
},
|
||||
&cli.StringFlag{
|
||||
Name: vmNativeSrcBearerToken,
|
||||
Usage: "Optional bearer auth token to use for the corresponding `--vm-native-src-addr`",
|
||||
Usage: "Optional bearer auth token to use for the corresponding --vm-native-src-addr",
|
||||
},
|
||||
&cli.StringFlag{
|
||||
Name: vmNativeSrcCertFile,
|
||||
Usage: "Optional path to client-side TLS certificate file to use when connecting to `--vm-native-src-addr`",
|
||||
Usage: "Optional path to client-side TLS certificate file to use when connecting to --vm-native-src-addr",
|
||||
},
|
||||
&cli.StringFlag{
|
||||
Name: vmNativeSrcKeyFile,
|
||||
Usage: "Optional path to client-side TLS key to use when connecting to `--vm-native-src-addr`",
|
||||
Usage: "Optional path to client-side TLS key to use when connecting to --vm-native-src-addr",
|
||||
},
|
||||
&cli.StringFlag{
|
||||
Name: vmNativeSrcCAFile,
|
||||
Usage: "Optional path to TLS CA file to use for verifying connections to `--vm-native-src-addr`. By default, system CA is used",
|
||||
Usage: "Optional path to TLS CA file to use for verifying connections to --vm-native-src-addr. By default, system CA is used",
|
||||
},
|
||||
&cli.StringFlag{
|
||||
Name: vmNativeSrcServerName,
|
||||
Usage: "Optional TLS server name to use for connections to `--vm-native-src-addr`. By default, the server name from `--vm-native-src-addr` is used",
|
||||
Usage: "Optional TLS server name to use for connections to --vm-native-src-addr. By default, the server name from --vm-native-src-addr is used",
|
||||
},
|
||||
&cli.BoolFlag{
|
||||
Name: vmNativeSrcInsecureSkipVerify,
|
||||
Usage: "Whether to skip TLS certificate verification when connecting to `--vm-native-src-addr`",
|
||||
Usage: "Whether to skip TLS certificate verification when connecting to --vm-native-src-addr",
|
||||
Value: false,
|
||||
},
|
||||
|
||||
@@ -563,27 +563,27 @@ var (
|
||||
},
|
||||
&cli.StringFlag{
|
||||
Name: vmNativeDstBearerToken,
|
||||
Usage: "Optional bearer auth token to use for the corresponding `--vm-native-dst-addr`",
|
||||
Usage: "Optional bearer auth token to use for the corresponding --vm-native-dst-addr",
|
||||
},
|
||||
&cli.StringFlag{
|
||||
Name: vmNativeDstCertFile,
|
||||
Usage: "Optional path to client-side TLS certificate file to use when connecting to `--vm-native-dst-addr`",
|
||||
Usage: "Optional path to client-side TLS certificate file to use when connecting to --vm-native-dst-addr",
|
||||
},
|
||||
&cli.StringFlag{
|
||||
Name: vmNativeDstKeyFile,
|
||||
Usage: "Optional path to client-side TLS key to use when connecting to `--vm-native-dst-addr`",
|
||||
Usage: "Optional path to client-side TLS key to use when connecting to --vm-native-dst-addr",
|
||||
},
|
||||
&cli.StringFlag{
|
||||
Name: vmNativeDstCAFile,
|
||||
Usage: "Optional path to TLS CA file to use for verifying connections to `--vm-native-dst-addr`. By default, system CA is used",
|
||||
Usage: "Optional path to TLS CA file to use for verifying connections to --vm-native-dst-addr. By default, system CA is used",
|
||||
},
|
||||
&cli.StringFlag{
|
||||
Name: vmNativeDstServerName,
|
||||
Usage: "Optional TLS server name to use for connections to `--vm-native-dst-addr`. By default, the server name from `--vm-native-dst-addr` is used",
|
||||
Usage: "Optional TLS server name to use for connections to --vm-native-dst-addr. By default, the server name from --vm-native-dst-addr is used",
|
||||
},
|
||||
&cli.BoolFlag{
|
||||
Name: vmNativeDstInsecureSkipVerify,
|
||||
Usage: "Whether to skip TLS certificate verification when connecting to `--vm-native-dst-addr`",
|
||||
Usage: "Whether to skip TLS certificate verification when connecting to --vm-native-dst-addr",
|
||||
Value: false,
|
||||
},
|
||||
|
||||
@@ -597,7 +597,7 @@ var (
|
||||
Name: vmRateLimit,
|
||||
Usage: "Optional data transfer rate limit in bytes per second.\n" +
|
||||
"By default, the rate limit is disabled. It can be useful for limiting load on source or destination databases. \n" +
|
||||
"Rate limit is applied per worker, see `--vm-concurrency`.",
|
||||
"Rate limit is applied per worker, see --vm-concurrency.",
|
||||
},
|
||||
&cli.BoolFlag{
|
||||
Name: vmInterCluster,
|
||||
|
||||
@@ -8,8 +8,6 @@ import (
|
||||
"strings"
|
||||
"time"
|
||||
|
||||
"github.com/VictoriaMetrics/metrics"
|
||||
|
||||
"github.com/VictoriaMetrics/VictoriaMetrics/app/vminsert/common"
|
||||
"github.com/VictoriaMetrics/VictoriaMetrics/app/vminsert/csvimport"
|
||||
"github.com/VictoriaMetrics/VictoriaMetrics/app/vminsert/datadogsketches"
|
||||
@@ -36,6 +34,7 @@ import (
|
||||
influxserver "github.com/VictoriaMetrics/VictoriaMetrics/lib/ingestserver/influx"
|
||||
opentsdbserver "github.com/VictoriaMetrics/VictoriaMetrics/lib/ingestserver/opentsdb"
|
||||
opentsdbhttpserver "github.com/VictoriaMetrics/VictoriaMetrics/lib/ingestserver/opentsdbhttp"
|
||||
"github.com/VictoriaMetrics/VictoriaMetrics/lib/memory"
|
||||
"github.com/VictoriaMetrics/VictoriaMetrics/lib/procutil"
|
||||
"github.com/VictoriaMetrics/VictoriaMetrics/lib/prompbmarshal"
|
||||
"github.com/VictoriaMetrics/VictoriaMetrics/lib/promscrape"
|
||||
@@ -43,6 +42,7 @@ import (
|
||||
"github.com/VictoriaMetrics/VictoriaMetrics/lib/protoparser/protoparserutil"
|
||||
"github.com/VictoriaMetrics/VictoriaMetrics/lib/stringsutil"
|
||||
"github.com/VictoriaMetrics/VictoriaMetrics/lib/timeserieslimits"
|
||||
"github.com/VictoriaMetrics/metrics"
|
||||
)
|
||||
|
||||
var (
|
||||
@@ -70,6 +70,7 @@ var (
|
||||
maxLabelsPerTimeseries = flag.Int("maxLabelsPerTimeseries", 40, "The maximum number of labels per time series to be accepted. Series with superfluous labels are ignored. In this case the vm_rows_ignored_total{reason=\"too_many_labels\"} metric at /metrics page is incremented")
|
||||
maxLabelNameLen = flag.Int("maxLabelNameLen", 256, "The maximum length of label name in the accepted time series. Series with longer label name are ignored. In this case the vm_rows_ignored_total{reason=\"too_long_label_name\"} metric at /metrics page is incremented")
|
||||
maxLabelValueLen = flag.Int("maxLabelValueLen", 4*1024, "The maximum length of label values in the accepted time series. Series with longer label value are ignored. In this case the vm_rows_ignored_total{reason=\"too_long_label_value\"} metric at /metrics page is incremented")
|
||||
maxMemoryUsage = flag.Int("insert.circuitBreakMemoryUsage", 90, "Reject insert requests when memory usage exceeds a certain percentage. 0 means no circuit breaking. An integer value from 1-100 represents 1%-100%.")
|
||||
)
|
||||
|
||||
var (
|
||||
@@ -131,6 +132,13 @@ func RequestHandler(w http.ResponseWriter, r *http.Request) bool {
|
||||
startTime := time.Now()
|
||||
defer requestDuration.UpdateDuration(startTime)
|
||||
|
||||
if *maxMemoryUsage >= 1 && *maxMemoryUsage <= 100 {
|
||||
if memory.CurrentPercentage() > *maxMemoryUsage {
|
||||
httpserver.Errorf(w, r, "server overloaded, request rejected by circuit breaker")
|
||||
return true
|
||||
}
|
||||
}
|
||||
|
||||
path := strings.Replace(r.URL.Path, "//", "/", -1)
|
||||
if strings.HasPrefix(path, "/static") {
|
||||
staticServer.ServeHTTP(w, r)
|
||||
|
||||
@@ -2,9 +2,9 @@
|
||||
<html lang="en">
|
||||
<head>
|
||||
<meta charset="utf-8"/>
|
||||
<link rel="icon" href="/favicon.svg" />
|
||||
<link rel="apple-touch-icon" href="/favicon.svg" />
|
||||
<link rel="mask-icon" href="/favicon.svg" color="#000000">
|
||||
<link rel="icon" href="/favicon.victorialogs.svg" />
|
||||
<link rel="apple-touch-icon" href="/favicon.victorialogs.svg" />
|
||||
<link rel="mask-icon" href="/favicon.victorialogs.svg" color="#000000">
|
||||
|
||||
<meta name="viewport" content="width=device-width, initial-scale=1, maximum-scale=5"/>
|
||||
<meta name="theme-color" content="#000000"/>
|
||||
|
||||
5
app/vmui/packages/vmui/public/favicon.victorialogs.svg
Normal file
@@ -0,0 +1,5 @@
|
||||
<svg width="48" height="48" fill="#e94600" xmlns="http://www.w3.org/2000/svg">
|
||||
<path d="M24.5475 0C10.3246.0265251 1.11379 3.06365 4.40623 6.10077c0 0 12.32997 11.23333 16.58217 14.84083.8131.6896 2.1728 1.1936 3.5191 1.2201h.1199c1.3463-.0265 2.706-.5305 3.5191-1.2201 4.2522-3.5942 16.5422-14.84083 16.5422-14.84083C48.0478 3.06365 38.8636.0265251 24.6674 0"/>
|
||||
<path d="M28.1579 27.0159c-.8131.6896-2.1728 1.1936-3.5191 1.2201h-.12c-1.3463-.0265-2.7059-.5305-3.519-1.2201-2.9725-2.5067-13.35639-11.87-17.26201-15.3979v5.4112c0 .5968.22661 1.3793.6265 1.7506C7.00358 21.1936 17.2675 30.5437 20.9731 33.6737c.8132.6896 2.1728 1.1936 3.5191 1.2201h.12c1.3463-.0265 2.7059-.5305 3.519-1.2201 3.679-3.13 13.9429-12.4536 16.6089-14.8939.4132-.3713.6265-1.1538.6265-1.7506V11.618c-3.9323 3.5411-14.3162 12.931-17.2354 15.3979h.0267Z"/>
|
||||
<path d="M28.1579 39.748c-.8131.6897-2.1728 1.1937-3.5191 1.2202h-.12c-1.3463-.0265-2.7059-.5305-3.519-1.2202-2.9725-2.4933-13.35639-11.8567-17.26201-15.3978v5.4111c0 .5969.22661 1.3793.6265 1.7507C7.00358 33.9258 17.2675 43.2759 20.9731 46.4058c.8132.6897 2.1728 1.1937 3.5191 1.2202h.12c1.3463-.0265 2.7059-.5305 3.519-1.2202 3.679-3.1299 13.9429-12.4535 16.6089-14.8938.4132-.3714.6265-1.1538.6265-1.7507v-5.4111c-3.9323 3.5411-14.3162 12.931-17.2354 15.3978h.0267Z"/>
|
||||
</svg>
|
||||
|
After Width: | Height: | Size: 1.3 KiB |
@@ -3409,7 +3409,7 @@
|
||||
},
|
||||
"editorMode": "code",
|
||||
"exemplar": false,
|
||||
"expr": "topk_max(10, sum(sum_over_time(scrape_series_added[5m])) by (job)) > 0",
|
||||
"expr": "topk(10, sum(sum_over_time(scrape_series_added[5m])) by (job)) > 0",
|
||||
"interval": "",
|
||||
"legendFormat": "{{ job }}",
|
||||
"range": true,
|
||||
|
||||
@@ -115,13 +115,14 @@
|
||||
"mappings": [
|
||||
{
|
||||
"options": {
|
||||
"0": {
|
||||
"match": "null",
|
||||
"result": {
|
||||
"color": "green",
|
||||
"index": 0,
|
||||
"text": "Ok"
|
||||
}
|
||||
},
|
||||
"type": "value"
|
||||
"type": "special"
|
||||
},
|
||||
{
|
||||
"options": {
|
||||
@@ -140,8 +141,7 @@
|
||||
"mode": "absolute",
|
||||
"steps": [
|
||||
{
|
||||
"color": "green",
|
||||
"value": null
|
||||
"color": "green"
|
||||
}
|
||||
]
|
||||
}
|
||||
@@ -173,17 +173,19 @@
|
||||
"textMode": "auto",
|
||||
"wideLayout": true
|
||||
},
|
||||
"pluginVersion": "11.5.0",
|
||||
"pluginVersion": "12.0.2",
|
||||
"targets": [
|
||||
{
|
||||
"datasource": {
|
||||
"type": "victoriametrics-metrics-datasource",
|
||||
"uid": "$ds"
|
||||
},
|
||||
"editorMode": "code",
|
||||
"exemplar": false,
|
||||
"expr": "count(vmalert_config_last_reload_successful{job=~\"$job\", instance=~\"$instance\"} < 1 ) or 0",
|
||||
"expr": "count(vmalert_config_last_reload_successful{job=~\"$job\", instance=~\"$instance\"} < 1 )",
|
||||
"interval": "",
|
||||
"legendFormat": "",
|
||||
"range": true,
|
||||
"refId": "A"
|
||||
}
|
||||
],
|
||||
@@ -204,8 +206,7 @@
|
||||
"mode": "absolute",
|
||||
"steps": [
|
||||
{
|
||||
"color": "green",
|
||||
"value": null
|
||||
"color": "green"
|
||||
}
|
||||
]
|
||||
}
|
||||
@@ -237,7 +238,7 @@
|
||||
"textMode": "auto",
|
||||
"wideLayout": true
|
||||
},
|
||||
"pluginVersion": "11.5.0",
|
||||
"pluginVersion": "12.0.2",
|
||||
"targets": [
|
||||
{
|
||||
"datasource": {
|
||||
@@ -268,8 +269,7 @@
|
||||
"mode": "absolute",
|
||||
"steps": [
|
||||
{
|
||||
"color": "green",
|
||||
"value": null
|
||||
"color": "green"
|
||||
}
|
||||
]
|
||||
}
|
||||
@@ -301,7 +301,7 @@
|
||||
"textMode": "auto",
|
||||
"wideLayout": true
|
||||
},
|
||||
"pluginVersion": "11.5.0",
|
||||
"pluginVersion": "12.0.2",
|
||||
"targets": [
|
||||
{
|
||||
"datasource": {
|
||||
@@ -332,8 +332,7 @@
|
||||
"mode": "absolute",
|
||||
"steps": [
|
||||
{
|
||||
"color": "green",
|
||||
"value": null
|
||||
"color": "green"
|
||||
},
|
||||
{
|
||||
"color": "red",
|
||||
@@ -369,17 +368,19 @@
|
||||
"textMode": "auto",
|
||||
"wideLayout": true
|
||||
},
|
||||
"pluginVersion": "11.5.0",
|
||||
"pluginVersion": "12.0.2",
|
||||
"targets": [
|
||||
{
|
||||
"datasource": {
|
||||
"type": "victoriametrics-metrics-datasource",
|
||||
"uid": "$ds"
|
||||
},
|
||||
"editorMode": "code",
|
||||
"exemplar": false,
|
||||
"expr": "(sum(increase(vmalert_alerting_rules_errors_total{job=~\"$job\", instance=~\"$instance\", group=~\"$group\", file=~\"$file\"}[$__rate_interval])) or vector(0)) + \n(sum(increase(vmalert_recording_rules_errors_total{job=~\"$job\", instance=~\"$instance\", group=~\"$group\", file=~\"$file\"}[$__rate_interval])) or vector(0))",
|
||||
"expr": "(sum(increase(vmalert_alerting_rules_errors_total{job=~\"$job\", instance=~\"$instance\", group=~\"$group\", file=~\"$file\"}[$__rate_interval]))) + \n(sum(increase(vmalert_recording_rules_errors_total{job=~\"$job\", instance=~\"$instance\", group=~\"$group\", file=~\"$file\"}[$__rate_interval])))",
|
||||
"interval": "",
|
||||
"legendFormat": "",
|
||||
"range": true,
|
||||
"refId": "A"
|
||||
}
|
||||
],
|
||||
@@ -394,14 +395,24 @@
|
||||
"description": "Shows number of Recording Rules which produce no data.\n\n Usually it means that such rules are misconfigured, since they give no output during the evaluation.\nPlease check if rule's expression is correct and it is working as expected.",
|
||||
"fieldConfig": {
|
||||
"defaults": {
|
||||
"mappings": [],
|
||||
"mappings": [
|
||||
{
|
||||
"options": {
|
||||
"match": "null",
|
||||
"result": {
|
||||
"index": 1,
|
||||
"text": "0"
|
||||
}
|
||||
},
|
||||
"type": "special"
|
||||
}
|
||||
],
|
||||
"min": 0,
|
||||
"thresholds": {
|
||||
"mode": "absolute",
|
||||
"steps": [
|
||||
{
|
||||
"color": "green",
|
||||
"value": null
|
||||
"color": "green"
|
||||
},
|
||||
{
|
||||
"color": "red",
|
||||
@@ -437,7 +448,7 @@
|
||||
"textMode": "auto",
|
||||
"wideLayout": true
|
||||
},
|
||||
"pluginVersion": "11.5.0",
|
||||
"pluginVersion": "12.0.2",
|
||||
"targets": [
|
||||
{
|
||||
"datasource": {
|
||||
@@ -446,7 +457,7 @@
|
||||
},
|
||||
"editorMode": "code",
|
||||
"exemplar": false,
|
||||
"expr": "count(vmalert_recording_rules_last_evaluation_samples{job=~\"$job\", instance=~\"$instance\"} < 1) or 0",
|
||||
"expr": "count(vmalert_recording_rules_last_evaluation_samples{job=~\"$job\", instance=~\"$instance\"} < 1)",
|
||||
"interval": "",
|
||||
"legendFormat": "",
|
||||
"range": true,
|
||||
@@ -479,8 +490,7 @@
|
||||
"mode": "absolute",
|
||||
"steps": [
|
||||
{
|
||||
"color": "green",
|
||||
"value": null
|
||||
"color": "green"
|
||||
},
|
||||
{
|
||||
"color": "red",
|
||||
@@ -535,7 +545,7 @@
|
||||
},
|
||||
"showHeader": true
|
||||
},
|
||||
"pluginVersion": "11.5.0",
|
||||
"pluginVersion": "12.0.2",
|
||||
"targets": [
|
||||
{
|
||||
"datasource": {
|
||||
@@ -605,8 +615,7 @@
|
||||
"mode": "absolute",
|
||||
"steps": [
|
||||
{
|
||||
"color": "green",
|
||||
"value": null
|
||||
"color": "green"
|
||||
},
|
||||
{
|
||||
"color": "red",
|
||||
@@ -642,7 +651,7 @@
|
||||
"sort": "asc"
|
||||
}
|
||||
},
|
||||
"pluginVersion": "11.5.0",
|
||||
"pluginVersion": "12.0.2",
|
||||
"targets": [
|
||||
{
|
||||
"datasource": {
|
||||
@@ -724,8 +733,7 @@
|
||||
"mode": "absolute",
|
||||
"steps": [
|
||||
{
|
||||
"color": "green",
|
||||
"value": null
|
||||
"color": "green"
|
||||
},
|
||||
{
|
||||
"color": "red",
|
||||
@@ -763,7 +771,7 @@
|
||||
"sort": "desc"
|
||||
}
|
||||
},
|
||||
"pluginVersion": "11.5.0",
|
||||
"pluginVersion": "12.0.2",
|
||||
"targets": [
|
||||
{
|
||||
"datasource": {
|
||||
@@ -787,7 +795,7 @@
|
||||
"type": "victoriametrics-metrics-datasource",
|
||||
"uid": "$ds"
|
||||
},
|
||||
"description": "Top $topk groups by evaluation duration. Shows groups that take the most of time during the evaluation across all instances.\n\nThe panel uses MetricsQL functions and may not work with VictoriaMetrics.",
|
||||
"description": "Top $topk groups by evaluation duration. Shows groups that take the most of time during the evaluation across all instances.",
|
||||
"fieldConfig": {
|
||||
"defaults": {
|
||||
"color": {
|
||||
@@ -831,8 +839,7 @@
|
||||
"mode": "absolute",
|
||||
"steps": [
|
||||
{
|
||||
"color": "green",
|
||||
"value": null
|
||||
"color": "green"
|
||||
},
|
||||
{
|
||||
"color": "red",
|
||||
@@ -870,7 +877,7 @@
|
||||
"sort": "desc"
|
||||
}
|
||||
},
|
||||
"pluginVersion": "11.5.0",
|
||||
"pluginVersion": "12.0.2",
|
||||
"targets": [
|
||||
{
|
||||
"datasource": {
|
||||
@@ -879,7 +886,7 @@
|
||||
},
|
||||
"editorMode": "code",
|
||||
"exemplar": false,
|
||||
"expr": "topk_max($topk, max(sum(\n rate(vmalert_iteration_duration_seconds_sum{job=~\"$job\", instance=~\"$instance\", group=~\"$group\", file=~\"$file\"}[$__rate_interval])\n/\n rate(vmalert_iteration_duration_seconds_count{job=~\"$job\", instance=~\"$instance\", group=~\"$group\", file=~\"$file\"}[$__rate_interval])\n) by(job, instance, group, file)) \nby(job, group, file))",
|
||||
"expr": "topk($topk, max(sum(\n rate(vmalert_iteration_duration_seconds_sum{job=~\"$job\", instance=~\"$instance\", group=~\"$group\", file=~\"$file\"}[$__rate_interval])\n/\n rate(vmalert_iteration_duration_seconds_count{job=~\"$job\", instance=~\"$instance\", group=~\"$group\", file=~\"$file\"}[$__rate_interval])\n) by(job, instance, group, file)) \nby(job, group, file))",
|
||||
"interval": "",
|
||||
"legendFormat": "({{job}}) {{group}}({{file}})",
|
||||
"range": true,
|
||||
@@ -938,8 +945,7 @@
|
||||
"mode": "absolute",
|
||||
"steps": [
|
||||
{
|
||||
"color": "green",
|
||||
"value": null
|
||||
"color": "green"
|
||||
},
|
||||
{
|
||||
"color": "red",
|
||||
@@ -975,7 +981,7 @@
|
||||
"sort": "desc"
|
||||
}
|
||||
},
|
||||
"pluginVersion": "11.5.0",
|
||||
"pluginVersion": "12.0.2",
|
||||
"targets": [
|
||||
{
|
||||
"datasource": {
|
||||
@@ -1043,8 +1049,7 @@
|
||||
"mode": "absolute",
|
||||
"steps": [
|
||||
{
|
||||
"color": "green",
|
||||
"value": null
|
||||
"color": "green"
|
||||
},
|
||||
{
|
||||
"color": "red",
|
||||
@@ -1080,7 +1085,7 @@
|
||||
"sort": "none"
|
||||
}
|
||||
},
|
||||
"pluginVersion": "11.5.0",
|
||||
"pluginVersion": "12.0.2",
|
||||
"targets": [
|
||||
{
|
||||
"datasource": {
|
||||
@@ -1160,8 +1165,7 @@
|
||||
"mode": "absolute",
|
||||
"steps": [
|
||||
{
|
||||
"color": "green",
|
||||
"value": null
|
||||
"color": "green"
|
||||
},
|
||||
{
|
||||
"color": "red",
|
||||
@@ -1276,8 +1280,7 @@
|
||||
"mode": "absolute",
|
||||
"steps": [
|
||||
{
|
||||
"color": "green",
|
||||
"value": null
|
||||
"color": "green"
|
||||
},
|
||||
{
|
||||
"color": "red",
|
||||
@@ -1394,8 +1397,7 @@
|
||||
"mode": "absolute",
|
||||
"steps": [
|
||||
{
|
||||
"color": "green",
|
||||
"value": null
|
||||
"color": "green"
|
||||
},
|
||||
{
|
||||
"color": "red",
|
||||
@@ -1503,8 +1505,7 @@
|
||||
"mode": "absolute",
|
||||
"steps": [
|
||||
{
|
||||
"color": "green",
|
||||
"value": null
|
||||
"color": "green"
|
||||
},
|
||||
{
|
||||
"color": "red",
|
||||
@@ -1637,8 +1638,7 @@
|
||||
"mode": "absolute",
|
||||
"steps": [
|
||||
{
|
||||
"color": "green",
|
||||
"value": null
|
||||
"color": "green"
|
||||
},
|
||||
{
|
||||
"color": "red",
|
||||
@@ -1754,8 +1754,7 @@
|
||||
"mode": "absolute",
|
||||
"steps": [
|
||||
{
|
||||
"color": "green",
|
||||
"value": null
|
||||
"color": "green"
|
||||
}
|
||||
]
|
||||
},
|
||||
@@ -1876,8 +1875,7 @@
|
||||
"mode": "absolute",
|
||||
"steps": [
|
||||
{
|
||||
"color": "green",
|
||||
"value": null
|
||||
"color": "green"
|
||||
}
|
||||
]
|
||||
},
|
||||
@@ -1997,8 +1995,7 @@
|
||||
"mode": "absolute",
|
||||
"steps": [
|
||||
{
|
||||
"color": "green",
|
||||
"value": null
|
||||
"color": "green"
|
||||
},
|
||||
{
|
||||
"color": "red",
|
||||
@@ -2106,8 +2103,7 @@
|
||||
"mode": "absolute",
|
||||
"steps": [
|
||||
{
|
||||
"color": "green",
|
||||
"value": null
|
||||
"color": "green"
|
||||
},
|
||||
{
|
||||
"color": "red",
|
||||
@@ -2216,8 +2212,7 @@
|
||||
"mode": "absolute",
|
||||
"steps": [
|
||||
{
|
||||
"color": "green",
|
||||
"value": null
|
||||
"color": "green"
|
||||
},
|
||||
{
|
||||
"color": "red",
|
||||
@@ -2325,8 +2320,7 @@
|
||||
"mode": "absolute",
|
||||
"steps": [
|
||||
{
|
||||
"color": "green",
|
||||
"value": null
|
||||
"color": "green"
|
||||
},
|
||||
{
|
||||
"color": "red",
|
||||
@@ -2434,8 +2428,7 @@
|
||||
"mode": "absolute",
|
||||
"steps": [
|
||||
{
|
||||
"color": "green",
|
||||
"value": null
|
||||
"color": "green"
|
||||
}
|
||||
]
|
||||
},
|
||||
@@ -2856,7 +2849,7 @@
|
||||
"type": "victoriametrics-metrics-datasource",
|
||||
"uid": "$ds"
|
||||
},
|
||||
"description": "Shows top $topk current active (firing) alerting rules.\n\nThe panel uses MetricsQL functions and may not work with VictoriaMetrics.",
|
||||
"description": "Shows top $topk current active (firing) alerting rules.",
|
||||
"fieldConfig": {
|
||||
"defaults": {
|
||||
"color": {
|
||||
@@ -2943,7 +2936,7 @@
|
||||
},
|
||||
"editorMode": "code",
|
||||
"exemplar": false,
|
||||
"expr": "topk_max($topk, sum(vmalert_alerts_firing{job=~\"$job\", instance=~\"$instance\", group=~\"$group\", file=~\"$file\"}) by(job, group, file, alertname) > 0)",
|
||||
"expr": "topk($topk, sum(vmalert_alerts_firing{job=~\"$job\", instance=~\"$instance\", group=~\"$group\", file=~\"$file\"}) by(job, group, file, alertname) > 0)",
|
||||
"interval": "",
|
||||
"legendFormat": "({{job}}) {{group}}.{{alertname}}({{file}})",
|
||||
"range": true,
|
||||
@@ -3376,7 +3369,7 @@
|
||||
"type": "victoriametrics-metrics-datasource",
|
||||
"uid": "$ds"
|
||||
},
|
||||
"description": "Shows the top $topk recording rules which generate the most of [samples](https://docs.victoriametrics.com/victoriametrics/keyconcepts/#raw-samples). Each generated sample is basically a time series which then ingested into configured remote storage. Rules with high numbers may cause the most pressure on the remote database and become a source of too high cardinality.\n\nThe panel uses MetricsQL functions and may not work with VictoriaMetrics.",
|
||||
"description": "Shows the top $topk recording rules which generate the most of [samples](https://docs.victoriametrics.com/victoriametrics/keyconcepts/#raw-samples). Each generated sample is basically a time series which then ingested into configured remote storage. Rules with high numbers may cause the most pressure on the remote database and become a source of too high cardinality.",
|
||||
"fieldConfig": {
|
||||
"defaults": {
|
||||
"color": {
|
||||
@@ -3463,7 +3456,7 @@
|
||||
},
|
||||
"editorMode": "code",
|
||||
"exemplar": false,
|
||||
"expr": "topk_max($topk, \n max(\n sum(vmalert_recording_rules_last_evaluation_samples{job=~\"$job\", instance=~\"$instance\", group=~\"$group\", file=~\"$file\"}) by(job, instance, group, file, recording) > 0\n ) by(job, group, file, recording)\n)",
|
||||
"expr": "topk($topk, \n max(\n sum(vmalert_recording_rules_last_evaluation_samples{job=~\"$job\", instance=~\"$instance\", group=~\"$group\", file=~\"$file\"}) by(job, instance, group, file, recording) > 0\n ) by(job, group, file, recording)\n)",
|
||||
"interval": "",
|
||||
"legendFormat": "({{job}}) {{group}}.{{recording}}({{file}})",
|
||||
"range": true,
|
||||
@@ -4084,7 +4077,7 @@
|
||||
],
|
||||
"preload": false,
|
||||
"refresh": "",
|
||||
"schemaVersion": 40,
|
||||
"schemaVersion": 41,
|
||||
"tags": [
|
||||
"victoriametrics"
|
||||
],
|
||||
@@ -4228,10 +4221,10 @@
|
||||
"baseFilters": [],
|
||||
"datasource": {
|
||||
"type": "victoriametrics-metrics-datasource",
|
||||
"uid": "$ds"
|
||||
"uid": "${ds}"
|
||||
},
|
||||
"filters": [],
|
||||
"name": "adhoc",
|
||||
"name": "filter",
|
||||
"type": "adhoc"
|
||||
}
|
||||
]
|
||||
@@ -4244,6 +4237,5 @@
|
||||
"timezone": "",
|
||||
"title": "VictoriaMetrics - vmalert (VM)",
|
||||
"uid": "LzldHAVnz_vm",
|
||||
"version": 1,
|
||||
"weekStart": ""
|
||||
"version": 1
|
||||
}
|
||||
@@ -3408,7 +3408,7 @@
|
||||
},
|
||||
"editorMode": "code",
|
||||
"exemplar": false,
|
||||
"expr": "topk_max(10, sum(sum_over_time(scrape_series_added[5m])) by (job)) > 0",
|
||||
"expr": "topk(10, sum(sum_over_time(scrape_series_added[5m])) by (job)) > 0",
|
||||
"interval": "",
|
||||
"legendFormat": "{{ job }}",
|
||||
"range": true,
|
||||
|
||||
@@ -114,13 +114,14 @@
|
||||
"mappings": [
|
||||
{
|
||||
"options": {
|
||||
"0": {
|
||||
"match": "null",
|
||||
"result": {
|
||||
"color": "green",
|
||||
"index": 0,
|
||||
"text": "Ok"
|
||||
}
|
||||
},
|
||||
"type": "value"
|
||||
"type": "special"
|
||||
},
|
||||
{
|
||||
"options": {
|
||||
@@ -139,8 +140,7 @@
|
||||
"mode": "absolute",
|
||||
"steps": [
|
||||
{
|
||||
"color": "green",
|
||||
"value": null
|
||||
"color": "green"
|
||||
}
|
||||
]
|
||||
}
|
||||
@@ -172,17 +172,19 @@
|
||||
"textMode": "auto",
|
||||
"wideLayout": true
|
||||
},
|
||||
"pluginVersion": "11.5.0",
|
||||
"pluginVersion": "12.0.2",
|
||||
"targets": [
|
||||
{
|
||||
"datasource": {
|
||||
"type": "prometheus",
|
||||
"uid": "$ds"
|
||||
},
|
||||
"editorMode": "code",
|
||||
"exemplar": false,
|
||||
"expr": "count(vmalert_config_last_reload_successful{job=~\"$job\", instance=~\"$instance\"} < 1 ) or 0",
|
||||
"expr": "count(vmalert_config_last_reload_successful{job=~\"$job\", instance=~\"$instance\"} < 1 )",
|
||||
"interval": "",
|
||||
"legendFormat": "",
|
||||
"range": true,
|
||||
"refId": "A"
|
||||
}
|
||||
],
|
||||
@@ -203,8 +205,7 @@
|
||||
"mode": "absolute",
|
||||
"steps": [
|
||||
{
|
||||
"color": "green",
|
||||
"value": null
|
||||
"color": "green"
|
||||
}
|
||||
]
|
||||
}
|
||||
@@ -236,7 +237,7 @@
|
||||
"textMode": "auto",
|
||||
"wideLayout": true
|
||||
},
|
||||
"pluginVersion": "11.5.0",
|
||||
"pluginVersion": "12.0.2",
|
||||
"targets": [
|
||||
{
|
||||
"datasource": {
|
||||
@@ -267,8 +268,7 @@
|
||||
"mode": "absolute",
|
||||
"steps": [
|
||||
{
|
||||
"color": "green",
|
||||
"value": null
|
||||
"color": "green"
|
||||
}
|
||||
]
|
||||
}
|
||||
@@ -300,7 +300,7 @@
|
||||
"textMode": "auto",
|
||||
"wideLayout": true
|
||||
},
|
||||
"pluginVersion": "11.5.0",
|
||||
"pluginVersion": "12.0.2",
|
||||
"targets": [
|
||||
{
|
||||
"datasource": {
|
||||
@@ -331,8 +331,7 @@
|
||||
"mode": "absolute",
|
||||
"steps": [
|
||||
{
|
||||
"color": "green",
|
||||
"value": null
|
||||
"color": "green"
|
||||
},
|
||||
{
|
||||
"color": "red",
|
||||
@@ -368,17 +367,19 @@
|
||||
"textMode": "auto",
|
||||
"wideLayout": true
|
||||
},
|
||||
"pluginVersion": "11.5.0",
|
||||
"pluginVersion": "12.0.2",
|
||||
"targets": [
|
||||
{
|
||||
"datasource": {
|
||||
"type": "prometheus",
|
||||
"uid": "$ds"
|
||||
},
|
||||
"editorMode": "code",
|
||||
"exemplar": false,
|
||||
"expr": "(sum(increase(vmalert_alerting_rules_errors_total{job=~\"$job\", instance=~\"$instance\", group=~\"$group\", file=~\"$file\"}[$__rate_interval])) or vector(0)) + \n(sum(increase(vmalert_recording_rules_errors_total{job=~\"$job\", instance=~\"$instance\", group=~\"$group\", file=~\"$file\"}[$__rate_interval])) or vector(0))",
|
||||
"expr": "(sum(increase(vmalert_alerting_rules_errors_total{job=~\"$job\", instance=~\"$instance\", group=~\"$group\", file=~\"$file\"}[$__rate_interval]))) + \n(sum(increase(vmalert_recording_rules_errors_total{job=~\"$job\", instance=~\"$instance\", group=~\"$group\", file=~\"$file\"}[$__rate_interval])))",
|
||||
"interval": "",
|
||||
"legendFormat": "",
|
||||
"range": true,
|
||||
"refId": "A"
|
||||
}
|
||||
],
|
||||
@@ -393,14 +394,24 @@
|
||||
"description": "Shows number of Recording Rules which produce no data.\n\n Usually it means that such rules are misconfigured, since they give no output during the evaluation.\nPlease check if rule's expression is correct and it is working as expected.",
|
||||
"fieldConfig": {
|
||||
"defaults": {
|
||||
"mappings": [],
|
||||
"mappings": [
|
||||
{
|
||||
"options": {
|
||||
"match": "null",
|
||||
"result": {
|
||||
"index": 1,
|
||||
"text": "0"
|
||||
}
|
||||
},
|
||||
"type": "special"
|
||||
}
|
||||
],
|
||||
"min": 0,
|
||||
"thresholds": {
|
||||
"mode": "absolute",
|
||||
"steps": [
|
||||
{
|
||||
"color": "green",
|
||||
"value": null
|
||||
"color": "green"
|
||||
},
|
||||
{
|
||||
"color": "red",
|
||||
@@ -436,7 +447,7 @@
|
||||
"textMode": "auto",
|
||||
"wideLayout": true
|
||||
},
|
||||
"pluginVersion": "11.5.0",
|
||||
"pluginVersion": "12.0.2",
|
||||
"targets": [
|
||||
{
|
||||
"datasource": {
|
||||
@@ -445,7 +456,7 @@
|
||||
},
|
||||
"editorMode": "code",
|
||||
"exemplar": false,
|
||||
"expr": "count(vmalert_recording_rules_last_evaluation_samples{job=~\"$job\", instance=~\"$instance\"} < 1) or 0",
|
||||
"expr": "count(vmalert_recording_rules_last_evaluation_samples{job=~\"$job\", instance=~\"$instance\"} < 1)",
|
||||
"interval": "",
|
||||
"legendFormat": "",
|
||||
"range": true,
|
||||
@@ -478,8 +489,7 @@
|
||||
"mode": "absolute",
|
||||
"steps": [
|
||||
{
|
||||
"color": "green",
|
||||
"value": null
|
||||
"color": "green"
|
||||
},
|
||||
{
|
||||
"color": "red",
|
||||
@@ -534,7 +544,7 @@
|
||||
},
|
||||
"showHeader": true
|
||||
},
|
||||
"pluginVersion": "11.5.0",
|
||||
"pluginVersion": "12.0.2",
|
||||
"targets": [
|
||||
{
|
||||
"datasource": {
|
||||
@@ -604,8 +614,7 @@
|
||||
"mode": "absolute",
|
||||
"steps": [
|
||||
{
|
||||
"color": "green",
|
||||
"value": null
|
||||
"color": "green"
|
||||
},
|
||||
{
|
||||
"color": "red",
|
||||
@@ -641,7 +650,7 @@
|
||||
"sort": "asc"
|
||||
}
|
||||
},
|
||||
"pluginVersion": "11.5.0",
|
||||
"pluginVersion": "12.0.2",
|
||||
"targets": [
|
||||
{
|
||||
"datasource": {
|
||||
@@ -723,8 +732,7 @@
|
||||
"mode": "absolute",
|
||||
"steps": [
|
||||
{
|
||||
"color": "green",
|
||||
"value": null
|
||||
"color": "green"
|
||||
},
|
||||
{
|
||||
"color": "red",
|
||||
@@ -762,7 +770,7 @@
|
||||
"sort": "desc"
|
||||
}
|
||||
},
|
||||
"pluginVersion": "11.5.0",
|
||||
"pluginVersion": "12.0.2",
|
||||
"targets": [
|
||||
{
|
||||
"datasource": {
|
||||
@@ -786,7 +794,7 @@
|
||||
"type": "prometheus",
|
||||
"uid": "$ds"
|
||||
},
|
||||
"description": "Top $topk groups by evaluation duration. Shows groups that take the most of time during the evaluation across all instances.\n\nThe panel uses MetricsQL functions and may not work with Prometheus.",
|
||||
"description": "Top $topk groups by evaluation duration. Shows groups that take the most of time during the evaluation across all instances.",
|
||||
"fieldConfig": {
|
||||
"defaults": {
|
||||
"color": {
|
||||
@@ -830,8 +838,7 @@
|
||||
"mode": "absolute",
|
||||
"steps": [
|
||||
{
|
||||
"color": "green",
|
||||
"value": null
|
||||
"color": "green"
|
||||
},
|
||||
{
|
||||
"color": "red",
|
||||
@@ -869,7 +876,7 @@
|
||||
"sort": "desc"
|
||||
}
|
||||
},
|
||||
"pluginVersion": "11.5.0",
|
||||
"pluginVersion": "12.0.2",
|
||||
"targets": [
|
||||
{
|
||||
"datasource": {
|
||||
@@ -878,7 +885,7 @@
|
||||
},
|
||||
"editorMode": "code",
|
||||
"exemplar": false,
|
||||
"expr": "topk_max($topk, max(sum(\n rate(vmalert_iteration_duration_seconds_sum{job=~\"$job\", instance=~\"$instance\", group=~\"$group\", file=~\"$file\"}[$__rate_interval])\n/\n rate(vmalert_iteration_duration_seconds_count{job=~\"$job\", instance=~\"$instance\", group=~\"$group\", file=~\"$file\"}[$__rate_interval])\n) by(job, instance, group, file)) \nby(job, group, file))",
|
||||
"expr": "topk($topk, max(sum(\n rate(vmalert_iteration_duration_seconds_sum{job=~\"$job\", instance=~\"$instance\", group=~\"$group\", file=~\"$file\"}[$__rate_interval])\n/\n rate(vmalert_iteration_duration_seconds_count{job=~\"$job\", instance=~\"$instance\", group=~\"$group\", file=~\"$file\"}[$__rate_interval])\n) by(job, instance, group, file)) \nby(job, group, file))",
|
||||
"interval": "",
|
||||
"legendFormat": "({{job}}) {{group}}({{file}})",
|
||||
"range": true,
|
||||
@@ -937,8 +944,7 @@
|
||||
"mode": "absolute",
|
||||
"steps": [
|
||||
{
|
||||
"color": "green",
|
||||
"value": null
|
||||
"color": "green"
|
||||
},
|
||||
{
|
||||
"color": "red",
|
||||
@@ -974,7 +980,7 @@
|
||||
"sort": "desc"
|
||||
}
|
||||
},
|
||||
"pluginVersion": "11.5.0",
|
||||
"pluginVersion": "12.0.2",
|
||||
"targets": [
|
||||
{
|
||||
"datasource": {
|
||||
@@ -1042,8 +1048,7 @@
|
||||
"mode": "absolute",
|
||||
"steps": [
|
||||
{
|
||||
"color": "green",
|
||||
"value": null
|
||||
"color": "green"
|
||||
},
|
||||
{
|
||||
"color": "red",
|
||||
@@ -1079,7 +1084,7 @@
|
||||
"sort": "none"
|
||||
}
|
||||
},
|
||||
"pluginVersion": "11.5.0",
|
||||
"pluginVersion": "12.0.2",
|
||||
"targets": [
|
||||
{
|
||||
"datasource": {
|
||||
@@ -1159,8 +1164,7 @@
|
||||
"mode": "absolute",
|
||||
"steps": [
|
||||
{
|
||||
"color": "green",
|
||||
"value": null
|
||||
"color": "green"
|
||||
},
|
||||
{
|
||||
"color": "red",
|
||||
@@ -1275,8 +1279,7 @@
|
||||
"mode": "absolute",
|
||||
"steps": [
|
||||
{
|
||||
"color": "green",
|
||||
"value": null
|
||||
"color": "green"
|
||||
},
|
||||
{
|
||||
"color": "red",
|
||||
@@ -1393,8 +1396,7 @@
|
||||
"mode": "absolute",
|
||||
"steps": [
|
||||
{
|
||||
"color": "green",
|
||||
"value": null
|
||||
"color": "green"
|
||||
},
|
||||
{
|
||||
"color": "red",
|
||||
@@ -1502,8 +1504,7 @@
|
||||
"mode": "absolute",
|
||||
"steps": [
|
||||
{
|
||||
"color": "green",
|
||||
"value": null
|
||||
"color": "green"
|
||||
},
|
||||
{
|
||||
"color": "red",
|
||||
@@ -1636,8 +1637,7 @@
|
||||
"mode": "absolute",
|
||||
"steps": [
|
||||
{
|
||||
"color": "green",
|
||||
"value": null
|
||||
"color": "green"
|
||||
},
|
||||
{
|
||||
"color": "red",
|
||||
@@ -1753,8 +1753,7 @@
|
||||
"mode": "absolute",
|
||||
"steps": [
|
||||
{
|
||||
"color": "green",
|
||||
"value": null
|
||||
"color": "green"
|
||||
}
|
||||
]
|
||||
},
|
||||
@@ -1875,8 +1874,7 @@
|
||||
"mode": "absolute",
|
||||
"steps": [
|
||||
{
|
||||
"color": "green",
|
||||
"value": null
|
||||
"color": "green"
|
||||
}
|
||||
]
|
||||
},
|
||||
@@ -1996,8 +1994,7 @@
|
||||
"mode": "absolute",
|
||||
"steps": [
|
||||
{
|
||||
"color": "green",
|
||||
"value": null
|
||||
"color": "green"
|
||||
},
|
||||
{
|
||||
"color": "red",
|
||||
@@ -2105,8 +2102,7 @@
|
||||
"mode": "absolute",
|
||||
"steps": [
|
||||
{
|
||||
"color": "green",
|
||||
"value": null
|
||||
"color": "green"
|
||||
},
|
||||
{
|
||||
"color": "red",
|
||||
@@ -2215,8 +2211,7 @@
|
||||
"mode": "absolute",
|
||||
"steps": [
|
||||
{
|
||||
"color": "green",
|
||||
"value": null
|
||||
"color": "green"
|
||||
},
|
||||
{
|
||||
"color": "red",
|
||||
@@ -2324,8 +2319,7 @@
|
||||
"mode": "absolute",
|
||||
"steps": [
|
||||
{
|
||||
"color": "green",
|
||||
"value": null
|
||||
"color": "green"
|
||||
},
|
||||
{
|
||||
"color": "red",
|
||||
@@ -2433,8 +2427,7 @@
|
||||
"mode": "absolute",
|
||||
"steps": [
|
||||
{
|
||||
"color": "green",
|
||||
"value": null
|
||||
"color": "green"
|
||||
}
|
||||
]
|
||||
},
|
||||
@@ -2855,7 +2848,7 @@
|
||||
"type": "prometheus",
|
||||
"uid": "$ds"
|
||||
},
|
||||
"description": "Shows top $topk current active (firing) alerting rules.\n\nThe panel uses MetricsQL functions and may not work with Prometheus.",
|
||||
"description": "Shows top $topk current active (firing) alerting rules.",
|
||||
"fieldConfig": {
|
||||
"defaults": {
|
||||
"color": {
|
||||
@@ -2942,7 +2935,7 @@
|
||||
},
|
||||
"editorMode": "code",
|
||||
"exemplar": false,
|
||||
"expr": "topk_max($topk, sum(vmalert_alerts_firing{job=~\"$job\", instance=~\"$instance\", group=~\"$group\", file=~\"$file\"}) by(job, group, file, alertname) > 0)",
|
||||
"expr": "topk($topk, sum(vmalert_alerts_firing{job=~\"$job\", instance=~\"$instance\", group=~\"$group\", file=~\"$file\"}) by(job, group, file, alertname) > 0)",
|
||||
"interval": "",
|
||||
"legendFormat": "({{job}}) {{group}}.{{alertname}}({{file}})",
|
||||
"range": true,
|
||||
@@ -3375,7 +3368,7 @@
|
||||
"type": "prometheus",
|
||||
"uid": "$ds"
|
||||
},
|
||||
"description": "Shows the top $topk recording rules which generate the most of [samples](https://docs.victoriametrics.com/victoriametrics/keyconcepts/#raw-samples). Each generated sample is basically a time series which then ingested into configured remote storage. Rules with high numbers may cause the most pressure on the remote database and become a source of too high cardinality.\n\nThe panel uses MetricsQL functions and may not work with Prometheus.",
|
||||
"description": "Shows the top $topk recording rules which generate the most of [samples](https://docs.victoriametrics.com/victoriametrics/keyconcepts/#raw-samples). Each generated sample is basically a time series which then ingested into configured remote storage. Rules with high numbers may cause the most pressure on the remote database and become a source of too high cardinality.",
|
||||
"fieldConfig": {
|
||||
"defaults": {
|
||||
"color": {
|
||||
@@ -3462,7 +3455,7 @@
|
||||
},
|
||||
"editorMode": "code",
|
||||
"exemplar": false,
|
||||
"expr": "topk_max($topk, \n max(\n sum(vmalert_recording_rules_last_evaluation_samples{job=~\"$job\", instance=~\"$instance\", group=~\"$group\", file=~\"$file\"}) by(job, instance, group, file, recording) > 0\n ) by(job, group, file, recording)\n)",
|
||||
"expr": "topk($topk, \n max(\n sum(vmalert_recording_rules_last_evaluation_samples{job=~\"$job\", instance=~\"$instance\", group=~\"$group\", file=~\"$file\"}) by(job, instance, group, file, recording) > 0\n ) by(job, group, file, recording)\n)",
|
||||
"interval": "",
|
||||
"legendFormat": "({{job}}) {{group}}.{{recording}}({{file}})",
|
||||
"range": true,
|
||||
@@ -4083,7 +4076,7 @@
|
||||
],
|
||||
"preload": false,
|
||||
"refresh": "",
|
||||
"schemaVersion": 40,
|
||||
"schemaVersion": 41,
|
||||
"tags": [
|
||||
"victoriametrics"
|
||||
],
|
||||
@@ -4227,10 +4220,10 @@
|
||||
"baseFilters": [],
|
||||
"datasource": {
|
||||
"type": "prometheus",
|
||||
"uid": "$ds"
|
||||
"uid": "${ds}"
|
||||
},
|
||||
"filters": [],
|
||||
"name": "adhoc",
|
||||
"name": "filter",
|
||||
"type": "adhoc"
|
||||
}
|
||||
]
|
||||
@@ -4243,6 +4236,5 @@
|
||||
"timezone": "",
|
||||
"title": "VictoriaMetrics - vmalert",
|
||||
"uid": "LzldHAVnz",
|
||||
"version": 1,
|
||||
"weekStart": ""
|
||||
"version": 1
|
||||
}
|
||||
@@ -1,7 +1,7 @@
|
||||
services:
|
||||
# Grafana instance configured with VictoriaLogs as datasource
|
||||
grafana:
|
||||
image: grafana/grafana:11.5.0
|
||||
image: grafana/grafana:12.0.2
|
||||
depends_on:
|
||||
- "victoriametrics"
|
||||
- "vmauth"
|
||||
@@ -68,7 +68,7 @@ services:
|
||||
# VictoriaMetrics instance, a single process responsible for
|
||||
# scraping, storing metrics and serve read requests.
|
||||
victoriametrics:
|
||||
image: victoriametrics/victoria-metrics:v1.119.0
|
||||
image: victoriametrics/victoria-metrics:v1.120.0
|
||||
volumes:
|
||||
- vmdata:/storage
|
||||
- ./prometheus-vl-cluster.yml:/etc/prometheus/prometheus.yml
|
||||
@@ -81,7 +81,7 @@ services:
|
||||
# It proxies query requests from vmalert to either VictoriaMetrics or VictoriaLogs,
|
||||
# depending on the requested path.
|
||||
vmauth:
|
||||
image: victoriametrics/vmauth:v1.119.0
|
||||
image: victoriametrics/vmauth:v1.120.0
|
||||
depends_on:
|
||||
- "victoriametrics"
|
||||
- "vlselect-1"
|
||||
@@ -97,7 +97,7 @@ services:
|
||||
|
||||
# vmalert executes alerting and recording rules according to given rule type.
|
||||
vmalert:
|
||||
image: victoriametrics/vmalert:v1.119.0
|
||||
image: victoriametrics/vmalert:v1.120.0
|
||||
depends_on:
|
||||
- "vmauth"
|
||||
- "alertmanager"
|
||||
|
||||
@@ -1,7 +1,7 @@
|
||||
services:
|
||||
# Grafana instance configured with VictoriaLogs as datasource
|
||||
grafana:
|
||||
image: grafana/grafana:11.5.0
|
||||
image: grafana/grafana:12.0.2
|
||||
depends_on:
|
||||
- "victoriametrics"
|
||||
- "victorialogs"
|
||||
@@ -49,7 +49,7 @@ services:
|
||||
# VictoriaMetrics instance, a single process responsible for
|
||||
# scraping, storing metrics and serve read requests.
|
||||
victoriametrics:
|
||||
image: victoriametrics/victoria-metrics:v1.119.0
|
||||
image: victoriametrics/victoria-metrics:v1.120.0
|
||||
ports:
|
||||
- "8428:8428"
|
||||
volumes:
|
||||
@@ -64,7 +64,7 @@ services:
|
||||
# It proxies query requests from vmalert to either VictoriaMetrics or VictoriaLogs,
|
||||
# depending on the requested path.
|
||||
vmauth:
|
||||
image: victoriametrics/vmauth:v1.119.0
|
||||
image: victoriametrics/vmauth:v1.120.0
|
||||
depends_on:
|
||||
- "victoriametrics"
|
||||
- "victorialogs"
|
||||
@@ -78,7 +78,7 @@ services:
|
||||
|
||||
# vmalert executes alerting and recording rules according to the given rule type.
|
||||
vmalert:
|
||||
image: victoriametrics/vmalert:v1.119.0
|
||||
image: victoriametrics/vmalert:v1.120.0
|
||||
depends_on:
|
||||
- "vmauth"
|
||||
- "alertmanager"
|
||||
|
||||
@@ -3,7 +3,7 @@ services:
|
||||
# It scrapes targets defined in --promscrape.config
|
||||
# And forward them to --remoteWrite.url
|
||||
vmagent:
|
||||
image: victoriametrics/vmagent:v1.119.0
|
||||
image: victoriametrics/vmagent:v1.120.0
|
||||
depends_on:
|
||||
- "vmauth"
|
||||
ports:
|
||||
@@ -17,7 +17,7 @@ services:
|
||||
restart: always
|
||||
|
||||
grafana:
|
||||
image: grafana/grafana:11.5.0
|
||||
image: grafana/grafana:12.0.2
|
||||
depends_on:
|
||||
- "vmauth"
|
||||
ports:
|
||||
@@ -35,14 +35,14 @@ services:
|
||||
# vmstorage shards. Each shard receives 1/N of all metrics sent to vminserts,
|
||||
# where N is number of vmstorages (2 in this case).
|
||||
vmstorage-1:
|
||||
image: victoriametrics/vmstorage:v1.119.0-cluster
|
||||
image: victoriametrics/vmstorage:v1.120.0-cluster
|
||||
volumes:
|
||||
- strgdata-1:/storage
|
||||
command:
|
||||
- "--storageDataPath=/storage"
|
||||
restart: always
|
||||
vmstorage-2:
|
||||
image: victoriametrics/vmstorage:v1.119.0-cluster
|
||||
image: victoriametrics/vmstorage:v1.120.0-cluster
|
||||
volumes:
|
||||
- strgdata-2:/storage
|
||||
command:
|
||||
@@ -52,7 +52,7 @@ services:
|
||||
# vminsert is ingestion frontend. It receives metrics pushed by vmagent,
|
||||
# pre-process them and distributes across configured vmstorage shards.
|
||||
vminsert-1:
|
||||
image: victoriametrics/vminsert:v1.119.0-cluster
|
||||
image: victoriametrics/vminsert:v1.120.0-cluster
|
||||
depends_on:
|
||||
- "vmstorage-1"
|
||||
- "vmstorage-2"
|
||||
@@ -61,7 +61,7 @@ services:
|
||||
- "--storageNode=vmstorage-2:8400"
|
||||
restart: always
|
||||
vminsert-2:
|
||||
image: victoriametrics/vminsert:v1.119.0-cluster
|
||||
image: victoriametrics/vminsert:v1.120.0-cluster
|
||||
depends_on:
|
||||
- "vmstorage-1"
|
||||
- "vmstorage-2"
|
||||
@@ -73,7 +73,7 @@ services:
|
||||
# vmselect is a query fronted. It serves read queries in MetricsQL or PromQL.
|
||||
# vmselect collects results from configured `--storageNode` shards.
|
||||
vmselect-1:
|
||||
image: victoriametrics/vmselect:v1.119.0-cluster
|
||||
image: victoriametrics/vmselect:v1.120.0-cluster
|
||||
depends_on:
|
||||
- "vmstorage-1"
|
||||
- "vmstorage-2"
|
||||
@@ -83,7 +83,7 @@ services:
|
||||
- "--vmalert.proxyURL=http://vmalert:8880"
|
||||
restart: always
|
||||
vmselect-2:
|
||||
image: victoriametrics/vmselect:v1.119.0-cluster
|
||||
image: victoriametrics/vmselect:v1.120.0-cluster
|
||||
depends_on:
|
||||
- "vmstorage-1"
|
||||
- "vmstorage-2"
|
||||
@@ -98,7 +98,7 @@ services:
|
||||
# read requests from Grafana, vmui, vmalert among vmselects.
|
||||
# It can be used as an authentication proxy.
|
||||
vmauth:
|
||||
image: victoriametrics/vmauth:v1.119.0
|
||||
image: victoriametrics/vmauth:v1.120.0
|
||||
depends_on:
|
||||
- "vmselect-1"
|
||||
- "vmselect-2"
|
||||
@@ -112,7 +112,7 @@ services:
|
||||
|
||||
# vmalert executes alerting and recording rules
|
||||
vmalert:
|
||||
image: victoriametrics/vmalert:v1.119.0
|
||||
image: victoriametrics/vmalert:v1.120.0
|
||||
depends_on:
|
||||
- "vmauth"
|
||||
ports:
|
||||
|
||||
@@ -3,7 +3,7 @@ services:
|
||||
# It scrapes targets defined in --promscrape.config
|
||||
# And forward them to --remoteWrite.url
|
||||
vmagent:
|
||||
image: victoriametrics/vmagent:v1.119.0
|
||||
image: victoriametrics/vmagent:v1.120.0
|
||||
depends_on:
|
||||
- "victoriametrics"
|
||||
ports:
|
||||
@@ -18,7 +18,7 @@ services:
|
||||
# VictoriaMetrics instance, a single process responsible for
|
||||
# storing metrics and serve read requests.
|
||||
victoriametrics:
|
||||
image: victoriametrics/victoria-metrics:v1.119.0
|
||||
image: victoriametrics/victoria-metrics:v1.120.0
|
||||
ports:
|
||||
- 8428:8428
|
||||
- 8089:8089
|
||||
@@ -38,7 +38,7 @@ services:
|
||||
restart: always
|
||||
|
||||
grafana:
|
||||
image: grafana/grafana:11.5.0
|
||||
image: grafana/grafana:12.0.2
|
||||
depends_on:
|
||||
- "victoriametrics"
|
||||
ports:
|
||||
@@ -54,7 +54,7 @@ services:
|
||||
|
||||
# vmalert executes alerting and recording rules
|
||||
vmalert:
|
||||
image: victoriametrics/vmalert:v1.119.0
|
||||
image: victoriametrics/vmalert:v1.120.0
|
||||
depends_on:
|
||||
- "victoriametrics"
|
||||
- "alertmanager"
|
||||
|
||||
@@ -19,7 +19,7 @@ services:
|
||||
retries: 10
|
||||
|
||||
dd-proxy:
|
||||
image: docker.io/victoriametrics/vmauth:v1.119.0
|
||||
image: docker.io/victoriametrics/vmauth:v1.120.0
|
||||
restart: on-failure
|
||||
volumes:
|
||||
- ./:/etc/vmauth
|
||||
|
||||
@@ -1,6 +1,6 @@
|
||||
services:
|
||||
vmagent:
|
||||
image: victoriametrics/vmagent:v1.119.0
|
||||
image: victoriametrics/vmagent:v1.120.0
|
||||
depends_on:
|
||||
- "victoriametrics"
|
||||
ports:
|
||||
@@ -14,7 +14,7 @@ services:
|
||||
restart: always
|
||||
|
||||
victoriametrics:
|
||||
image: victoriametrics/victoria-metrics:v1.119.0
|
||||
image: victoriametrics/victoria-metrics:v1.120.0
|
||||
ports:
|
||||
- 8428:8428
|
||||
volumes:
|
||||
@@ -27,7 +27,7 @@ services:
|
||||
restart: always
|
||||
|
||||
grafana:
|
||||
image: grafana/grafana-oss:10.2.1
|
||||
image: grafana/grafana:12.0.2
|
||||
depends_on:
|
||||
- "victoriametrics"
|
||||
ports:
|
||||
@@ -40,7 +40,7 @@ services:
|
||||
restart: always
|
||||
|
||||
vmalert:
|
||||
image: victoriametrics/vmalert:v1.119.0
|
||||
image: victoriametrics/vmalert:v1.120.0
|
||||
depends_on:
|
||||
- "victoriametrics"
|
||||
ports:
|
||||
|
||||
@@ -58,7 +58,7 @@ services:
|
||||
- ./vmsingle/promscrape.yml:/promscrape.yml
|
||||
|
||||
grafana:
|
||||
image: grafana/grafana:11.5.0
|
||||
image: grafana/grafana:12.0.2
|
||||
depends_on: [vmsingle]
|
||||
ports:
|
||||
- 3000:3000
|
||||
|
||||
@@ -2,9 +2,9 @@
|
||||
|
||||
- To use *vmanomaly*, part of the enterprise package, a license key is required. Obtain your key [here](https://victoriametrics.com/products/enterprise/trial/) for this tutorial or for enterprise use.
|
||||
- In the tutorial, we'll be using the following VictoriaMetrics components:
|
||||
- [VictoriaMetrics Single-Node](https://docs.victoriametrics.com/victoriametrics/single-server-victoriametrics/) (v1.119.0)
|
||||
- [vmalert](https://docs.victoriametrics.com/victoriametrics/vmalert/) (v1.119.0)
|
||||
- [vmagent](https://docs.victoriametrics.com/victoriametrics/vmagent/) (v1.119.0)
|
||||
- [VictoriaMetrics Single-Node](https://docs.victoriametrics.com/victoriametrics/single-server-victoriametrics/) (v1.120.0)
|
||||
- [vmalert](https://docs.victoriametrics.com/victoriametrics/vmalert/) (v1.120.0)
|
||||
- [vmagent](https://docs.victoriametrics.com/victoriametrics/vmagent/) (v1.120.0)
|
||||
- [Grafana](https://grafana.com/) (v.10.2.1)
|
||||
- [Docker](https://docs.docker.com/get-docker/) and [Docker Compose](https://docs.docker.com/compose/)
|
||||
- [Node exporter](https://github.com/prometheus/node_exporter#node-exporter) (v1.7.0) and [Alertmanager](https://prometheus.io/docs/alerting/latest/alertmanager/) (v0.27.0)
|
||||
@@ -315,7 +315,7 @@ Let's wrap it all up together into the `docker-compose.yml` file.
|
||||
services:
|
||||
vmagent:
|
||||
container_name: vmagent
|
||||
image: victoriametrics/vmagent:v1.119.0
|
||||
image: victoriametrics/vmagent:v1.120.0
|
||||
depends_on:
|
||||
- "victoriametrics"
|
||||
ports:
|
||||
@@ -332,7 +332,7 @@ services:
|
||||
|
||||
victoriametrics:
|
||||
container_name: victoriametrics
|
||||
image: victoriametrics/victoria-metrics:v1.119.0
|
||||
image: victoriametrics/victoria-metrics:v1.120.0
|
||||
ports:
|
||||
- 8428:8428
|
||||
volumes:
|
||||
@@ -365,7 +365,7 @@ services:
|
||||
|
||||
vmalert:
|
||||
container_name: vmalert
|
||||
image: victoriametrics/vmalert:v1.119.0
|
||||
image: victoriametrics/vmalert:v1.120.0
|
||||
depends_on:
|
||||
- "victoriametrics"
|
||||
ports:
|
||||
|
||||
@@ -241,27 +241,27 @@ services:
|
||||
- grafana_data:/var/lib/grafana/
|
||||
|
||||
vmsingle:
|
||||
image: victoriametrics/victoria-metrics:v1.119.0
|
||||
image: victoriametrics/victoria-metrics:v1.120.0
|
||||
command:
|
||||
- -httpListenAddr=0.0.0.0:8429
|
||||
|
||||
vmstorage:
|
||||
image: victoriametrics/vmstorage:v1.119.0-cluster
|
||||
image: victoriametrics/vmstorage:v1.120.0-cluster
|
||||
|
||||
vminsert:
|
||||
image: victoriametrics/vminsert:v1.119.0-cluster
|
||||
image: victoriametrics/vminsert:v1.120.0-cluster
|
||||
command:
|
||||
- -storageNode=vmstorage:8400
|
||||
- -httpListenAddr=0.0.0.0:8480
|
||||
|
||||
vmselect:
|
||||
image: victoriametrics/vmselect:v1.119.0-cluster
|
||||
image: victoriametrics/vmselect:v1.120.0-cluster
|
||||
command:
|
||||
- -storageNode=vmstorage:8401
|
||||
- -httpListenAddr=0.0.0.0:8481
|
||||
|
||||
vmagent:
|
||||
image: victoriametrics/vmagent:v1.119.0
|
||||
image: victoriametrics/vmagent:v1.120.0
|
||||
volumes:
|
||||
- ./scrape.yaml:/etc/vmagent/config.yaml
|
||||
command:
|
||||
@@ -270,7 +270,7 @@ services:
|
||||
- -remoteWrite.url=http://vmsingle:8429/api/v1/write
|
||||
|
||||
vmgateway-cluster:
|
||||
image: victoriametrics/vmgateway:v1.119.0-enterprise
|
||||
image: victoriametrics/vmgateway:v1.120.0-enterprise
|
||||
ports:
|
||||
- 8431:8431
|
||||
volumes:
|
||||
@@ -286,7 +286,7 @@ services:
|
||||
- -auth.oidcDiscoveryEndpoints=http://keycloak:8080/realms/master/.well-known/openid-configuration
|
||||
|
||||
vmgateway-single:
|
||||
image: victoriametrics/vmgateway:v1.119.0-enterprise
|
||||
image: victoriametrics/vmgateway:v1.120.0-enterprise
|
||||
ports:
|
||||
- 8432:8431
|
||||
volumes:
|
||||
@@ -397,7 +397,7 @@ Once iDP configuration is done, vmagent configuration needs to be updated to use
|
||||
|
||||
```yaml
|
||||
vmagent:
|
||||
image: victoriametrics/vmagent:v1.119.0
|
||||
image: victoriametrics/vmagent:v1.120.0
|
||||
volumes:
|
||||
- ./scrape.yaml:/etc/vmagent/config.yaml
|
||||
- ./vmagent-client-secret:/etc/vmagent/oauth2-client-secret
|
||||
|
||||
@@ -209,8 +209,8 @@ Migrating data from other databases to VictoriaMetrics is as simple as importing
|
||||
[supported ingestion formats](https://docs.victoriametrics.com/victoriametrics/keyconcepts/#push-model).
|
||||
|
||||
But migration from InfluxDB might get easier with [vmctl](https://docs.victoriametrics.com/victoriametrics/vmctl/). See more about
|
||||
migrating [from InfluxDB v1.x versions](https://docs.victoriametrics.com/victoriametrics/vmctl/#migrating-data-from-influxdb-1x).
|
||||
Migrating data from InfluxDB v2.x is not supported. But there is a useful [3rd party solution](https://docs.victoriametrics.com/victoriametrics/vmctl/#migrating-data-from-influxdb-2x)
|
||||
migrating [from InfluxDB v1.x versions](https://docs.victoriametrics.com/victoriametrics/vmctl/influxdb/).
|
||||
Migrating data from InfluxDB v2.x is not supported. But there is a useful [3rd party solution](https://docs.victoriametrics.com/victoriametrics/vmctl/influxdb/#influxdb-v2)
|
||||
for this.
|
||||
|
||||
Please note, data migration is a backfilling process, so read about [backfilling tips](https://docs.victoriametrics.com/victoriametrics/single-server-victoriametrics/#backfilling).
|
||||
|
||||
@@ -570,7 +570,7 @@ Released at 2024-09-30
|
||||
Released at 2024-09-29
|
||||
|
||||
* FEATURE: [data ingestion](https://docs.victoriametrics.com/victorialogs/data-ingestion/): accept Unix timestamps in seconds in the ingested logs. This simplifies integration with systems, which prefer Unix timestamps over text-based representation of time.
|
||||
* FEATURE: [`sort` pipe](https://docs.victoriametrics.com/victorialogs/logsql/#sort-pipe): allow using `order` alias instead of `sort`. For example, `_time:5s | order by (_time)` query works the same as `_time:5s | sort by (_time)`. This simplifies the to [LogsQL](https://docs.victoriametrics.com/victorialogs/logsql/) transition from SQL-like query languages.
|
||||
* FEATURE: [`sort` pipe](https://docs.victoriametrics.com/victorialogs/logsql/#sort-pipe): allow using `order` alias instead of `sort`. For example, `_time:5s | order by (_time)` query works the same as `_time:5s | sort by (_time)`. This simplifies [LogsQL](https://docs.victoriametrics.com/victorialogs/logsql/) transition from SQL-like query languages.
|
||||
* FEATURE: [`stats` pipe](https://docs.victoriametrics.com/victorialogs/logsql/#stats-pipe): allow using multiple identical [stats functions](https://docs.victoriametrics.com/victorialogs/logsql/#stats-pipe-functions) with distinct [filters](https://docs.victoriametrics.com/victorialogs/logsql/#stats-with-additional-filters) and automatically generated result names. For example, `_time:5m | count(), count() if (error)` query works as expected now, e.g. it returns two results over the last 5 minutes: the total number of logs and the number of logs with `error` [word](https://docs.victoriametrics.com/victorialogs/logsql/#word). Previously this query couldn't be executed because the `if (...)` condition wasn't included in the automatically generate result name, so both results had the same name - `count(*)`.
|
||||
|
||||
* BUGFIX: properly calculate [`uniq`](https://docs.victoriametrics.com/victorialogs/logsql/#uniq-pipe) and [`top`](https://docs.victoriametrics.com/victorialogs/logsql/#top-pipe) pipes. Previously they could return invalid results in some cases.
|
||||
@@ -650,7 +650,7 @@ Released at 2024-07-05
|
||||
|
||||
Released at 2024-07-02
|
||||
|
||||
* FEATURE: add `-syslog.useLocalTimestamp.tcp` and `-syslog.useLocalTimestamp.udp` command-line flags, which could be used for using the local timestamp as [`_time` field](https://docs.victoriametrics.com/victorialogs/keyconcepts/#time-field) for the logs ingested via the corresponding `-syslog.listenAddr.tcp` / `-syslog.listenAddr.udp`. By default the timestamp from the syslog message is used as [`_time` field](https://docs.victoriametrics.com/victorialogs/keyconcepts/#time-field). See [these docs](https://docs.victoriametrics.com/victorialogs/data-ingestion/syslog/).
|
||||
* FEATURE: add `-syslog.useLocalTimestamp.tcp` and `-syslog.useLocalTimestamp.udp` command-line flags, which could be used for using the local timestamp as [`_time` field](https://docs.victoriametrics.com/victorialogs/keyconcepts/#time-field) for the logs ingested via the corresponding `-syslog.listenAddr.tcp` / `-syslog.listenAddr.udp`. By default, the timestamp from the syslog message is used as [`_time` field](https://docs.victoriametrics.com/victorialogs/keyconcepts/#time-field). See [these docs](https://docs.victoriametrics.com/victorialogs/data-ingestion/syslog/).
|
||||
|
||||
* BUGFIX: make slowly ingested logs visible for search as soon as they are ingested into VictoriaLogs. Previously slowly ingested logs could remain invisible for search for long time.
|
||||
|
||||
|
||||
@@ -207,7 +207,7 @@ via `-insert.maxLineSizeBytes` command-line flag.
|
||||
VictoriaLogs limits [log field](https://docs.victoriametrics.com/victorialogs/keyconcepts/#data-model) name length to 128 bytes -
|
||||
Log entries with longer field names are ignored during [data ingestion](https://docs.victoriametrics.com/victorialogs/data-ingestion/).
|
||||
|
||||
The maximum length of a field name is hardcoded and is unikely to increase, since this may increase RAM and CPU usage.
|
||||
The maximum length of a field name is hardcoded and is unlikely to increase, since this may increase RAM and CPU usage.
|
||||
|
||||
## How many fields a single log entry may contain
|
||||
|
||||
@@ -243,7 +243,7 @@ is returned in the `total_bytes` field.
|
||||
|
||||
If you use [VictoriaLogs web UI](https://docs.victoriametrics.com/victorialogs/querying/#web-ui)
|
||||
or [Grafana plugin for VictoriaLogs](https://docs.victoriametrics.com/victorialogs/victorialogs-datasource/),
|
||||
then make sure the selected time range covers the last day. Otherwise the query above returns
|
||||
then make sure the selected time range covers the last day. Otherwise, the query above returns
|
||||
results on the intersection of the last day and the selected time range.
|
||||
|
||||
See [why the log field occupies a lot of disk space](#why-the-log-field-occupies-a-lot-of-disk-space).
|
||||
@@ -334,7 +334,7 @@ The query works in the following way:
|
||||
|
||||
The needed storage space depends on the following factors:
|
||||
|
||||
- Data compressibility. VictoraLogs compresses the ingested logs before storing them to disk. The compression ratio depends on the "randomness" of the ingested logs.
|
||||
- Data compressibility. VictoriaLogs compresses the ingested logs before storing them to disk. The compression ratio depends on the "randomness" of the ingested logs.
|
||||
Less "random" logs with many repeated field values and small differences between log messages compress the best (up to 100x and more).
|
||||
More "random" logs with many unique field values may have very low compression rate.
|
||||
|
||||
|
||||
@@ -1319,7 +1319,7 @@ This query matches the following log messages, since their length is in the requ
|
||||
This query doesn't match the following log messages:
|
||||
|
||||
- `foo`, since it is too short
|
||||
- `foo bar baz abc`, sinc it is too long
|
||||
- `foo bar baz abc`, since it is too long
|
||||
|
||||
It is possible to use `inf` as the upper bound. For example, the following query matches [log messages](https://docs.victoriametrics.com/victorialogs/keyconcepts/#message-field)
|
||||
with the length bigger or equal to 5 chars:
|
||||
@@ -3362,7 +3362,7 @@ It understands the following Syslog formats:
|
||||
|
||||
The following fields are unpacked:
|
||||
|
||||
- `level` - optained from `PRI`.
|
||||
- `level` - obtained from `PRI`.
|
||||
- `priority` - obtained from `PRI`.
|
||||
- `facility` - calculated as `PRI / 8`.
|
||||
- `facility_keyword` - string representation of the `facility` field according to [these docs](https://en.wikipedia.org/wiki/Syslog#Facility).
|
||||
@@ -3497,7 +3497,7 @@ See also:
|
||||
|
||||
#### Conditional unroll
|
||||
|
||||
If the [`unroll` pipe](#unroll-pipe) must be applied only to some [log enties](https://docs.victoriametrics.com/victorialogs/keyconcepts/#data-model),
|
||||
If the [`unroll` pipe](#unroll-pipe) must be applied only to some [log entries](https://docs.victoriametrics.com/victorialogs/keyconcepts/#data-model),
|
||||
then add `if (<filters>)` after `unroll`.
|
||||
The `<filters>` can contain arbitrary [filters](#filters). For example, the following query unrolls `value` field only if `value_type` field equals to `json_array`:
|
||||
|
||||
@@ -3534,7 +3534,7 @@ LogsQL supports the following functions for [`stats` pipe](#stats-pipe):
|
||||
|
||||
`avg(field1, ..., fieldN)` [stats pipe function](#stats-pipe-functions) calculates the average value across
|
||||
all the mentioned [log fields](https://docs.victoriametrics.com/victorialogs/keyconcepts/#data-model).
|
||||
Non-numeric values are ignored.
|
||||
Non-numeric values are ignored. If all the values are non-numeric, then `NaN` is returned.
|
||||
|
||||
For example, the following query returns the average value for the `duration` [field](https://docs.victoriametrics.com/victorialogs/keyconcepts/#data-model)
|
||||
over logs for the last 5 minutes:
|
||||
@@ -3972,6 +3972,7 @@ See also:
|
||||
|
||||
`sum(field1, ..., fieldN)` [stats pipe function](#stats-pipe-functions) calculates the sum of numeric values across
|
||||
all the mentioned [log fields](https://docs.victoriametrics.com/victorialogs/keyconcepts/#data-model).
|
||||
Non-numeric values are skipped. If all the values across `field1`, ..., `fieldN` are non-numeric, then `NaN` is returned.
|
||||
|
||||
For example, the following query returns the sum of numeric values for the `duration` [field](https://docs.victoriametrics.com/victorialogs/keyconcepts/#data-model)
|
||||
over logs for the last 5 minutes:
|
||||
@@ -4127,7 +4128,7 @@ LogsQL supports the following string literals:
|
||||
|
||||
- `"double quoted"`. Double quote and backslash inside such a string must be escaped with `\`: `"escape\"doublequote and \\ backslash"`.
|
||||
Double-quoted strings may contain special sequences such as `\n`, `\t`, `\f`, `\x8c`, etc. They are decoded according to [these docs](https://go.dev/ref/spec#String_literals).
|
||||
- `'single quoted'`. Single quote and backsliash inside such a string must be escaped with `\`: `'escape\'singlequote and \\ backslash'`.
|
||||
- `'single quoted'`. Single quote and backslash inside such a string must be escaped with `\`: `'escape\'singlequote and \\ backslash'`.
|
||||
- ``` `backtick quoted` ```. Strings with backslashes, double quotes and single quotes shouldn't be escaped inside backtick-quoted strings.
|
||||
|
||||
## Comments
|
||||
@@ -4136,10 +4137,10 @@ LogsQL query may contain comments at any place. The comment starts with `#` and
|
||||
Example query with comments:
|
||||
|
||||
```logsql
|
||||
error # find logs with `error` word
|
||||
| stats by (_stream) logs # then count the number of logs per `_stream` label
|
||||
| sort by (logs) desc # then sort by the found logs in descending order
|
||||
| limit 5 # and show top 5 streams with the biggest number of logs
|
||||
error # find logs with `error` word
|
||||
| stats by (_stream) count() logs # then count the number of logs per `_stream` label
|
||||
| sort by (logs) desc # then sort by the found logs in descending order
|
||||
| limit 5 # and show top 5 streams with the biggest number of logs
|
||||
```
|
||||
|
||||
## Numeric values
|
||||
|
||||
@@ -31,41 +31,126 @@ See [quick start guide](#quick-start) on how to start working with VictoriaLogs
|
||||
|
||||
## Architecture
|
||||
|
||||
VictoriaLogs in cluster mode consists of `vlinsert`, `vlselect` and `vlstorage` components:
|
||||
VictoriaLogs in cluster mode is composed of three main components: `vlinsert`, `vlselect`, and `vlstorage`.
|
||||
|
||||
- `vlinsert` accepts the ingested logs via [all the supported data ingestion protocols](https://docs.victoriametrics.com/victorialogs/data-ingestion/)
|
||||
and spreads them evenly among the `vlstorage` nodes listed via the `-storageNode` command-line flag.
|
||||
```mermaid
|
||||
sequenceDiagram
|
||||
participant LS as Log Sources
|
||||
participant VI as vlinsert
|
||||
participant VS1 as vlstorage-1
|
||||
participant VS2 as vlstorage-2
|
||||
participant VL as vlselect
|
||||
participant QC as Query Client
|
||||
|
||||
Note over LS,VS2: Log Ingestion Flow
|
||||
LS->>VI: Send logs via supported protocols
|
||||
VI->>VS1: POST /internal/insert (HTTP)
|
||||
VI->>VS2: POST /internal/insert (HTTP)
|
||||
Note right of VI: Distributes logs evenly<br/>across vlstorage nodes
|
||||
|
||||
Note over VS1,QC: Query Flow
|
||||
QC->>VL: Query via HTTP endpoints
|
||||
VL->>VS1: GET /internal/select/* (HTTP)
|
||||
VL->>VS2: GET /internal/select/* (HTTP)
|
||||
VS1-->>VL: Return local results
|
||||
VS2-->>VL: Return local results
|
||||
VL->>QC: Processed & aggregated results
|
||||
```
|
||||
|
||||
- `vlselect` accepts incoming queries via [all the supported HTTP querying endpoints](https://docs.victoriametrics.com/victorialogs/querying/),
|
||||
requests the needed data from `vlstorage` nodes listed via the `-storageNode` command-line flag, processes the queries and returns the corresponding responses.
|
||||
- `vlinsert` handles log ingestion via [all supported protocols](https://docs.victoriametrics.com/victorialogs/data-ingestion/).
|
||||
It distributes incoming logs evenly across `vlstorage` nodes, as specified by the `-storageNode` command-line flag.
|
||||
|
||||
- `vlstorage` is responsible for two tasks:
|
||||
- `vlselect` receives queries through [all supported HTTP query endpoints](https://docs.victoriametrics.com/victorialogs/querying/).
|
||||
It fetches the required data from the configured `vlstorage` nodes, processes the queries, and returns the results.
|
||||
|
||||
- It accepts logs from `vlinsert` nodes and stores them at the directory specified via `-storageDataPath` command-line flag.
|
||||
See [these docs](https://docs.victoriametrics.com/victorialogs/#storage) for details about this flag.
|
||||
- `vlstorage` performs two key roles:
|
||||
- It stores logs received from `vlinsert` at the directory defined by the `-storageDataPath` flag.
|
||||
See [storage configuration docs](https://docs.victoriametrics.com/victorialogs/#storage) for details.
|
||||
- It handles queries from `vlselect` by retrieving and transforming the requested data locally before returning results.
|
||||
|
||||
- It processes requests from `vlselect` nodes. It selects the requested logs and performs all data transformations and calculations,
|
||||
which can be executed locally, before sending the results to `vlselect`.
|
||||
Each `vlstorage` node operates as a self-contained VictoriaLogs instance.
|
||||
Refer to the [single-node and cluster mode duality](#single-node-and-cluster-mode-duality) documentation for more information.
|
||||
This design allows you to reuse existing single-node VictoriaLogs instances by listing them in the `-storageNode` flag for `vlselect`, enabling unified querying across all nodes.
|
||||
|
||||
`vlstorage` is basically a single-node version of VictoriaLogs. See [these docs](#single-node-and-cluster-mode-duality) for details.
|
||||
This means that the existing single-node VictoriaLogs instances can be added to the list of `vlstorage` nodes via `-storageNode` command-line flag at `vlselect`
|
||||
in order to get global querying view over all the logs across all the single-node VictoriaLogs instances.
|
||||
All VictoriaLogs components are horizontally scalable and can be deployed on hardware best suited to their respective workloads.
|
||||
`vlinsert` and `vlselect` can be run on the same node, which allows the minimal cluster to consist of just one `vlstorage` node and one node acting as both `vlinsert` and `vlselect`.
|
||||
However, for production environments, it is recommended to separate `vlinsert` and `vlselect` roles to avoid resource contention — for example, to prevent heavy queries from interfering with log ingestion.
|
||||
|
||||
Every component of the VictoriaLogs cluster can scale from a single node to arbitrary number of nodes and can run on the most suitable hardware for the given workload.
|
||||
`vlinsert` nodes can be used as `vlselect` nodes, so the minimum VictoriaLogs cluster must contain a `vlstorage` node plus a node, which plays both `vlinsert` and `vlselect` roles.
|
||||
It isn't recommended sharing `vlinsert` and `vlselect` responsibilities in a single node, since this increases chances that heavy queries can negatively affect data ingestion
|
||||
and vice versa.
|
||||
Communication between `vlinsert` / `vlselect` and `vlstorage` is done via HTTP over the port specified by the `-httpListenAddr` flag:
|
||||
|
||||
`vlselect` and `vlinsert` communicate with `vlstorage` via HTTP at the TCP port specified via `-httpListenAddr` command-line flag:
|
||||
- `vlinsert` sends data to the `/internal/insert` endpoint on `vlstorage`.
|
||||
- `vlselect` sends queries to endpoints under `/internal/select/` on `vlstorage`.
|
||||
|
||||
- `vlinsert` sends requests to `/internal/insert` HTTP endpoint at `vlstorage`.
|
||||
- `vlselect` sends requests to HTTP endpoints at `vlstorage` starting with `/internal/select/`.
|
||||
This HTTP-based communication model allows you to use reverse proxies for authorization, routing, and encryption between components.
|
||||
Use of [vmauth](https://docs.victoriametrics.com/victoriametrics/vmauth/) is recommended for managing access control.
|
||||
|
||||
This allows using various http proxies for authorization, routing and encryption of requests between these components.
|
||||
It is recommended to use [vmauth](https://docs.victoriametrics.com/victoriametrics/vmauth/).
|
||||
For advanced setups, refer to the [multi-level cluster setup](#multi-level-cluster-setup) documentation.
|
||||
|
||||
See also [multi-level cluster setup](#multi-level-cluster-setup).
|
||||
## High availability
|
||||
|
||||
In the cluster setup, the following rules apply:
|
||||
|
||||
- The `vlselect` component requires **all relevant vlstorage nodes to be available** in order to return complete and correct query results.
|
||||
|
||||
- If even one of the vlstorage nodes is temporarily unavailable, `vlselect` cannot safely return a full response, since some of the required data may reside on the missing node. Rather than risk delivering partial or misleading query results, which can cause confusion, trigger false alerts, or produce incorrect metrics, VictoriaLogs chooses to return an error instead.
|
||||
|
||||
- The `vlinsert` component continues to function normally when some vlstorage nodes are unavailable. It automatically routes new logs to the remaining available nodes to ensure that data ingestion remains uninterrupted and newly received logs are not lost.
|
||||
|
||||
> [!NOTE] Insight
|
||||
> In most real-world cases, `vlstorage` nodes become unavailable during planned maintenance such as upgrades, config changes, or rolling restarts. These are typically infrequent (weekly or monthly) and brief (a few minutes).
|
||||
> A short period of query downtime during such events is acceptable and fits well within most SLAs. For example, 60 minutes of downtime per month still provides around 99.86% availability, which often outperforms complex HA setups that rely on opaque auto-recovery and may fail unpredictably.
|
||||
|
||||
VictoriaLogs itself does not handle replication at the storage level. Instead, it relies on an external log shipper, such as [vector](https://docs.victoriametrics.com/victorialogs/data-ingestion/vector/) or [vlagent](https://github.com/VictoriaMetrics/VictoriaMetrics/pull/9034), to send the same log stream to multiple independent VictoriaLogs instances:
|
||||
|
||||
```mermaid
|
||||
graph TD
|
||||
subgraph "HA Solution"
|
||||
subgraph "Ingestion Layer"
|
||||
LS["Log Sources<br/>(Applications)"]
|
||||
VECTOR["Log Collector<br/>• Buffering<br/>• Replication<br/>• Delivery Guarantees"]
|
||||
end
|
||||
|
||||
subgraph "Storage Layer"
|
||||
subgraph "Zone A"
|
||||
VLA["VictoriaLogs Cluster A"]
|
||||
end
|
||||
|
||||
subgraph "Zone B"
|
||||
VLB["VictoriaLogs Cluster B"]
|
||||
end
|
||||
end
|
||||
|
||||
subgraph "Query Layer"
|
||||
LB["Load Balancer<br/>(vmauth)<br/>• Health Checks<br/>• Failover<br/>• Query Distribution"]
|
||||
QC["Query Clients<br/>(Grafana, API)"]
|
||||
end
|
||||
|
||||
LS --> VECTOR
|
||||
VECTOR -->|"Replicate logs to<br/>Zone A cluster"| VLA
|
||||
VECTOR -->|"Replicate logs to<br/>Zone B cluster"| VLB
|
||||
|
||||
VLA -->|"Serve queries from<br/>Zone A cluster"| LB
|
||||
VLB -->|"Serve queries from<br/>Zone B cluster"| LB
|
||||
LB --> QC
|
||||
|
||||
style VECTOR fill:#e8f5e8
|
||||
style VLA fill:#d5e8d4
|
||||
style VLB fill:#d5e8d4
|
||||
style LB fill:#e1f5fe
|
||||
style QC fill:#fff2cc
|
||||
style LS fill:#fff2cc
|
||||
end
|
||||
```
|
||||
|
||||
In this HA solution:
|
||||
|
||||
- A log shipper at the top receives logs and replicates them in parallel to two VictoriaLogs clusters.
|
||||
- If one cluster fails completely (i.e., **all** of its storage nodes become unavailable), the log shipper continues to send logs to the remaining healthy cluster and buffers any logs that cannot be delivered. When the failed cluster becomes available again, the log shipper resumes sending both buffered and new logs to it.
|
||||
- On the read path, a load balancer (e.g., vmauth) sits in front of the VictoriaLogs clusters and routes query requests to any healthy cluster.
|
||||
- If one cluster fails (i.e., **at least one** of its storage nodes is unavailable), the load balancer detects this and automatically redirects all query traffic to the remaining healthy cluster.
|
||||
|
||||
There's no hidden coordination logic or consensus algorithm. You can scale it horizontally and operate it safely, even in bare-metal Kubernetes clusters using local PVs, as long as the log shipper handles reliable replication and buffering.
|
||||
|
||||
## Single-node and cluster mode duality
|
||||
|
||||
Every `vlstorage` node can be used as a single-node VictoriaLogs instance:
|
||||
@@ -189,7 +274,7 @@ Start `vlselect` node, which [accepts incoming queries](https://docs.victoriamet
|
||||
|
||||
Note that all the VictoriaLogs cluster components - `vlstorage`, `vlinsert` and `vlselect` - share the same executable - `victoria-logs-prod`.
|
||||
Their roles depend on whether the `-storageNode` command-line flag is set - if this flag is set, then the executable runs in `vlinsert` and `vlselect` modes.
|
||||
Otherwise it runs in `vlstorage` mode, which is identical to a [single-node VictoriaLogs mode](https://docs.victoriametrics.com/victorialogs/).
|
||||
Otherwise, it runs in `vlstorage` mode, which is identical to a [single-node VictoriaLogs mode](https://docs.victoriametrics.com/victorialogs/).
|
||||
|
||||
Let's ingest some logs (aka [wide events](https://jeremymorrell.dev/blog/a-practitioners-guide-to-wide-events/))
|
||||
from [GitHub archive](https://www.gharchive.org/) into the VictoriaLogs cluster with the following command:
|
||||
|
||||
@@ -28,12 +28,12 @@ See [the list of supported Journald fields](https://www.freedesktop.org/software
|
||||
|
||||
## Level field
|
||||
|
||||
VictoriaLogs atomatically sets the `level` log field according to the [`PRIORITY` field falue](https://wiki.archlinux.org/title/Systemd/Journal).
|
||||
VictoriaLogs automatically sets the `level` log field according to the [`PRIORITY` field value](https://wiki.archlinux.org/title/Systemd/Journal).
|
||||
|
||||
## Stream fields
|
||||
|
||||
VictoriaLogs uses `(_MACHINE_ID, _HOSTNAME, _SYSTEMD_UNIT)` as [stream fields](https://docs.victoriametrics.com/victorialogs/keyconcepts/#stream-fields)
|
||||
for logs ingested via jorunald protocol. The list of log stream fields can be changed via `-journald.streamFields` command-line flag if needed,
|
||||
for logs ingested via journald protocol. The list of log stream fields can be changed via `-journald.streamFields` command-line flag if needed,
|
||||
by providing comma-separated list of journald fields form [this list](https://www.freedesktop.org/software/systemd/man/latest/systemd.journal-fields.html).
|
||||
|
||||
Please make sure that the log stream fields passed to `-journlad.streamFields` do not contain fields with high number or unbound number of unique values,
|
||||
|
||||
@@ -94,7 +94,7 @@ Loki allows applying filters to log labels with `{...} | label op value` syntax:
|
||||
according to [these docs](https://docs.victoriametrics.com/victorialogs/logsql/#logical-filter).
|
||||
|
||||
* `{...} | label > value`, `{...} label >= value`, `{...} label < value` and `{...} label <= value`.
|
||||
This is eqvalent to `{...} label:>value`, `{...} label:>=value`, `{...} label:<value` and `{...} label:<=value`
|
||||
This is equivalent to `{...} label:>value`, `{...} label:>=value`, `{...} label:<value` and `{...} label:<=value`
|
||||
in VictoriaLogs. See [these docs](https://docs.victoriametrics.com/victorialogs/logsql/#range-comparison-filter).
|
||||
|
||||
* `{...} | label ~= value`. This is equivalent to `{...} label:~value` in VictoriaLogs.
|
||||
@@ -192,7 +192,7 @@ Loki provides the ability to drop log labels with the `{...} | drop label1, ...,
|
||||
according to [these docs](https://grafana.com/docs/loki/latest/query/log_queries/#drop-labels-expression).
|
||||
The similar syntax is also supported by VictoriaLogs. See [these docs](https://docs.victoriametrics.com/victorialogs/logsql/#delete-pipe).
|
||||
|
||||
Lokis supports conditional dropping of labels with the `{...} | drop label="value"` syntax.
|
||||
Loki supports conditional dropping of labels with the `{...} | drop label="value"` syntax.
|
||||
This can be replaced with [conditional format](https://docs.victoriametrics.com/victorialogs/logsql/#conditional-format) at VictoriaLogs:
|
||||
|
||||
```logsql
|
||||
@@ -266,7 +266,7 @@ can be substituted with the simple `{...} | count()` query at VictoriaLogs.
|
||||
|
||||
### Unwrapped range aggregations
|
||||
|
||||
Loki allows calculating metrics from label values by using the `func_name({...} | unwrap label_name)` syntax. There is no need in unrapping any labels in VictoriaLogs -
|
||||
Loki allows calculating metrics from label values by using the `func_name({...} | unwrap label_name)` syntax. There is no need in unwrapping any labels in VictoriaLogs -
|
||||
just pass the needed label names into the needed [`stats` pipe function](https://docs.victoriametrics.com/victorialogs/logsql/#stats-pipe-functions).
|
||||
|
||||
VictoriaLogs aggregates all the selected logs by default, while Loki groups stats by log stream. Use `... | stats by (_stream) ...`
|
||||
|
||||
@@ -128,7 +128,7 @@ See also:
|
||||
|
||||
## How to select logs with all the given words in log message?
|
||||
|
||||
Just enumerate the needed [words](https://docs.victoriametrics.com/victorialogs/logsql/#word) in the query, by deliming them with whitespace.
|
||||
Just enumerate the needed [words](https://docs.victoriametrics.com/victorialogs/logsql/#word) in the query, by delimiting them with whitespace.
|
||||
For example, the following query selects logs containing both `error` and `kubernetes` [words](https://docs.victoriametrics.com/victorialogs/logsql/#word)
|
||||
in the [log message](https://docs.victoriametrics.com/victorialogs/keyconcepts/#message-field):
|
||||
|
||||
|
||||
@@ -56,7 +56,7 @@ FROM <table>
|
||||
```
|
||||
|
||||
The `<filters>` part selects the needed logs (rows) according to the provided [filters](https://docs.victoriametrics.com/victorialogs/logsql/#filters).
|
||||
Then the provided [pipes](https://docs.victoriametrics.com/victorialogs/logsql/#pipes) are executed sequentlially.
|
||||
Then the provided [pipes](https://docs.victoriametrics.com/victorialogs/logsql/#pipes) are executed sequentially.
|
||||
Every such pipe receives all the rows from the previous stage, performs some calculations and/or transformations,
|
||||
and then pushes the resulting rows to the next stage. This simplifies reading and understanding the query - just read it from the beginning
|
||||
to the end in order to understand what does it do at every stage.
|
||||
|
||||
@@ -1,29 +0,0 @@
|
||||
VictoriaMetrics Cloud is a managed, easy to use monitoring solution that integrates seamlessly with
|
||||
other tools and frameworks in the Observability ecosystem such as OpenTelemetry, Grafana, Prometheus, Graphite,
|
||||
InfluxDB, OpenTSDB and DataDog - see [these docs](https://docs.victoriametrics.com/victoriametrics/single-server-victoriametrics/#how-to-import-time-series-data)
|
||||
for further details about importing time series data into VictoriaMetrics.
|
||||
|
||||
<br>
|
||||
|
||||

|
||||
<br>
|
||||
|
||||
## Get Started
|
||||
* [Quick Start](https://docs.victoriametrics.com/victoriametrics-cloud/get-started/quickstart/) documentation.
|
||||
* [Try it now](https://console.victoriametrics.cloud/signUp?utm_source=website&utm_campaign=docs_overview) with a free trial.
|
||||
|
||||
|
||||
## Use cases
|
||||
VictoriaMetrics Cloud is designed for teams and organizations that handle any volume of metrics. The most common use cases for VictoriaMetrics Cloud are:
|
||||
* Long-term remote storage for Prometheus, OpenTelemetry and any other standardized metrics.
|
||||
* Reliable and efficient drop-in replacement for Prometheus and Graphite.
|
||||
* Easy and cost-saving enterprise managed alternative solution for Prometheus, Thanos, Mimir or Cortex.
|
||||
* Efficient replacement for InfluxDB and OpenTSDB by consuming lower amounts of RAM, CPU and disk.
|
||||
* Cost-efficient alternative for other Observability services like DataDog or Grafana Cloud.
|
||||
|
||||
Discover VictoriaMetrics Cloud Features and Benefits [here](https://docs.victoriametrics.com/victoriametrics-cloud/get-started/features/).
|
||||
|
||||
## Learn more
|
||||
* [VictoriaMetrics Cloud announcement](https://victoriametrics.com/blog/introduction-to-managed-monitoring/).
|
||||
* [Pricing comparison for Managed Prometheus](https://victoriametrics.com/blog/managed-prometheus-pricing/).
|
||||
* [Monitoring Proxmox VE via VictoriaMetrics Cloud and vmagent](https://victoriametrics.com/blog/proxmox-monitoring-with-dbaas/).
|
||||
@@ -1,17 +0,0 @@
|
||||
---
|
||||
title: VictoriaMetrics Cloud
|
||||
weight: 40
|
||||
menu:
|
||||
docs:
|
||||
weight: 40
|
||||
identifier: cloud
|
||||
pageRef: /victoriametrics-cloud/
|
||||
tags:
|
||||
- metrics
|
||||
- cloud
|
||||
- enterprise
|
||||
aliases:
|
||||
- /victoriametrics-cloud/index.html
|
||||
- /managed-victoriametrics/index.html
|
||||
---
|
||||
{{% content "README.md" %}}
|
||||
@@ -1,24 +0,0 @@
|
||||
---
|
||||
title: Account Management
|
||||
weight:
|
||||
disableToc: true
|
||||
menu:
|
||||
docs:
|
||||
weight: 2
|
||||
parent: cloud
|
||||
identifier: account-management
|
||||
pageRef: /victoriametrics-cloud/account-management/
|
||||
tags:
|
||||
- metrics
|
||||
- cloud
|
||||
- enterprise
|
||||
---
|
||||
This section contains all the information related to users and accounts management. Remember that you
|
||||
can always get started rapidly following the short guide under the [Quick Start](https://docs.victoriametrics.com/victoriametrics-cloud/get-started/quickstart/) section.
|
||||
|
||||
Here, the following information is presented:
|
||||
|
||||
* [Registration and Trial](https://docs.victoriametrics.com/victoriametrics-cloud/account-management/registration-and-trial/), including authentication methods, trial period information and how to continue using VictoriaMetrics Cloud after the trial period expires.
|
||||
* [Account and Profile](https://docs.victoriametrics.com/victoriametrics-cloud/account-management/account-and-profile/), including how to change passwords.
|
||||
* [Roles and permissions](https://docs.victoriametrics.com/victoriametrics-cloud/account-management/roles-and-permissions/), to know more about user privilege and actions.
|
||||
* [User Management](https://docs.victoriametrics.com/victoriametrics-cloud/account-management/user-management/), to learn how to add, edit and remove users.
|
||||
@@ -1,21 +0,0 @@
|
||||
---
|
||||
weight: 2
|
||||
title: Account and Profile
|
||||
disableToc: true
|
||||
menu:
|
||||
docs:
|
||||
parent: account-management
|
||||
weight: 2
|
||||
tags:
|
||||
- metrics
|
||||
- cloud
|
||||
- enterprise
|
||||
---
|
||||
|
||||
Upon registration, every user is assigned to a profile and a [role](https://docs.victoriametrics.com/victoriametrics-cloud/account-management/roles-and-permissions/).
|
||||
|
||||
If forgot your password, it can always be restored by clicking the `Forgot password?` link on the
|
||||
[Sign In](https://console.victoriametrics.cloud/signIn?utm_source=website&utm_campaign=docs_quickstart) page.
|
||||
|
||||
If you need to change your authentication method, or need assistance, don't hesitate to contact our
|
||||
support team at support-cloud@victoriametrics.com.
|
||||
@@ -1,81 +0,0 @@
|
||||
---
|
||||
weight: 5
|
||||
title: Organizations in VictoriaMetrics Cloud
|
||||
menu:
|
||||
docs:
|
||||
parent: account-management
|
||||
weight: 5
|
||||
name: Organizations
|
||||
---
|
||||
|
||||
Organizations in VictoriaMetrics Cloud are designed to streamline team collaboration, improve
|
||||
access control, and simplify scaling observability across multiple teams and environments.
|
||||
|
||||
By using Organizations, users can invite collaborators, assign specific roles and permissions,
|
||||
and organize deployments under a structured access model. This provides a more secure and
|
||||
efficient way to manage access, scale operations, and maintain governance.
|
||||
|
||||
## Getting started with Organizations
|
||||
New users of VictoriaMetrics Cloud registered via the [SignUp](https://console.victoriametrics.cloud/signUp)
|
||||
page are automatically enrolled into a new Organization, where they can invite other new or
|
||||
existing users.
|
||||
|
||||
|
||||
## Working with Organizations
|
||||
|
||||
The left navigation menu of the VictoriaMetrics Cloud console is divided into Services (top) and Organizations (bottom).
|
||||
All features described here are easily accessible through that menu.
|
||||
|
||||
{{% collapse name="User Management" %}}
|
||||
|
||||
The `User Management` page inside the Organizations menu allows to:
|
||||
- Invite new users to collaborate
|
||||
- Check activity, creation time and authentication methods used by users part of the Organization
|
||||
- Manage other users
|
||||
|
||||
Organization `Admins` can perform the following `Actions` on other existing users:
|
||||
- Manage their [`roles`](https://docs.victoriametrics.com/victoriametrics-cloud/account-management/roles-and-permissions/)
|
||||
- `Deactivate` or `Activate` them: Deactivated users are still part of VictoriaMetrics Cloud but cannot perform actions inside the Organization
|
||||
- `Delete` them from the Organization
|
||||
|
||||
{{% /collapse %}}
|
||||
|
||||
|
||||
{{% collapse name="API Keys" %}}
|
||||
|
||||
[API Keys](https://docs.victoriametrics.com/victoriametrics-cloud/api/) are needed to enforce
|
||||
authentication in programmatic actions (for example, in scripts) to interact with VictoriaMetrics Cloud.
|
||||
The API itself is documented in the [api-docs](https://console.victoriametrics.cloud/api-docs) page.
|
||||
|
||||
In the [API Keys](https://console.victoriametrics.cloud/api_keys) page, Organization Admins can:
|
||||
* Create API Keys, giving them an easily identifiable `Name`, set the `Lifetime`, `Permissions` (Read, Write or both), and grant permissions to all or specific VictoriaMetrics Cloud deployments.
|
||||
* Check existing API Keys relevant information
|
||||
* Revoke previously generated API Keys
|
||||
|
||||
{{% /collapse %}}
|
||||
|
||||
{{% collapse name="Billing" %}}
|
||||
|
||||
Centralized billing information can be accessed through the [Billing Page](https://console.victoriametrics.cloud/billing).
|
||||
Here Organization `Admins` can check usage, manage Payment Methods, download invoices and check ongoing spends.
|
||||
|
||||
For more billing related information, read the [Billing documentation](https://docs.victoriametrics.com/victoriametrics-cloud/billing/) page.
|
||||
|
||||
{{% /collapse %}}
|
||||
|
||||
{{% collapse name="Audit Logs" %}}
|
||||
|
||||
VictoriaMetrics Cloud provides centralized access to [Audit Logs](https://console.victoriametrics.cloud/audit) for Organizations.
|
||||
Here, `Admins` can check events performed by other Organization users within VictoriaMetrics Cloud.
|
||||
Audit logs can be filtered by Action, Email or Date.
|
||||
|
||||
VictoriaMetrics Cloud also enables Exporting Audit Logs as CSV.
|
||||
|
||||
{{% /collapse %}}
|
||||
|
||||
{{% collapse name="Details" %}}
|
||||
|
||||
Organization `Admins` can change their Organization name or leave an Organization in the `Details` [page](https://console.victoriametrics.cloud/organization).
|
||||
|
||||
{{% /collapse %}}
|
||||
|
||||
@@ -1,40 +0,0 @@
|
||||
---
|
||||
weight: 1
|
||||
title: Registration and Trial
|
||||
disableToc: true
|
||||
menu:
|
||||
docs:
|
||||
parent: account-management
|
||||
weight: 1
|
||||
tags:
|
||||
- metrics
|
||||
- cloud
|
||||
- enterprise
|
||||
---
|
||||
|
||||
Start your registration process by visiting the [Sign Up](https://console.victoriametrics.cloud/signUp?utm_source=website&utm_campaign=docs_registration_and_trial) page.
|
||||
|
||||
## Authentication methods
|
||||
|
||||
VictoriaMetrics Cloud supports user registration and authentication via the following mechanisms:
|
||||
|
||||
1. Sign up with Google.
|
||||
2. Email and password.
|
||||
|
||||
|
||||
## Trial period and credits
|
||||
|
||||
After registration, every new user is granted with $`200` in credits to spend during the trial period.
|
||||
The trial period starts once the first deployment is created and lasts for `30` days.
|
||||
|
||||
In general, VictoriaMetrics Cloud billing is based on the time a deployment consumes resources (stopped deployments consume storage).
|
||||
This means that, during the trial period, you are welcome to start, test and delete as many VictoriaMetrics
|
||||
Cloud deployments as you wish.
|
||||
|
||||
Adding a payment method is not required to register or make use of deployments during the trial period. Once the credits are expired,
|
||||
existing trial deployments will be automatically deleted. If you add a [payment method](https://docs.victoriametrics.com/victoriametrics-cloud/billing/#payment-methods),
|
||||
the service won't be disrupted and you will be charged on that one once the credits are exhausted.
|
||||
|
||||
## After trial version expires
|
||||
When the trial period ends, adding a [payment method](https://docs.victoriametrics.com/victoriametrics-cloud/billing/#payment-methods) will let you continue
|
||||
using VictoriaMetrics Cloud. After the trial period expires, deployments will be stopped and deleted after 7 days if no payment methods are found for your account. If you need assistance or have any questions, don't hesitate to contact our support team at support-cloud@victoriametrics.com.
|
||||
@@ -1,111 +0,0 @@
|
||||
---
|
||||
weight: 3
|
||||
title: Roles and Permissions
|
||||
disableToc: true
|
||||
menu:
|
||||
docs:
|
||||
parent: account-management
|
||||
weight: 3
|
||||
tags:
|
||||
- metrics
|
||||
- cloud
|
||||
- enterprise
|
||||
---
|
||||
|
||||
## User roles
|
||||
|
||||
VictoriaMetrics Cloud provides different levels of user access based on role definitions.
|
||||
Roles determine the information that users can access and edit inside VictoriaMetrics Cloud in
|
||||
different `Categories`, such as Deployments, Billing or Notifications, for example. The full list of roles
|
||||
definitions can be found in the [table](#roles-and-permissions) below.
|
||||
|
||||
Organization Administrators can assign and change other users roles both during the user creation procedure or afterwards. See the [User Management](https://docs.victoriametrics.com/victoriametrics-cloud/account-management/user-management/)
|
||||
section for more information.
|
||||
|
||||
### Roles and permissions
|
||||
|
||||
<table class="params">
|
||||
<tr>
|
||||
<td><strong>User Role</strong></td>
|
||||
<td><strong>Categories</strong></td>
|
||||
<td><strong>Permissions</strong></td>
|
||||
</tr>
|
||||
<tr>
|
||||
<td rowspan="7" ><strong>Admin</strong></td>
|
||||
<td>Deployments</td>
|
||||
<td>
|
||||
Access to all deployments tabs and information
|
||||
<p>Create, update and delete deployment</p>
|
||||
</td>
|
||||
</tr>
|
||||
<tr>
|
||||
<td>Integrations</td>
|
||||
<td>Access to different integration configurations</td>
|
||||
</tr>
|
||||
<tr>
|
||||
<td>Billing</td>
|
||||
<td>Check billing information</td>
|
||||
</tr>
|
||||
<tr>
|
||||
<td>Notifications</td>
|
||||
<td>Create and update notifications</td>
|
||||
</tr>
|
||||
<tr>
|
||||
<td>Audit Logs</td>
|
||||
<td>Can check all information in audit logs</td>
|
||||
</tr>
|
||||
<tr>
|
||||
<td>User Management</td>
|
||||
<td>Add, edit and delete users</td>
|
||||
</tr>
|
||||
<tr>
|
||||
<td>API Keys</td>
|
||||
<td>Add, edit and delete API Keys</td>
|
||||
</tr>
|
||||
<tr>
|
||||
<td rowspan="3"><strong>Editor</strong></td>
|
||||
<td>Deployments</td>
|
||||
<td>
|
||||
Access to all deployments tabs and information
|
||||
<p>Create, update and delete deployment</p>
|
||||
</td>
|
||||
</tr>
|
||||
<tr>
|
||||
<td>Notifications</td>
|
||||
<td>Create and update notifications</td>
|
||||
</tr>
|
||||
<tr>
|
||||
<td>Audit Logs</td>
|
||||
<td>Can check all information in audit logs</td>
|
||||
</tr>
|
||||
<tr>
|
||||
<td><strong>Viewer</strong></td>
|
||||
<td>Deployments</td>
|
||||
<td>Access to Overview, Monitoring, Explore and Alerts deployments tabs and information</td>
|
||||
</tr>
|
||||
</table>
|
||||
|
||||
### Profile status
|
||||
|
||||
Profile lifecycle comprises different statuses depending on where they are in their registration process.
|
||||
If you think your profile is in a wrong status or need assistance, don't hesitate to contact our
|
||||
support team at support-cloud@victoriametrics.com.
|
||||
|
||||
<table class="params">
|
||||
<tr>
|
||||
<td><strong>Active</strong></td>
|
||||
<td>The user can log in and use VictoriaMetrics Cloud. The user role defines the access level.</td>
|
||||
</tr>
|
||||
<tr>
|
||||
<td><strong>Pending Invitation</strong></td>
|
||||
<td>An invitation was sent. The user must accept this.</td>
|
||||
</tr>
|
||||
<tr>
|
||||
<td><strong>Expired Invitation</strong></td>
|
||||
<td>An invitation was expired. The admin should resend invitation to the user.</td>
|
||||
</tr>
|
||||
<tr>
|
||||
<td><strong>Inactive</strong></td>
|
||||
<td>The user is registered in the VictoriaMetrics Cloud but has no access to perform any actions. Admin can activate or completely delete the user.</td>
|
||||
</tr>
|
||||
</table>
|
||||
@@ -1,59 +0,0 @@
|
||||
---
|
||||
weight: 4
|
||||
title: User Management in VictoriaMetrics Cloud
|
||||
menu:
|
||||
docs:
|
||||
parent: account-management
|
||||
weight: 4
|
||||
name: User Management
|
||||
tags:
|
||||
- metrics
|
||||
- cloud
|
||||
- enterprise
|
||||
aliases:
|
||||
- /victoriametrics-cloud/user-managment/index.html
|
||||
- /victoriametrics-cloud/user-management/index.html
|
||||
- /managed-victoriametrics/user-management/index.html
|
||||
---
|
||||
The User Management system enables VictoriaMetrics Cloud Administrators to control user access and
|
||||
onboard or offboard users to their Organization. It categorizes users according to their needs and role.
|
||||
|
||||
Administrators can manage users in the [User Management section](https://cloud.victoriametrics.com/users), which provides a
|
||||
user list where actions can be applied:
|
||||
|
||||
|
||||
| **User Management field** | **Description** |
|
||||
|------------------------------------|-----------------------------------|
|
||||
| **`Email`** | Registration user email. |
|
||||
| **`Status`** | User profile [status](https://docs.victoriametrics.com/victoriametrics-cloud/account-management/roles-and-permissions#profile-status). |
|
||||
| **`User Role`** | Admin, Editor or Viewer. See description [here](https://docs.victoriametrics.com/victoriametrics-cloud/account-management/roles-and-permissions#roles-and-permissions). |
|
||||
| **`Created At`** | Date on which this user was created. |
|
||||
| **`Last Active`** | User's last login date and time. |
|
||||
| **`Auth method`** | User's [authentication method](https://docs.victoriametrics.com/victoriametrics-cloud/account-management/registration-and-trial/#authentication-methods). |
|
||||
| **`Actions`** | Click here to manage the user. |
|
||||
|
||||
## Adding Users
|
||||
|
||||
Users can be added to VictoriaMetrics Cloud by sending an invitation. Invitations can be sent by
|
||||
clicking on `Invite User` in the [User Management section](https://cloud.victoriametrics.com/users).
|
||||
|
||||
After filling out the form, click on the `Invite` button.
|
||||
The user will be saved, and an invitation email to the provided email address will be sent. As a confirmation, you will see the success message.
|
||||
|
||||
> The invitation link is only active for 24 hours.
|
||||
|
||||
The user will remain at the `Pending Invitation` [status](https://docs.victoriametrics.com/victoriametrics-cloud/account-management/roles-and-permissions#profile-status)
|
||||
until the invitation is accepted. At his point the user is all set and transitions to the `Active` status.
|
||||
|
||||
## Updating Users
|
||||
|
||||
Users can be activated, deactivated or modified, including their role, under the `Actions` menu and selecting `Manage`.
|
||||
|
||||
## Deleting Users
|
||||
|
||||
Users can also be deleted from an Organization. Simply navigate to the [User Management section](https://cloud.victoriametrics.com/users),
|
||||
and select `Delete user` under the `Actions` menu.
|
||||
|
||||
## Resending invitations
|
||||
|
||||
If an invitation is expired, you can always to resend the invite to the user, by clicking on the `Resend invitation` button.
|
||||
@@ -1,301 +0,0 @@
|
||||
---
|
||||
weight: 16
|
||||
title: Alerting with vmalert and VictoriaMetrics Cloud
|
||||
menu:
|
||||
docs:
|
||||
parent: "cloud"
|
||||
weight: 16
|
||||
tags:
|
||||
- metrics
|
||||
- cloud
|
||||
- enterprise
|
||||
- guide
|
||||
aliases:
|
||||
- /victoriametrics-cloud/alerting-vmalert-victoria-metrics-cloud/index.html
|
||||
- /managed-victoriametrics/alerting-vmalert-victoria-metrics-cloud/index.html
|
||||
---
|
||||
|
||||
This guide explains the different ways in which you can use vmalert in conjunction with VictoriaMetrics Cloud
|
||||
|
||||

|
||||
|
||||
## Preconditions
|
||||
|
||||
* [vmalert](https://docs.victoriametrics.com/victoriametrics/vmalert/) is installed. You can obtain it by building it from [source](https://docs.victoriametrics.com/victoriametrics/vmalert/#quickstart), downloading it from the [GitHub releases page](https://github.com/VictoriaMetrics/VictoriaMetrics/releases/latest), or using the docker image [Docker Hub](https://hub.docker.com/r/victoriametrics/vmalert) or [Quay](https://quay.io/repository/victoriametrics/vmalert?tab=tags) for the container ecosystem (such as docker, k8s, etc.).
|
||||
* [Alertmanager](https://prometheus.io/docs/alerting/latest/alertmanager/) is installed.
|
||||
* You have a [single or cluster](https://docs.victoriametrics.com/victoriametrics-cloud/quickstart/#creating-deployment) deployment in [VictoriaMetrics Cloud](https://docs.victoriametrics.com/victoriametrics-cloud/overview/).
|
||||
* If you are using helm, add the [VictoriaMetrics helm chart](https://docs.victoriametrics.com/helm/victoriametrics-alert#how-to-install) repository to your helm repositories. This step is optional.
|
||||
* If you are using [vmoperator](https://docs.victoriametrics.com/operator/quick-start/#quick-start), make sure that it and its CRDs are installed. This step is also optional.
|
||||
|
||||
## Setup
|
||||
|
||||
### Alerting and recording rules file(s)
|
||||
|
||||
You need to prepare file(s) with alerting or recording rules.
|
||||
|
||||
An example file with one alerting rule.
|
||||
|
||||
alerts.yml
|
||||
|
||||
```yaml
|
||||
groups:
|
||||
- name: common
|
||||
rules:
|
||||
- alert: instanceIsDown
|
||||
for: 1m
|
||||
expr: up == 0
|
||||
labels:
|
||||
severity: critical
|
||||
annotations:
|
||||
summary: "{{ $labels.job }} instance: {{$labels.instance }} is not up"
|
||||
description: "Job {{ $labels.job }} instance: {{$labels.instance }} is not up for the last 1 minute"
|
||||
```
|
||||
|
||||
### VictoriaMetrics Cloud access token and deployment endpoint
|
||||
|
||||
To use vmalert with VictoriaMetrics Cloud, you must create a read/write token, or use an existing one. The token must have write access to ingest recording rules, ALERTS and ALERTS_FOR_STATE metrics, and read access for rules evaluation.
|
||||
|
||||
For instructions on how to create tokens, please refer to this section of the [documentation](https://docs.victoriametrics.com/victoriametrics-cloud/quickstart/#deployment-access).
|
||||
|
||||
#### Single-Node
|
||||
|
||||

|
||||

|
||||
|
||||
#### Cluster
|
||||
|
||||

|
||||

|
||||

|
||||
|
||||
### vmalert configuration
|
||||
|
||||
#### Single-Node
|
||||
|
||||
##### Binary
|
||||
|
||||
```sh
|
||||
export TOKEN=81e8226e-****-****-****-************
|
||||
export MANAGED_VM_URL=https://gw-c15-1c.cloud.victoriametrics.com
|
||||
export ALERTMANAGER_URL=http://localhost:9093
|
||||
./vmalert -rule=alerts.yml -datasource.url=$MANAGED_VM_URL -datasource.bearerToken=$TOKEN -notifier.url=$ALERTMANAGER_URL -remoteWrite.url=$MANAGED_VM_URL -remoteWrite.bearerToken=$TOKEN -remoteRead.url=$MANAGED_VM_URL -remoteRead.bearerToken=$TOKEN
|
||||
```
|
||||
|
||||
##### Docker
|
||||
|
||||
```sh
|
||||
export TOKEN=81e8226e-****-****-****-************
|
||||
export MANAGED_VM_URL=https://gw-c15-1c.cloud.victoriametrics.com
|
||||
export ALERTMANAGER_URL=http://alertmanager:9093
|
||||
docker run -it -p 8080:8080 -v $(pwd)/alerts.yml:/etc/alerts/alerts.yml victoriametrics/vmalert:v1.87.1 -datasource.url=$MANAGED_VM_URL -datasource.bearerToken=$TOKEN -remoteRead.url=$MANAGED_VM_URL -remoteRead.bearerToken=$TOKEN -remoteWrite.url=$MANAGED_VM_URL -remoteWrite.bearerToken=$TOKEN -notifier.url=$ALERTMANAGER_URL -rule="/etc/alerts/*.yml"
|
||||
```
|
||||
|
||||
##### Helm Chart
|
||||
|
||||
```sh
|
||||
export TOKEN=81e8226e-****-****-****-************
|
||||
export MANAGED_VM_URL=https://gw-c15-1c.cloud.victoriametrics.com
|
||||
export ALERTMANAGER=http://alertmanager:9093
|
||||
cat <<EOF | helm install vmalert vm/victoria-metrics-alert -f -
|
||||
server:
|
||||
datasource:
|
||||
url: $MANAGED_VM_URL
|
||||
bearer:
|
||||
token: $TOKEN
|
||||
remote:
|
||||
write:
|
||||
url: $MANAGED_VM_URL
|
||||
bearer:
|
||||
token: $TOKEN
|
||||
read:
|
||||
url: $MANAGED_VM_URL
|
||||
bearer:
|
||||
token: $TOKEN
|
||||
notifier:
|
||||
alertmanager:
|
||||
url: $ALERTMANAGER
|
||||
config:
|
||||
alerts:
|
||||
groups:
|
||||
- name: common
|
||||
rules:
|
||||
- alert: instanceIsDown
|
||||
for: 1m
|
||||
expr: up == 0
|
||||
labels:
|
||||
severity: critical
|
||||
annotations:
|
||||
summary: "{{ $labels.job }} instance: {{$labels.instance }} is not up"
|
||||
description: "Job {{ $labels.job }} instance: {{$labels.instance }} is not up for the last 1 minute"
|
||||
EOF
|
||||
```
|
||||
|
||||
##### VMalert CRD for vmoperator
|
||||
|
||||
```sh
|
||||
export TOKEN=81e8226e-****-****-****-************
|
||||
export MANAGED_VM_URL=https://gw-c15-1c.cloud.victoriametrics.com
|
||||
export ALERTMANAGER=http://alertmanager:9093
|
||||
cat << EOF | kubectl apply -f -
|
||||
apiVersion: operator.victoriametrics.com/v1beta1
|
||||
kind: VMAlert
|
||||
metadata:
|
||||
name: vmalert-managed-vm
|
||||
spec:
|
||||
replicaCount: 1
|
||||
datasource:
|
||||
url: $MANAGED_VM_URL
|
||||
bearerTokenSecret:
|
||||
name: managed-token
|
||||
key: token
|
||||
remoteWrite:
|
||||
url: $MANAGED_VM_URL
|
||||
bearerTokenSecret:
|
||||
name: managed-token
|
||||
key: token
|
||||
remoteRead:
|
||||
url: $MANAGED_VM_URL
|
||||
bearerTokenSecret:
|
||||
name: managed-token
|
||||
key: token
|
||||
notifier:
|
||||
url: $ALERTMANAGER
|
||||
ruleSelector:
|
||||
matchLabels:
|
||||
type: managed
|
||||
---
|
||||
apiVersion: v1
|
||||
kind: Secret
|
||||
metadata:
|
||||
name: managed-token
|
||||
stringData:
|
||||
token: $TOKEN
|
||||
EOF
|
||||
```
|
||||
|
||||
##### Testing
|
||||
|
||||
You can ingest metric that will raise an alert
|
||||
|
||||
```sh
|
||||
export TOKEN=81e8226e-****-****-****-*************
|
||||
export MANAGED_VM_URL=https://gw-c15-1c.cloud.victoriametrics.com/
|
||||
curl -H "Authorization: Bearer $TOKEN" -X POST "$MANAGED_VM_URLapi/v1/import/prometheus" -d 'up{job="vmalert-test", instance="localhost"} 0'
|
||||
```
|
||||
|
||||
#### Cluster
|
||||
|
||||
##### Binary
|
||||
|
||||
```sh
|
||||
export TOKEN=76bc5470-****-****-****-************
|
||||
export MANAGED_VM_READ_URL=https://gw-c15-1a.cloud.victoriametrics.com/select/0/prometheus/
|
||||
export MANAGED_VM_WRITE_URL=https://gw-c15-1a.cloud.victoriametrics.com/insert/0/prometheus/
|
||||
export ALERTMANAGER_URL=http://localhost:9093
|
||||
./vmalert -rule=alerts.yml -datasource.url=$MANAGED_VM_READ_URL -datasource.bearerToken=$TOKEN -notifier.url=$ALERTMANAGER_URL -remoteWrite.url=$MANAGED_VM_WRITE_URL -remoteWrite.bearerToken=$TOKEN -remoteRead.url=$MANAGED_VM_READ_URL -remoteRead.bearerToken=$TOKEN
|
||||
```
|
||||
|
||||
##### Docker
|
||||
|
||||
```sh
|
||||
export TOKEN=76bc5470-****-****-****-************
|
||||
export MANAGED_VM_READ_URL=https://gw-c15-1a.cloud.victoriametrics.com/select/0/prometheus/
|
||||
export MANAGED_VM_WRITE_URL=https://gw-c15-1a.cloud.victoriametrics.com/insert/0/prometheus/
|
||||
export ALERTMANAGER_URL=http://alertmanager:9093
|
||||
docker run -it -p 8080:8080 -v $(pwd)/alerts.yml:/etc/alerts/alerts.yml victoriametrics/vmalert:v1.87.1 -datasource.url=$MANAGED_VM_READ_URL -datasource.bearerToken=$TOKEN -remoteRead.url=$MANAGED_VM_READ_URL -remoteRead.bearerToken=$TOKEN -remoteWrite.url=$MANAGED_VM_WRITE_URL -remoteWrite.bearerToken=$TOKEN -notifier.url=$ALERTMANAGER_URL -rule="/etc/alerts/*.yml"
|
||||
```
|
||||
|
||||
##### Helm Chart
|
||||
|
||||
```sh
|
||||
export TOKEN=76bc5470-****-****-****-************
|
||||
export MANAGED_VM_READ_URL=https://gw-c15-1a.cloud.victoriametrics.com/select/0/prometheus/
|
||||
export MANAGED_VM_WRITE_URL=https://gw-c15-1a.cloud.victoriametrics.com/insert/0/prometheus/
|
||||
export ALERTMANAGER=http://alertmanager:9093
|
||||
cat <<EOF | helm install vmalert vm/victoria-metrics-alert -f -
|
||||
server:
|
||||
datasource:
|
||||
url: $MANAGED_VM_READ_URL
|
||||
bearer:
|
||||
token: $TOKEN
|
||||
remote:
|
||||
write:
|
||||
url: $MANAGED_VM_WRITE_URL
|
||||
bearer:
|
||||
token: $TOKEN
|
||||
read:
|
||||
url: $MANAGED_VM_READ_URL
|
||||
bearer:
|
||||
token: $TOKEN
|
||||
notifier:
|
||||
alertmanager:
|
||||
url: $ALERTMANAGER
|
||||
config:
|
||||
alerts:
|
||||
groups:
|
||||
- name: common
|
||||
rules:
|
||||
- alert: instanceIsDown
|
||||
for: 1m
|
||||
expr: up == 0
|
||||
labels:
|
||||
severity: critical
|
||||
annotations:
|
||||
summary: "{{ $labels.job }} instance: {{$labels.instance }} is not up"
|
||||
description: "Job {{ $labels.job }} instance: {{$labels.instance }} is not up for the last 1 minute"
|
||||
EOF
|
||||
```
|
||||
|
||||
##### VMalert CRD for vmoperator
|
||||
|
||||
```sh
|
||||
export TOKEN=76bc5470-****-****-****-************
|
||||
export MANAGED_VM_READ_URL=https://gw-c15-1a.cloud.victoriametrics.com/select/0/prometheus/
|
||||
export MANAGED_VM_WRITE_URL=https://gw-c15-1a.cloud.victoriametrics.com/insert/0/prometheus/
|
||||
export ALERTMANAGER=http://alertmanager:9093
|
||||
cat << EOF | kubectl apply -f -
|
||||
apiVersion: operator.victoriametrics.com/v1beta1
|
||||
kind: VMAlert
|
||||
metadata:
|
||||
name: vmalert-managed-vm
|
||||
spec:
|
||||
replicaCount: 1
|
||||
datasource:
|
||||
url: $MANAGED_VM_READ_URL
|
||||
bearerTokenSecret:
|
||||
name: managed-token
|
||||
key: token
|
||||
remoteWrite:
|
||||
url: $MANAGED_VM_WRITE_URL
|
||||
bearerTokenSecret:
|
||||
name: managed-token
|
||||
key: token
|
||||
remoteRead:
|
||||
url: $MANAGED_VM_READ_URL
|
||||
bearerTokenSecret:
|
||||
name: managed-token
|
||||
key: token
|
||||
notifier:
|
||||
url: $ALERTMANAGER
|
||||
ruleSelector:
|
||||
matchLabels:
|
||||
type: managed
|
||||
---
|
||||
apiVersion: v1
|
||||
kind: Secret
|
||||
metadata:
|
||||
name: managed-token
|
||||
stringData:
|
||||
token: $TOKEN
|
||||
EOF
|
||||
```
|
||||
|
||||
##### Testing
|
||||
|
||||
You can ingest metric that will raise an alert
|
||||
|
||||
```sh
|
||||
export TOKEN=76bc5470-****-****-****-************
|
||||
export MANAGED_VM_WRITE_URL=https://gw-c15-1a.cloud.victoriametrics.com/insert/0/prometheus/
|
||||
curl -H "Authorization: Bearer $TOKEN" -X POST "$MANAGED_VM_WRITE_URLapi/v1/import/prometheus" -d 'up{job="vmalert-test", instance="localhost"} 0'
|
||||
```
|
||||
|
Before Width: | Height: | Size: 201 KiB |
|
Before Width: | Height: | Size: 209 KiB |
|
Before Width: | Height: | Size: 246 KiB |
|
Before Width: | Height: | Size: 43 KiB |
|
Before Width: | Height: | Size: 188 KiB |
|
Before Width: | Height: | Size: 185 KiB |
@@ -1,218 +0,0 @@
|
||||
---
|
||||
weight: 15
|
||||
title: Setup Alertmanager & VMAlert for VictoriaMetrics Cloud
|
||||
menu:
|
||||
docs:
|
||||
parent: "cloud"
|
||||
weight: 15
|
||||
tags:
|
||||
- metrics
|
||||
- cloud
|
||||
- enterprise
|
||||
- guide
|
||||
aliases:
|
||||
- /victoriametrics-cloud/alertmanager-setup-for-deployment/index.html
|
||||
- /managed-victoriametrics/alertmanager-setup-for-deployment/index.html
|
||||
---
|
||||
VictoriaMetrics Cloud supports configuring alerting rules, powered by vmalert, and sending notifications with hosted Alertmanager.
|
||||
|
||||
## Configure Alertmanager
|
||||
|
||||
You have two options to configure Cloud Alertmanager:
|
||||
|
||||
1. From integrations section: Menu **"Integrations" `->` "Cloud Alertmanager" `->` "New configuration"**:
|
||||

|
||||
2. From deployment page: **"Deployment page" `->` "Rules" tab `->` "Settings" `->` "Connect notifier" `/` "New notifier"**:
|
||||

|
||||
|
||||
For creating a new configuration, you need to provide the following parameters:
|
||||
|
||||
- **Name of the configuration** (it only affects the display in the user interface)
|
||||
- **Configuration file** in [specified format](#alertmanager-config-specification)
|
||||
|
||||
Before saving the configuration, you can validate it by clicking the "Test configuration" button.
|
||||
|
||||
After creating the configuration, you can connect it to one or multiple deployments.
|
||||
In order to do this you need to go to the "Deployment page" `->` "Rules" tab `->` "Settings" `,
|
||||
select the created notifier and confirm the action:
|
||||
|
||||

|
||||
|
||||
Alertmanager is now set up for your deployment, and you be able to get notifications from it.
|
||||
|
||||
### Alertmanager config specification
|
||||
|
||||
VictoriaMetrics Cloud supports Alertmanager with standard [configuration specification](https://prometheus.io/docs/alerting/latest/configuration/).
|
||||
|
||||
But with respect to the specification, there are the following limitations:
|
||||
|
||||
1. Only allowed receivers:
|
||||
* `discord_configs`
|
||||
* `pagerduty_configs`
|
||||
* `slack_configs`
|
||||
* `webhook_configs`
|
||||
* `opsgenie_configs`
|
||||
* `wechat_configs`
|
||||
* `pushover_configs`
|
||||
* `victorops_configs`
|
||||
* `telegram_configs`
|
||||
* `webex_configs`
|
||||
* `msteams_configs`
|
||||
2. All configuration params with `_file` suffix are not allowed for security reasons.
|
||||
3. The maximum file size is 20mb.
|
||||
|
||||
### Configuration example
|
||||
|
||||
Here is an example of Alertmanager configuration:
|
||||
|
||||
```yaml
|
||||
route:
|
||||
receiver: slack-infra
|
||||
repeat_interval: 1m
|
||||
group_interval: 30s
|
||||
routes:
|
||||
- matchers:
|
||||
- team = team-1
|
||||
receiver: dev-team-1
|
||||
continue: true
|
||||
- matchers:
|
||||
- team = team-2
|
||||
receiver: dev-team-2
|
||||
continue: true
|
||||
receivers:
|
||||
- name: slack-infra
|
||||
slack_configs:
|
||||
- api_url: https://hooks.slack.com/services/valid-url
|
||||
channel: infra
|
||||
title: |-
|
||||
[{{ .Status | toUpper -}}
|
||||
{{ if eq .Status "firing" }}:{{ .Alerts.Firing | len }}{{- end -}}
|
||||
]
|
||||
{{ if ne .Status "firing" -}}
|
||||
:lgtm:
|
||||
{{- else if eq .CommonLabels.severity "critical" -}}
|
||||
:fire:
|
||||
{{- else if eq .CommonLabels.severity "warning" -}}
|
||||
:warning:
|
||||
{{- else if eq .CommonLabels.severity "info" -}}
|
||||
:information_source:
|
||||
{{- else -}}
|
||||
:question:
|
||||
{{- end }}
|
||||
text: |
|
||||
{{ range .Alerts }}
|
||||
{{- if .Annotations.summary }}
|
||||
Summary: {{ .Annotations.summary }}
|
||||
{{- end }}
|
||||
{{- if .Annotations.description }}
|
||||
Description: {{ .Annotations.description }}
|
||||
{{- end }}
|
||||
{{- end }}
|
||||
actions:
|
||||
- type: button
|
||||
text: 'Query :mag:'
|
||||
url: '{{ (index .Alerts 0).GeneratorURL }}'
|
||||
- type: button
|
||||
text: 'Silence :no_bell:'
|
||||
url: '{{ template "__silenceURL" . }}'
|
||||
- name: dev-team-1
|
||||
slack_configs:
|
||||
- api_url: https://hooks.slack.com/services/valid-url
|
||||
channel: dev-alerts
|
||||
- name: dev-team-2
|
||||
slack_configs:
|
||||
- api_url: https://hooks.slack.com/services/valid-url
|
||||
channel: dev-alerts
|
||||
```
|
||||
|
||||
### Custom Alertmanager
|
||||
|
||||
If for some reason Cloud Alertmanager is not suitable for you, you can use VictoriaMetrics Cloud with any external Alertmanager hosted in your infrastructure.
|
||||
|
||||
For that select Custom Alertmanager instead of Cloud Alertmanager when [creating the Alertmanager](#configure-alertmanager):
|
||||
|
||||

|
||||
|
||||
Limitations for the Custom Alertmanager:
|
||||
|
||||
- Your custom Alertmanager should be available from the Internet via **HTTPS** with **Basic authentication** or **Bearer token authentication**.
|
||||
- You will not be able to use "Alerts" tab on the deployment page.
|
||||
|
||||
You can test the connection to your custom Alertmanager by clicking the "Test connection" button.
|
||||
`/api/v2/status` endpoint is used to verify that connection to Alertmanager is working.
|
||||
|
||||
## Configure alerting and recording rules
|
||||
|
||||
Alerting and recording rules could be uploaded on **"Deployment page" `->` "Rules" tab `->` "Settings"**:
|
||||
|
||||

|
||||
|
||||
You can click on the upload area or drag and drop the files with rules there.
|
||||
|
||||
Files should be in the [Prometheus alerting rules definition format](https://prometheus.io/docs/prometheus/latest/configuration/alerting_rules/)
|
||||
or [Prometheus recording rules definition format](https://prometheus.io/docs/prometheus/latest/configuration/recording_rules/).
|
||||
|
||||
There are limitations for the rules files:
|
||||
|
||||
1. All files may contain no more than 100 rules in total. If you need to upload more rules contact us via [support-cloud@victoriametrics.com](mailto:support-cloud@victoriametrics.com).
|
||||
2. The maximum file size is 20mb.
|
||||
3. The names of the groups in the files should be unique.
|
||||
|
||||
You can also use API for uploading rules. Switch to **"Upload with API"** on the page and follow the instructions:
|
||||
|
||||
- Choose the API key for uploading rules
|
||||
- After that you can copy the curl command for uploading rules and execute it in your terminal
|
||||
|
||||

|
||||
|
||||
You can use the following API endpoints for the automation with rules:
|
||||
|
||||
* POST: `/api/v1/deployments/{deploymentId}/rule-sets/files/{fileName}` - create/update rules file
|
||||
* DELETE `/api/v1/deployments/{deploymentId}/rule-sets/files/{fileName}` - delete rules file
|
||||
|
||||
For more details, please check [OpenAPI Reference](https://console.victoriametrics.cloud/api-docs).
|
||||
|
||||
### Example of alerting rules
|
||||
|
||||
Here is an example of alerting rules in the Prometheus alerting rules format:
|
||||
|
||||
```yaml
|
||||
groups:
|
||||
- name: examples
|
||||
concurrency: 2
|
||||
interval: 10s
|
||||
rules:
|
||||
- alert: never-firing
|
||||
expr: foobar > 0
|
||||
for: 30s
|
||||
labels:
|
||||
severity: warning
|
||||
annotations:
|
||||
summary: empty result rule
|
||||
- alert: always-firing
|
||||
expr: vector(1) > 0
|
||||
for: 30s
|
||||
labels:
|
||||
severity: critical
|
||||
annotations:
|
||||
summary: "rule must be always at firing state"
|
||||
```
|
||||
|
||||
## Troubleshooting
|
||||
|
||||
### Rules execution state
|
||||
|
||||
The state of created rules is located in the `Rules` section of your deployment:
|
||||
|
||||

|
||||
|
||||
### Debug
|
||||
|
||||
It's possible to debug the alerting stack with logs for vmalert and Alertmanager, which are accessible in the `Logs` section of the deployment.
|
||||
|
||||

|
||||
|
||||
### Monitoring
|
||||
|
||||
Alertmanager and vmalert errors are tracked by a built-in monitoring system.
|
||||
Deployment's `Alerts` section has information about active incidents and incident history log.
|
||||
|
Before Width: | Height: | Size: 140 KiB |
|
Before Width: | Height: | Size: 146 KiB |
|
Before Width: | Height: | Size: 138 KiB |
|
Before Width: | Height: | Size: 15 KiB |
|
Before Width: | Height: | Size: 145 KiB |
|
Before Width: | Height: | Size: 29 KiB |
|
Before Width: | Height: | Size: 137 KiB |
|
Before Width: | Height: | Size: 177 KiB |
@@ -1,78 +0,0 @@
|
||||
---
|
||||
weight: 8
|
||||
title: VictoriaMetrics Cloud API Documentation
|
||||
menu:
|
||||
docs:
|
||||
parent: "cloud"
|
||||
weight: 8
|
||||
name: API
|
||||
tags:
|
||||
- metrics
|
||||
- cloud
|
||||
- enterprise
|
||||
---
|
||||
VictoriaMetrics Cloud provides programmatic access for managing cloud resources and is useful for automation with tools like Terraform, OpenTofu, Infrastructure as a Code, GitOps framework, etc.
|
||||
|
||||
## Key Concepts
|
||||
|
||||
* **API Keys**: Used to manage VictoriaMetrics Cloud resources via API.
|
||||
|
||||
**Note: [Access Tokens](https://docs.victoriametrics.com/victoriametrics-cloud/deployments/access-tokens/)** are used for reading and writing data to deployments. They are separate from API Keys and should not be confused. API Keys are specifically for managing resources via the API, while [Access Tokens](https://docs.victoriametrics.com/victoriametrics-cloud/deployments/access-tokens/) handle data access for deployments.
|
||||
|
||||
## API Swagger/OpenAPI Reference: [https://console.victoriametrics.cloud/api-docs](https://console.victoriametrics.cloud/api-docs)
|
||||
|
||||
## API Client
|
||||
|
||||
You can use [victoriametrics-cloud-api-go](https://github.com/VictoriaMetrics/victoriametrics-cloud-api-go) library to integrate your golang projects with VictoriaMetrics Cloud API.
|
||||
This library provides a convenient way to interact with the API, making it easier to manage deployments, access tokens, and other resources programmatically.
|
||||
|
||||
## API Key Properties:
|
||||
|
||||
* **Name**: Human-readable, for team context.
|
||||
* **Lifetime**: Key expiration date (no expiration is an option).
|
||||
* **Permissions**: Read-only or Read/Write access.
|
||||
* **Deployment Access**: Limit access to single, multiple, or all deployments. ***Note**: selecting all deployments in the list and the “All” option are not the same thing, the “All" option will also apply to future deployments that are created.*
|
||||
* **Key** or **Key Value**: Programmatically generated identifier. It's sensitive data used for Authentication. Any operation with API keys (including viewing/revealing Key Value), will be recorded in the [Audit Log](https://docs.victoriametrics.com/victoriametrics-cloud/audit-logs/).
|
||||
|
||||

|
||||
|
||||
## Authentication:
|
||||
|
||||
* **API Key Creation**: Required for using the VictoriaMetrics Cloud API. You need to issue the key manually [here](https://console.victoriametrics.cloud/api_keys).
|
||||
* **HTTP Header**:
|
||||
* **Header Name**: `X-VM-Cloud-Access`
|
||||
* **Header Value**: `<Key-Value>`
|
||||
|
||||
## General information API:
|
||||
|
||||
* **List Cloud Providers**: [API reference](https://console.victoriametrics.cloud/api-docs)
|
||||
* **List Regions**: [API reference](https://console.victoriametrics.cloud/api-docs)
|
||||
* **List Deployment Tiers**: [API reference](https://console.victoriametrics.cloud/api-docs)
|
||||
|
||||
## Deployments API:
|
||||
|
||||
* **List Deployments**: [API reference](https://console.victoriametrics.cloud/api-docs)
|
||||
* **Get Deployment Details**: [API reference](https://console.victoriametrics.cloud/api-docs)
|
||||
* **Create New Deployment**: [API reference](https://console.victoriametrics.cloud/api-docs)
|
||||
* **Update Deployment Parameters**: [API reference](https://console.victoriametrics.cloud/api-docs)
|
||||
* **Delete Deployment**: [API reference](https://console.victoriametrics.cloud/api-docs)
|
||||
|
||||
## Access Tokens API:
|
||||
|
||||
* **List Access Tokens**: [API reference](https://console.victoriametrics.cloud/api-docs)
|
||||
* **Create New Access Token**: [API reference](https://console.victoriametrics.cloud/api-docs)
|
||||
* **Reveal Access Token Secret**: [API reference](https://console.victoriametrics.cloud/api-docs)
|
||||
* **Revoke Access Token**: [API reference](https://console.victoriametrics.cloud/api-docs)
|
||||
|
||||
## Alerting & Recording Rules API:
|
||||
|
||||
* **List Files**: [API reference](https://console.victoriametrics.cloud/api-docs)
|
||||
* **View File**: [API reference](https://console.victoriametrics.cloud/api-docs)
|
||||
* **Upload File**: [API reference](https://console.victoriametrics.cloud/api-docs)
|
||||
* **Delete File**: [API reference](https://console.victoriametrics.cloud/api-docs)
|
||||
|
||||
For detailed setup instructions, check the [VictoriaMetrics Cloud - AlertManager Setup Guide](https://docs.victoriametrics.com/victoriametrics-cloud/alertmanager-setup-for-deployment/).
|
||||
|
||||
## Future API Features:
|
||||
|
||||
* **AlertManager**: Get Config, Upsert Config.
|
||||
|
Before Width: | Height: | Size: 171 KiB |
@@ -1,40 +0,0 @@
|
||||
---
|
||||
weight: 9
|
||||
title: VictoriaMetrics Cloud Audit Logs
|
||||
menu:
|
||||
docs:
|
||||
parent: "cloud"
|
||||
weight: 9
|
||||
name: Audit Logs
|
||||
tags:
|
||||
- metrics
|
||||
- cloud
|
||||
- enterprise
|
||||
---
|
||||
An [**audit log**](https://console.victoriametrics.cloud/audit) is a record of user and system activities within an organization. It captures details of who performed an action, what was done, and when it occurred. Audit logs are essential for security, compliance, and troubleshooting processes.
|
||||
|
||||
## Cloud Audit Log Scopes
|
||||
|
||||
VictoriaMetrics Cloud provides two scopes for audit logs:
|
||||
|
||||
1. **Organization-Level Audit Logs**
|
||||
These logs record all activities at the organization level, such as user logins, token reveals, updates to payment information, and deployments being created or destroyed.
|
||||
2. **Deployment-Level Audit Logs**
|
||||
These logs record activities related to a specific deployment only, such as changes to deployment parameters, creating or deleting access tokens, and modifying alerting or recording rules.
|
||||
|
||||
## Example Log Entry
|
||||
|
||||
* **Time**: 2024-10-0515:40 UTC
|
||||
* **Email**: cloud-admin@victoriametrics.com
|
||||
* **Action**: cluster updated: production-platform, changed properties: vmstorage settings changed: disk size changed from 50.0TB to 80.0TB,
|
||||
|
||||
## Filtering
|
||||
|
||||
The audit log page offers filtering options, allowing you to filter logs by time range, actor, or perform a full-text search by action.
|
||||
|
||||
## Export to CSV
|
||||
|
||||
The Export to CSV button on the audit log page allows you to export the entire audit log as a CSV file.
|
||||
|
||||
Filtering does not affect the export; you will always receive the entire audit log in the exported file.
|
||||
|
||||
@@ -1,124 +0,0 @@
|
||||
---
|
||||
weight: 10
|
||||
title: VictoriaMetrics Cloud Billing
|
||||
menu:
|
||||
docs:
|
||||
parent: "cloud"
|
||||
weight: 10
|
||||
name: Billing
|
||||
tags:
|
||||
- metrics
|
||||
- cloud
|
||||
- enterprise
|
||||
---
|
||||
|
||||
VictoriaMetrics Cloud charges for three key components:
|
||||
|
||||
- **Compute**: The cost of deployment installation.
|
||||
- **Storage**: The storage used by the deployment.
|
||||
- **Network**: External (egress) network usage.
|
||||
|
||||
This breakdown will help you to better understand and manage your costs. Usage data is sent hourly to the payment provider (AWS or Stripe). Detailed billing information is available via the [Billing Page](https://console.victoriametrics.cloud/billing) of your VictoriaMetrics Cloud account.
|
||||
|
||||
Each deployment operates with predefined configurations and limits, protecting you from unexpected overages caused by factors such as:
|
||||
|
||||
* Data ingestion spikes.
|
||||
* Cardinality explosions.
|
||||
* Accidental heavy queries.
|
||||
|
||||
This ensures predictable costs and proactive alerts for workload anomalies.
|
||||
|
||||
__Note__: VictoriaMetrics Cloud does not store or process your payment information. We rely on trusted API providers (Stripe, AWS) for secure payment processing.
|
||||
|
||||
## Pricing
|
||||
|
||||
Pricing begins at **$190/month** for the Starter Tier. To view other tiers and their costs, navigate to the [Create New Deployment](https://console.victoriametrics.cloud/deployments/create) section in the VictoriaMetrics Cloud application.
|
||||
|
||||
Our aim is to make pricing information easy to access and understand. If you have any questions or feedback on our pricing, please contact us.
|
||||
|
||||
|
||||
## Usage Reports
|
||||
|
||||
The [Usage Reports](https://console.victoriametrics.cloud/billing/usage) section in the billing area provides a breakdown of:
|
||||
|
||||
* Storage Costs
|
||||
* Compute Costs
|
||||
* Networking Costs
|
||||
* Applied Credits
|
||||
|
||||
Your Final Monthly Cost is calculated as `usage - credits` and reflects the amount billed by your payment provider.
|
||||
|
||||
A graph is also available to display the daily cost breakdown for the selected month.
|
||||
|
||||
|
||||
## Payment Methods
|
||||
|
||||
VictoriaMetrics Cloud supports the following payment options:
|
||||
|
||||
- Credit Card
|
||||
- AWS Marketplace
|
||||
- ACH Transfers
|
||||
|
||||
You can add multiple payment methods and set one as the primary. Backup payment methods are used if the primary fails. More details are available via the [Payment Methods](https://console.victoriametrics.cloud/billing) tab of the Billing Page.
|
||||
|
||||
### Credit Card
|
||||
|
||||
Credit cards can be added through [Stripe](https://stripe.com/) integration.
|
||||
|
||||
### AWS Marketplace
|
||||
|
||||
Payments made via [AWS Marketplace](https://aws.amazon.com/marketplace/pp/prodview-atfvt3b73m2z4?sr=0-1&ref_=beagle&applicationId=AWSMPContessa) include billing details in the AWS portal. AWS finalizes monthly bills at the start of the next month, typically charging between the 3rd and 5th business day. Visit the [AWS Knowledge Center](https://aws.amazon.com/premiumsupport/knowledge-center/) for more information.
|
||||
|
||||
### ACH Transfers
|
||||
|
||||
ACH payments are supported. Contact [VictoriaMetrics Cloud Support](https://docs.victoriametrics.com/victoriametrics-cloud/support/) for setup assistance.
|
||||
|
||||
|
||||
|
||||
## Invoices
|
||||
|
||||
[Invoices](https://console.victoriametrics.cloud/billing/invoices) are emailed monthly to users who pay via Credit Card or ACH Transfers. Notification email addresses can be updated in the [VictoriaMetrics Cloud Notifications](https://docs.victoriametrics.com/victoriametrics-cloud/setup-notifications/) section.
|
||||
|
||||
Invoices are also accessible on the Invoices Page, which provides:
|
||||
|
||||
* Invoice Period
|
||||
* Invoice Status
|
||||
* Downloadable PDF Links
|
||||
|
||||
For AWS Marketplace billing, check the AWS Portal for invoice information.
|
||||
|
||||
---
|
||||
|
||||
## FAQ
|
||||
|
||||
### What billing options does VictoriaMetrics Cloud support?
|
||||
|
||||
* Monthly Billing: Pay-as-you-go.
|
||||
* Annual/Multi-Year Contracts: Available via AWS or ACH transfers.
|
||||
|
||||
For more information, contact sales@victoriametrics.com.
|
||||
|
||||
### How is deployment usage metered?
|
||||
|
||||
Usage is metered hourly.
|
||||
|
||||
### Do you charge for backups?
|
||||
|
||||
No, backups are provided at no additional cost.
|
||||
|
||||
### How long is the billing cycle?
|
||||
|
||||
Although usage is metered hourly, billing is conducted monthly. The billing date corresponds to the registration date. For example, if you registered on December 5, you will be billed on the 5th of each subsequent month.
|
||||
|
||||
### Can you help reduce my costs?
|
||||
|
||||
We recommend using Enterprise features such as [downsampling](https://docs.victoriametrics.com/victoriametrics/single-server-victoriametrics/#downsampling) and [retention filters](https://docs.victoriametrics.com/victoriametrics/single-server-victoriametrics/#retention-filters) for cost optimization. Contact [VictoriaMetrics Cloud Support](https://docs.victoriametrics.com/victoriametrics-cloud/support/) for assistance.
|
||||
|
||||
### I want to extend my trial or get more credits. What should I do?
|
||||
|
||||
Contact [VictoriaMetrics Cloud Support](https://docs.victoriametrics.com/victoriametrics-cloud/support/) , and we’ll help extend your trial or provide additional credits.
|
||||
|
||||
### How do you charge for spikes in load?
|
||||
|
||||
We don’t charge for spikes. Each deployment has predefined configurations and limits. If a deployment cannot handle a spike, you will receive an alert, allowing you to take proactive measures.
|
||||
|
||||
@@ -1,109 +0,0 @@
|
||||
---
|
||||
weight: 13
|
||||
title: FAQ about VictoriaMetrics Cloud
|
||||
disableToc: true
|
||||
menu:
|
||||
docs:
|
||||
parent: "cloud"
|
||||
weight: 13
|
||||
name: FAQ VictoriaMetrics Cloud
|
||||
tags:
|
||||
- metrics
|
||||
- cloud
|
||||
- enterprise
|
||||
---
|
||||
|
||||
## What authentication and authorization mechanisms does VictoriaMetrics Cloud support?
|
||||
|
||||
* Console (UI) login options can be found in the [Registration and trial](https://docs.victoriametrics.com/victoriametrics-cloud/account-management/registration-and-trial/) section.
|
||||
* To interact programmatically with VictoriaMetrics Cloud deployments (sending or querying data), [bearer tokens](https://docs.victoriametrics.com/victoriametrics-cloud/deployments/access-tokens/) are used. See an example in [Quick start](https://docs.victoriametrics.com/victoriametrics-cloud/get-started/quickstart/#vmagent) or tailored examples under the [Integrations](https://cloud.victoriametrics.com/integrations) section.
|
||||
* To perform console API operations (automated actions with deployments, [access tokens](https://docs.victoriametrics.com/victoriametrics-cloud/deployments/access-tokens/), alerting/recording rules), [API Keys](https://docs.victoriametrics.com/victoriametrics-cloud/api/) are used.
|
||||
|
||||
Our roadmap is always evolving, so feel free to let us know any requirements you may have at support-cloud@victoriametrics.com.
|
||||
|
||||
## What permissions does VictoriaMetrics Cloud require on my AWS resources?
|
||||
VictoriaMetrics Cloud doesn’t require any permissions. Victoria Metrics Cloud instances are not deployed in your environment, but in a separate one. Interactions are made via https.
|
||||
|
||||
## How does VictoriaMetrics Cloud handle data encryption?
|
||||
Information exchange is secured with TLS.
|
||||
|
||||
## Does VictoriaMetrics Cloud require public internet access to AWS services, or can it integrate via AWS Private Link or VPC peering?
|
||||
Victoria Metrics Cloud doesn’t require access to AWS services, quite the opposite: your services need access to VictoriaMetrics Cloud for writing and querying metrics or logs. The only scenario where a call from the platform to your services can occur is when sending notifications about alerts (if you configure the notifications service to be running in your environment).
|
||||
|
||||
It's not mandatory to use public internet access, the option to use AWS Private Link is available, at an extra cost derived from direct AWS cost of the service.
|
||||
|
||||
## What networking requirements does VictoriaMetrics Cloud have (IP whitelisting, VPN, Direct Connect, etc.)?
|
||||
None.
|
||||
|
||||
## Does VictoriaMetrics Cloud support VPC endpoints for secure communication?
|
||||
A [VPC endpoint](https://docs.aws.amazon.com/whitepapers/latest/aws-privatelink/what-are-vpc-endpoints.html)
|
||||
enables users to privately connect to supported AWS services and VPC endpoint services powered by AWS PrivateLink.
|
||||
In summary, PrivateLink can be set up manually on an individual basis, upon request. It also implies extra cost, because there is a cost associated with it in AWS, and it’s not included in the VictoriaMetrics Cloud offering.
|
||||
|
||||
In any case, it’s important to note that connecting via public access is always secured via TLS with all endpoints.
|
||||
|
||||
## How does VictoriaMetrics Cloud ensure data integrity and consistency?
|
||||
We use the VictoriaMetrics Open Source project. To learn more, visit the [Open Source documentation](https://docs.victoriametrics.com/victoriametrics/cluster-victoriametrics/#architecture-overview).
|
||||
|
||||
## How does VictoriaMetrics Cloud handle scalability within AWS resources?
|
||||
VictoriaMetrics Cloud deployments run in isolated environments, so scaling can be done freely. We have processes that ensure zero-downtime in cluster setups and very low downtime for single setups.
|
||||
|
||||
## Are there latency or performance considerations when integrating?
|
||||
* VictoriaMetrics Cloud deployments run in isolated environments, so there’s no interference between users and deployments are expected to run at high performance when compared, for example, with heavy-loaded on-prem setups.
|
||||
* Users can choose between different AWS regions, and selecting one that is closer helps.
|
||||
* The latency induced from running in the cloud is not noticeable for querying in dashboards or ingestion operation.
|
||||
|
||||
Should you need a different region, contact us at support-cloud@victoriametrics.com.
|
||||
|
||||
## What SLAs does VictoriaMetrics Cloud offer for availability and performance?
|
||||
SLA are available on our web site: https://victoriametrics.com/legal/cloud/terms-of-service/#service-levels
|
||||
|
||||
## Does the VictoriaMetrics Cloud provide logging and monitoring capabilities?
|
||||
Yes, logs and some of the metrics for your instances are available in the Victoria Metrics Console, we also provide alert notifications about issues with your instances.
|
||||
|
||||
## Can VictoriaMetrics Cloud integrate with AWS monitoring services like CloudWatch, X-Ray, or AWS Config?
|
||||
We have integration with CloudWatch, you can find it in Console -> Integrations: https://console.victoriametrics.cloud/integrations/cloudwatch
|
||||
Let us know if you need more integrations at support-cloud@victoriametrics.com.
|
||||
|
||||
## What troubleshooting mechanisms are in place for debugging issues?
|
||||
In case of deployment issues, users are notified with alerts, which have recommendations for possible fixes. Instance logs are also available under the Logs tab (log messages also usually contains recommendations) and for instance metrics available in the Monitoring tab of each deployment.
|
||||
|
||||
Apart from that, there are other mechanisms:
|
||||
* Cardinality explorer: https://docs.victoriametrics.com/victoriametrics/single-server-victoriametrics/#cardinality-explorer
|
||||
* Query tracing: https://docs.victoriametrics.com/victoriametrics/single-server-victoriametrics/#query-tracing
|
||||
* Top queries: https://docs.victoriametrics.com/victoriametrics/single-server-victoriametrics/#top-queries
|
||||
* Active queries: https://docs.victoriametrics.com/victoriametrics/single-server-victoriametrics/#active-queries
|
||||
* And other tools (https://docs.victoriametrics.com/victoriametrics/single-server-victoriametrics/#vmui) like Metric relabel debugger, Downsampling filters debugger, Retention filters debugger, Raw query view, etc…
|
||||
|
||||
Also, in case of problems, support is always available to help you at support-cloud@victoriametrics.com.
|
||||
|
||||
## What are the pricing models for VictoriaMetrics Cloud (subscription, usage-based, etc.)?
|
||||
VictoriaMetrics Cloud pricing is based in tiers. Tiers are configured based on a handful of parameters. See [Tier Parameters](https://docs.victoriametrics.com/victoriametrics-cloud/tiers-parameters/) for more information.
|
||||
|
||||
Detailed and updated tier pricing can be checked in the console when [creating deployments](https://cloud.victoriametrics.com/deployments/create).
|
||||
|
||||
## Are there data transfer costs associated with VictoriaMetrics Cloud integrations?
|
||||
Yes. We charge $0.09 per GB for external traffic, which matches AWS’ rate. Estimated traffic costs typically range from $1 to $30 per month, depending on deployment size and regular usage (such as data visualization, evaluation recording, and alerting rules and other integrations).
|
||||
|
||||
## Are there additional costs for API calls or storage?
|
||||
VictoriaMetrics Cloud does not charge extra for API calls.
|
||||
Regarding storage, the price is $1.46 for 10 Gb per Month. Since VictoriaMetrics Cloud is easy to
|
||||
scale, we recommend users to expand storage resources with consumption, instead of allocating all storage space from the beginning.
|
||||
We also offer deduplication and [cardinality explorer](https://docs.victoriametrics.com/victoriametrics/single-server-victoriametrics/#cardinality-explorer) mechanisms
|
||||
to help reducing costs.
|
||||
|
||||
## Can VictoriaMetrics Cloud expenses be consolidated into my AWS bill?
|
||||
Yes. You can subscribe via AWS marketplace (see payment methods [documentation](https://docs.victoriametrics.com/victoriametrics-cloud/billing/#aws-marketplace)).
|
||||
|
||||
## How does billing work?
|
||||
See details in the [billing documentation and dedicated FAQ](https://docs.victoriametrics.com/victoriametrics-cloud/billing/).
|
||||
|
||||
## Where can I check the status of VictoriaMetrics Cloud?
|
||||
We expose the status of the VictoriaMetrics Cloud service in https://status.victoriametrics.com/
|
||||
|
||||
## What's the Privacy Policy of VictoriaMetrics Cloud?
|
||||
VictoriaMetrics Cloud Privacy Policy is available [here](https://cloud.victoriametrics.com/static/pdf/privacy_policy.pdf).
|
||||
|
||||
## Which are VictoriaMetrics Cloud Terms of Service?
|
||||
VictoriaMetrics Cloud Terms of Service are publicly available [here](https://victoriametrics.com/legal/cloud/terms-of-service/), including [SLAs](https://victoriametrics.com/legal/cloud/terms-of-service/#service-levels).
|
||||
|
||||
@@ -1,13 +0,0 @@
|
||||
## Deployments
|
||||
|
||||
VictoriaMetrics Cloud is a DBaaS (Database as a Service) product for VictoriaMetrics.
|
||||
This means that you need to [create a deployment](https://docs.victoriametrics.com/victoriametrics-cloud/get-started/quickstart/#creating-deployments) before sending data to it.
|
||||
It is a fully managed service that allows you to deploy and manage your own instance of VictoriaMetrics
|
||||
in the cloud. Regular use cases of VictoriaMetrics Cloud are monitoring applications, infrastructure, or services,
|
||||
running in different setups like on-prem, Private, Public or Hybrid Cloud, Edge devices or IoT.
|
||||
|
||||
Here you can find more information about deployments:
|
||||
|
||||
- [How to create a deployment](https://docs.victoriametrics.com/victoriametrics-cloud/get-started/quickstart/#creating-deployments)
|
||||
- [Tiers and Deployment Types](https://docs.victoriametrics.com/victoriametrics-cloud/deployments/tiers-and-types/)
|
||||
- [How to use Access tokens to write and read data](https://docs.victoriametrics.com/victoriametrics-cloud/deployments/access-tokens/)
|
||||
@@ -1,14 +0,0 @@
|
||||
---
|
||||
title: Deployments
|
||||
weight: 0
|
||||
menu:
|
||||
docs:
|
||||
weight: 3
|
||||
parent: cloud
|
||||
identifier: deployments
|
||||
pageRef: /victoriametrics-cloud/deployments/
|
||||
aliases:
|
||||
- /victoriametrics-cloud/deployments.html
|
||||
- /managed-victoriametrics/deployments.html
|
||||
---
|
||||
{{% content "README.md" %}}
|
||||
|
Before Width: | Height: | Size: 140 KiB |
@@ -1,172 +0,0 @@
|
||||
---
|
||||
title : "Access tokens"
|
||||
weight: 2
|
||||
menu:
|
||||
docs:
|
||||
parent: "deployments"
|
||||
weight: 2
|
||||
---
|
||||
|
||||
VictoriaMetrics Cloud handles data ingestion and querying in a secure way. That's why we need to
|
||||
have a way to authorize and authenticate requests. [Access tokens](https://en.wikipedia.org/wiki/Access_token)
|
||||
are a widely used mechanism to perform such operations.
|
||||
You can think of them as _technical credentials for reading and writing data to your deployments_.
|
||||
|
||||
In summary, in VictoriaMetrics Cloud, you can create and use different Access tokens (or credentials)
|
||||
to read or write (or both) for each deployment. By using these tokens, when
|
||||
a request is received, VictoriaMetrics Cloud is able to both authorize or deny it and direct it to the correct
|
||||
target deployment.
|
||||
|
||||
Another benefit from this mechanism is that **you only need a url and a token to start sending or
|
||||
retrieving data** to/from VictoriaMetrics Cloud.
|
||||
|
||||
You can easily manage them in the "Access tokens" tab inside the [deployment page](https://console.victoriametrics.cloud/deployments):
|
||||
|
||||

|
||||
|
||||
One ‘default access token’ will always be automatically created for each deployment.
|
||||
|
||||
While you can always make use of this general purpose token, but we strongly
|
||||
recommend [creating a separate token](#how-to-create-access-tokens) for each individual access unit.
|
||||
This best practice will help you to, not only enforce security across your platform, but also easily identify
|
||||
different data sources and take action when/if needed.
|
||||
|
||||
For instance, if you have two separate Kubernetes clusters, you can [create separate write access tokens](#how-to-create-access-tokens)
|
||||
for [vmagent](https://docs.victoriametrics.com/victoriametrics/vmagent/) in each cluster. In this way, every request is easily
|
||||
identified and managed. The same applies to reading data: you may create separate tokens for different Grafana
|
||||
instances with read-only access.
|
||||
|
||||
It allows to:
|
||||
|
||||
- Reduce the blast radius in case of any human error
|
||||
- Easily diagnose and debug problems
|
||||
- Manage rights with more granularity in a safer way
|
||||
- Limit the impact of overloading if limits are exceeded
|
||||
- Secure access partially in case of a leak
|
||||
|
||||
Each Access token has a limit for concurrent requests. You may find more details about it on the [Tier Parameters and Flag Parameters Configuration](https://docs.victoriametrics.com/victoriametrics-cloud/tiers-parameters/) page.
|
||||
You can also check current concurrent requests value for each token on the "Monitoring" tab of the deployment page in the graph "Access token concurrent requests".
|
||||
|
||||
## How to create access tokens
|
||||
|
||||
1. Go to the "Access tokens" tab on the [deployment page](https://console.victoriametrics.cloud/deployments)
|
||||
2. Click "Generate Token" button
|
||||
3. Enter the name of the token (for example "vmagent prod")
|
||||
4. And select the access level:
|
||||
- **Read** - read-only access to the deployment (for data querying tools like Grafana, Perses, etc.)
|
||||
- **Write** - write-only access to the deployment (for data collectors like [vmagent](https://docs.victoriametrics.com/victoriametrics/vmagent/, Prometheus, OpenTelemetry Collector, Telegraf, etc.)
|
||||
- **Read/Write** - read and write access to the deployment (for tools which need to read and write data, like [vmalert](https://docs.victoriametrics.com/victoriametrics/vmalert/))
|
||||
5. For **Cluster deployments** you can also select a specific **tenant** in "Advanced Settings". This will make the token to only work for the specified tenant. Find more details about this option in [How to work with tenants in cluster deployments](#how-to-work-with-tenants-in-cluster-deployments)) section.
|
||||
6. Click "Generate" button
|
||||
|
||||
After that, you can get a [Secret value of the Access token](#working-with-access-token-secrets) and start using it!
|
||||
|
||||
## How to change access token parameters
|
||||
|
||||
Access tokens are immutable - this means that you can’t change any parameter set at the Access token creation phase. If you need to perform any changes, you should [revoke it](#how-to-revoke-access-tokens) and [create new one](#how-to-create-access-tokens) with the desired configuration.
|
||||
|
||||
## Working with access token secrets
|
||||
|
||||
To enable communication between your software and VictoriaMetrics Cloud, you need to use the secret
|
||||
value of an Access token in the following way:
|
||||
|
||||
1. Go to the "Access tokens" tab on the [deployment page](https://console.victoriametrics.cloud/deployments)
|
||||
2. Find the required token in the list
|
||||
3. Click on the value under the "Key" column of this Access token. After that, the secret value of the Access token will be in your clipboard.
|
||||
|
||||
Please, be careful with this value, treat it like a password - do not store or share it in the open.
|
||||
|
||||
This value is the [Bearer token](https://swagger.io/docs/specification/v3_0/authentication/bearer-authentication/),
|
||||
you need to pass it as http header in each request in the following format:
|
||||
|
||||
```
|
||||
Authorization: Bearer <SECRET_VAUE>
|
||||
```
|
||||
|
||||
## Access endpoint
|
||||
|
||||
Each deployment has one access endpoint, i.e., the URL used to communicate with your deployment's API
|
||||
for [writing and reading](#how-to-write-and-read-data-with-access-tokens) data.
|
||||
|
||||
You can find it on "Access tokens" tab or "Overview" tab of the deployment page:
|
||||
|
||||

|
||||
|
||||
You can click on the Access endpoint to copy it to the clipboard.
|
||||
|
||||
The same Access endpoint can be shared between several deployments. Requests routing to the required deployment is done using Access token.
|
||||
|
||||
## How to write and read data with access tokens
|
||||
|
||||
To use Access token for writing data, the following resources are needed:
|
||||
|
||||
- [Secret value of the Access token](#working-with-access-token-secrets)
|
||||
- [Access endpoint](#access-endpoint)
|
||||
- [Required API path of Victoria Metrics deployment](https://docs.victoriametrics.com/victoriametrics/url-examples/)
|
||||
|
||||
You can use the following format for requests to your deployment:
|
||||
|
||||
```
|
||||
POST https://<ACCESS_ENDPOINT>/<API_PATH>
|
||||
Authotization: Bearer <SECRET_VALUE>
|
||||
```
|
||||
|
||||
Please note that API paths are different for Single and Cluster deployments, you can read more details about it in [How to work with tenants in cluster deployments](#how-to-work-with-tenants-in-cluster-deployments)) section.
|
||||
|
||||
The best way to configure writing data to your deployment is to use the [integrations page](https://console.victoriametrics.cloud/integrations)
|
||||
in the [Victoria Metrics Cloud console](https://console.victoriametrics.cloud/integrations) or [Integrations section](https://docs.victoriametrics.com/victoriametrics-cloud/integrations/) of the documentation.
|
||||
If there’s an integration you would like to use and it is currently missing, please [contact us](mailto:support-cloud@victoriametrics.com).
|
||||
|
||||
You can also open the Examples section of Access tokens:
|
||||
|
||||
1. Go to the "Access tokens" tab on the [Deployment page](https://console.victoriametrics.cloud/deployments)
|
||||
2. Find the required token in the list
|
||||
3. Click "..." button in the Actions column next to the required token in the list
|
||||
4. Click "Examples" button and go "Write" or "Read" tab in example dialog
|
||||
5. Choose one of the available examples:
|
||||
|
||||
- For writing: [vmagent](https://docs.victoriametrics.com/victoriametrics/vmagent/), Prometheus or CURL.
|
||||
- For reading: Grafana or CURL.
|
||||
|
||||
You can click on the button in the top right corner to copy command or config to clipboard with the access token substituted in it.
|
||||
|
||||
## How to revoke access tokens
|
||||
|
||||
1. Make sure the token is no longer in use. You can check "Last used at" column on "Access tokens" tab of the deployment page for that.
|
||||
2. Go to the "Access tokens" tab on the [deployment page](https://console.victoriametrics.cloud/deployments)
|
||||
3. Find the required token in the list
|
||||
4. Click "..." button in the Actions column next to the required token in the list
|
||||
5. Click "Delete" button
|
||||
|
||||
## How to work with tenants in Cluster deployments
|
||||
|
||||
Please note that API paths are different for Single and Cluster deployments, for example:
|
||||
|
||||
| Deployment type | URL |
|
||||
|--------------------|------------------------------------------------------------------------|
|
||||
| Single deployment | `https://<ACCESS_ENDPOINT>/api/v1/write` |
|
||||
| Cluster deployment | `https://<ACCESS_ENDPOINT>/insert/<TENANT_ID>/prometheus/api/v1/write` |
|
||||
|
||||
You can read about the difference in [URL format section](https://docs.victoriametrics.com/victoriametrics/cluster-victoriametrics/#url-format)
|
||||
and see examples on [URL examples page](https://docs.victoriametrics.com/victoriametrics/url-examples/).
|
||||
|
||||
The main difference is that cluster deployments are multitenant by default and a special suffix must be added for them, which contains the component prefix (insert/select) and tenant id.
|
||||
More details about multitenancy and tenants can be found in [Multitenancy section](https://docs.victoriametrics.com/victoriametrics/cluster-victoriametrics/#multitenancy).
|
||||
|
||||
Cluster deployment also allows to [create Access tokens](#how-to-create-access-tokens) for specific tenants.
|
||||
In this case, the token will only be able to work with the specified tenant.
|
||||
In order to create an Access token for a specific tenant, you need to specify the tenant under the "Advanced Settings" section of the [token creation dialog](#how-to-create-access-tokens).
|
||||
API paths for such tokens will be the different from not-tenant-specific ones, for example:
|
||||
|
||||
| Access token type | URL |
|
||||
|-----------------------|------------------------------------------------------------------------|
|
||||
| Regular token | `https://<ACCESS_ENDPOINT>/insert/<TENANT_ID>/prometheus/api/v1/write` |
|
||||
| Tenant-specific token | `https://<ACCESS_ENDPOINT>/prometheus/api/v1/write` |
|
||||
|
||||
Thus for tenant-specific tokens the `/insert/<TENANT>` and `/select/<TENANT>` suffix will be added automatically.
|
||||
|
||||
## Difference between Access tokens and API Keys
|
||||
|
||||
- Access tokens are used for using your deployment: [reading and writing](#how-to-write-and-read-data-with-access-tokens) the data.
|
||||
- [API keys](https://docs.victoriametrics.com/victoriametrics-cloud/api/) are used for managing your deployment: creating, updating and deleting it and their resources like Access tokens, alerting rules, etc.
|
||||
This is necessary if you want to manage your monitoring infrastructure (including Victoria Metrics Cloud deployments) as code, for example with Terraform
|
||||
|
Before Width: | Height: | Size: 54 KiB |
@@ -1,190 +0,0 @@
|
||||
---
|
||||
weight: 1
|
||||
title: "Tiers and Deployment Types"
|
||||
menu:
|
||||
docs:
|
||||
parent: "deployments"
|
||||
weight: 8
|
||||
name: "Tiers and Deployment Types"
|
||||
tags:
|
||||
- metrics
|
||||
- cloud
|
||||
- enterprise
|
||||
aliases:
|
||||
- /victoriametrics-cloud/tiers-parameters/index.html
|
||||
---
|
||||
|
||||
VictoriaMetrics Cloud offers two different deployment types: **Single-node** and **Cluster**. Both deployment types are based on the VictoriaMetrics [Open Source project](https://github.com/VictoriaMetrics/VictoriaMetrics/),
|
||||
and managed by the VictoriaMetrics team.
|
||||
|
||||
## Single or Cluster?
|
||||
|
||||
The first choice for users when creating a VictoriaMetrics deployment is to select a Single-node or Cluster deployment type.
|
||||
|
||||
In a nutshell, [Single-node deployments](https://docs.victoriametrics.com/victoriametrics/single-server-victoriametrics/) are useful for affordable and performant instances,
|
||||
while [Cluster deployments](https://docs.victoriametrics.com/victoriametrics/cluster-victoriametrics/) are the ideal choice for those use cases that require high availability and multi-tenancy at scale.
|
||||
More detailed information about the general capabilities of both tiers can be found in this [FAQ](https://docs.victoriametrics.com/victoriametrics/faq/#which-victoriametrics-type-is-recommended-for-use-in-production---single-node-or-cluster).
|
||||
|
||||
More in detail, the following topics should be considered when selecting a deployment type:
|
||||
|
||||
{{% collapse name="Reliability/SLA" %}}
|
||||
|
||||
Both instance types are highly reliable, with SLAs of 99.5% for `Single-node` deployments and 99.9%
|
||||
for `Cluster` deployments.
|
||||
|
||||
{{% /collapse %}}
|
||||
|
||||
{{% collapse name="High Availability" %}}
|
||||
|
||||
Since `Single-node` deployments are just one instance, they cannot be highly available. In practice,
|
||||
this means that during configuration changes and software upgrades, your deployment will experience
|
||||
a few minutes downtime. (This period of unavailability is not included in the SLA).
|
||||
|
||||
On the other hand, `Cluster` deployments do not experience such downtimes.
|
||||
|
||||
{{% /collapse %}}
|
||||
|
||||
{{% collapse name="Multitenancy" %}}
|
||||
|
||||
While [Multitenancy](https://docs.victoriametrics.com/victoriametrics/cluster-victoriametrics/#multitenancy)
|
||||
is supported in the `Cluster` version of VictoriaMetrics Cloud, it is not supported in `Single-node`
|
||||
instances.
|
||||
|
||||
{{% /collapse %}}
|
||||
|
||||
{{% collapse name="Scalability" %}}
|
||||
|
||||
Internally, `Single-node` deployments may be scaled vertically and `Cluster` deployments horizontally.
|
||||
|
||||
In practice, for VictoriaMetrics Cloud tiers, this means that vertical scaling will affect by
|
||||
constraining some parameters such as the maximum storage size, but horizontal scaling has no such
|
||||
limitations.
|
||||
|
||||
{{% /collapse %}}
|
||||
|
||||
{{% collapse name="Data Replication" %}}
|
||||
|
||||
Data replication is provided for `Cluster` deployments only. `Single-node` deployments do not have
|
||||
such capabilities.
|
||||
|
||||
{{% /collapse %}}
|
||||
|
||||
{{% collapse name="Enterprise features" %}}
|
||||
|
||||
[Enterprise features](http://docs.victoriametrics.com/victoriametrics/enterprise/#victoriametrics-enterprise-features)
|
||||
are available in both `Single-node` and `Cluster` versions. Some of them may take a while to be exposed
|
||||
in VictoriaMetrics Cloud. If you are missing any feature, or have any request don't hesitate to
|
||||
contact us at contact us at support-cloud@victoriametrics.com.
|
||||
|
||||
{{% /collapse %}}
|
||||
|
||||
{{% collapse name="Efficiency and performance" %}}
|
||||
|
||||
Both `Single-node` and `Cluster` versions are highly valued for their performance in various benchmarks
|
||||
and use cases in the industry. Feel free to read more about use cases and articles [here](http://docs.victoriametrics.com/victoriametrics/articles/).
|
||||
|
||||
{{% /collapse %}}
|
||||
|
||||
|
||||
## VictoriaMetrics Cloud Parameters: Selecting a Tier
|
||||
|
||||
The next important step when deploying a VictoriaMetrics Cloud instance is to select a `Tier`.
|
||||
Tiers in VictoriaMetrics Cloud are specific presets of `Single-node` or `Cluster` installations
|
||||
of different sizes, that are derived from testing typical monitoring environments.
|
||||
|
||||
> [!IMPORTANT] In summary, you just need to pick the tier that is able to cope with your load.
|
||||
|
||||
In this way, we ensure that tiers are optimized for common use cases, and translated into real-world
|
||||
data (i.e. _parameters_) such as: Ingestion rate, Active Time Series or Read rate.
|
||||
|
||||
### Tier selection Parameters
|
||||
|
||||
The following parameters are presented to the user when selecting a tier:
|
||||
|
||||
| **Parameter** | **Maximum Value** | **Description** |
|
||||
|-------------------------------------------|-----------------------------------|-------------------------------------------------------------------------------------------------------------------------------------------------------------------------------------------------------------------------------------------------|
|
||||
| **Data Ingestion Rate** | Per Tier Limits | Number of [time series](https://docs.victoriametrics.com/victoriametrics/keyconcepts/#time-series) ingested per second. |
|
||||
| **Active Time Series Count** | Per Tier Limits | Number of [active time series](https://docs.victoriametrics.com/victoriametrics/faq/#what-is-an-active-time-series) that received at least one data point in the last hour. |
|
||||
| **Read Rate** | Per Tier Limits | Number of datapoints retrieved from the database per second. |
|
||||
|
||||
<br></br>
|
||||
Every deployment (Single-Node or Cluster) listed indicates the maximum expected load in Ingestion Rate, Active Time Series and Read Rate.
|
||||
|
||||
### Other limits in tiers
|
||||
|
||||
The previous simplified list is made upon several tests and assumptions that cover many general use
|
||||
cases, that lead to establishing other limits that users regularly don't need to take into account
|
||||
when selecting a tier.
|
||||
|
||||
For example, we assume that the Churn Rate is lower than **30%**. You may need to choose a more extensive
|
||||
deployment for higher Churn Rates, or when combined with a high amount of series being read per query.
|
||||
|
||||
Current usage and limits can be checked in the `Monitor` tab of the [deployments](https://console.victoriametrics.cloud/deployments)
|
||||
section per instance.
|
||||
|
||||
A comprehensive list of these parameters is presented here:
|
||||
|
||||
| **Parameter** | **Maximum Value** | **Description** |
|
||||
|-------------------------------------------|-----------------------------------|-------------------------------------------------------------------------------------------------------------------------------------------------------------------------------------------------------------------------------------------------|
|
||||
| **New Series Over 24 Hours** (churn rate) | `<= 30% Active Time Series Count` | Number of new series created in 24 hours. High [churn rate](https://docs.victoriametrics.com/victoriametrics/faq/#what-is-high-churn-rate) leads to higher resource consumption. |
|
||||
| **Concurrent Requests per Token** | `<= 600` | Maximum concurrent requests per [access token](https://docs.victoriametrics.com/victoriametrics-cloud/deployments/access-tokens/). It is recommended to create separate tokens for different users and environments. This can be adjusted via [support](mailto:support-cloud@victoriametrics.com). |
|
||||
|
||||
|
||||
<br></br>
|
||||
For a detailed explanation of each parameter, visit the guide on [Understanding Your Setup Size](https://docs.victoriametrics.com/guides/understand-your-setup-size.html).
|
||||
|
||||
{{% collapse name="Selecting a Tier: Real-world example" %}}
|
||||
|
||||
For a **C.SMALL.HA** `Tier`, you'll find that it's able to process:
|
||||
- ~100k samples/s Ingestion Rate
|
||||
- ~2.5M of Active Time Series
|
||||
|
||||
This means that, with this `Tier` tou can collect metrics from:
|
||||
- 10x Kubernetes cluster with 50 nodes each - 4200 * 10 * 50 = 2.1M
|
||||
- 500 node exporters - 0.5M
|
||||
- With metrics collection interval - 30s
|
||||
|
||||
{{% /collapse %}}
|
||||
|
||||
## Selecting Retention and Storage
|
||||
|
||||
The last parameter needed to set up a deployment is the Storage needed for this deployment. Recommended
|
||||
storage is calculated upon **ingestion rate** and desired **retention**.
|
||||
|
||||
Keeping in mind that storage can always be increased (but not downsized) **users are recommended to start
|
||||
small and scale as needed**.
|
||||
|
||||
> [!TIP] Flexible storage helps to reduce costs and adapt it to your needs.
|
||||
|
||||
For example, the full amount of storage needed for 6 months retention for a given tier will only be
|
||||
reached after those 6 months of operations. There's no need to reserve storage from the beginning.
|
||||
|
||||
Features like Downsampling, Data Deduplication, Cardinality Explorer or Metrics usage are encouraged to
|
||||
further reduce your costs. Feel free to contact [support](mailto:support-cloud@victoriametrics.com) if
|
||||
you need more information.
|
||||
|
||||
## Advanced Parameters: Flags
|
||||
|
||||
Additionally, VictoriaMetrics Cloud exposes certain parameters (or [command-line flags](https://docs.victoriametrics.com/#list-of-command-line-flags))
|
||||
that **advanced users** can tweak on their own under the `Advanced settings` section of every deployment
|
||||
after creation.
|
||||
|
||||
> [!WARNING] Changing default command-line flags may lead to errors
|
||||
> Modifying Advanced parameters can result into changes in resource consumption usage, causing a
|
||||
> deployment not being able to compute the load they were designed to support. In these cases,
|
||||
> a higher tier is most probably needed.
|
||||
|
||||
Some of these advanced parameters are outlined below:
|
||||
|
||||
| **Flag** | **Description** |
|
||||
|----------------------------------------|-----------------------------------------------------------------------------|
|
||||
| <nobr>`-maxLabelsPerTimeseries`</nobr> | Maximum number of labels per time series. Time series with excess labels are dropped. Higher values can increase [cardinality](https://docs.victoriametrics.com/victoriametrics/keyconcepts/#cardinality) and resource usage. |
|
||||
| `-maxLabelValueLen` | Maximum length of label values. Time series with longer values are dropped. Large label values can lead to high RAM consumption. This parameter is not exposed and can only be adjusted via [support](mailto:support-cloud@victoriametrics.com). **In general, label values with high values `~>1kb` are not supported**. |
|
||||
|
||||
## Terms and definitions
|
||||
|
||||
- [Time series](https://docs.victoriametrics.com/victoriametrics/keyconcepts/#time-series)
|
||||
- [Labels](https://docs.victoriametrics.com/victoriametrics/keyconcepts/#labels)
|
||||
- [Active time series](https://docs.victoriametrics.com/victoriametrics/faq/#what-is-an-active-time-series)
|
||||
- [Churn rate](https://docs.victoriametrics.com/victoriametrics/faq/#what-is-high-churn-rate)
|
||||
- [Cardinality](https://docs.victoriametrics.com/victoriametrics/keyconcepts/#cardinality)
|
||||
|
Before Width: | Height: | Size: 49 KiB |
|
Before Width: | Height: | Size: 58 KiB |
|
Before Width: | Height: | Size: 46 KiB |
@@ -1,120 +0,0 @@
|
||||
---
|
||||
weight: 10
|
||||
title: Exploring Data
|
||||
menu:
|
||||
docs:
|
||||
parent: "cloud"
|
||||
weight: 4
|
||||
name: Exploring Data
|
||||
tags:
|
||||
- metrics
|
||||
- cloud
|
||||
- enterprise
|
||||
---
|
||||
|
||||
VictoriaMetrics Cloud helps users to analyze time series data and troubleshoot
|
||||
queries through the built-in `Explore` utility, powered by [VMUI](https://docs.victoriametrics.com/victoriametrics/single-server-victoriametrics/#vmui).
|
||||
This functionality is directly accessible in the two following ways:
|
||||
1. Explore page at [console.victoriametrics.cloud/explore](https://console.victoriametrics.cloud/explore),
|
||||
1. Per deployment, via a dedicated URL pattern: `console.victoriametrics.cloud/deployment/<DEPLOYMENT_ID>/explore`
|
||||
|
||||
## What is VMUI?
|
||||
|
||||
Full VMUI documentation may be found [here](https://docs.victoriametrics.com/victoriametrics/single-server-victoriametrics/#vmui),
|
||||
which is maintained and updated alongside product releases.
|
||||
|
||||
[VMUI](https://docs.victoriametrics.com/victoriametrics/single-server-victoriametrics/#vmui) is the
|
||||
native user interface for VictoriaMetrics, designed to help users explore, troubleshoot, and optimize
|
||||
their queries and metrics. In VictoriaMetrics Cloud, this UI is integrated into the **Explore** view,
|
||||
offering an accessible toolset to [get instant value from data](https://docs.victoriametrics.com/victoriametrics-cloud/get-started/features/#get-instant-value-from-your-data).
|
||||
|
||||
### Playground
|
||||
The best way to understand VMUI is by directly interacting with it. If you are curious, the available
|
||||
[playground](https://play.victoriametrics.com/) allows you to check a real example of a VictoriaMetrics
|
||||
Cluster installation. It is available for testing the query engine, relabeling debugger, other tools
|
||||
and pages provided by VMUI.
|
||||
|
||||
### Visual Query Exploration
|
||||
|
||||
The `Query` utility in the Explore page allows you to easily:
|
||||
* Visualize your own data in graphs, table or json formats
|
||||
* Combine several queries at the same time
|
||||
* Prettify your queries to improve readability
|
||||
* Autocomplete to help you writing queries
|
||||
* Trace your queries to understand behavior
|
||||
|
||||
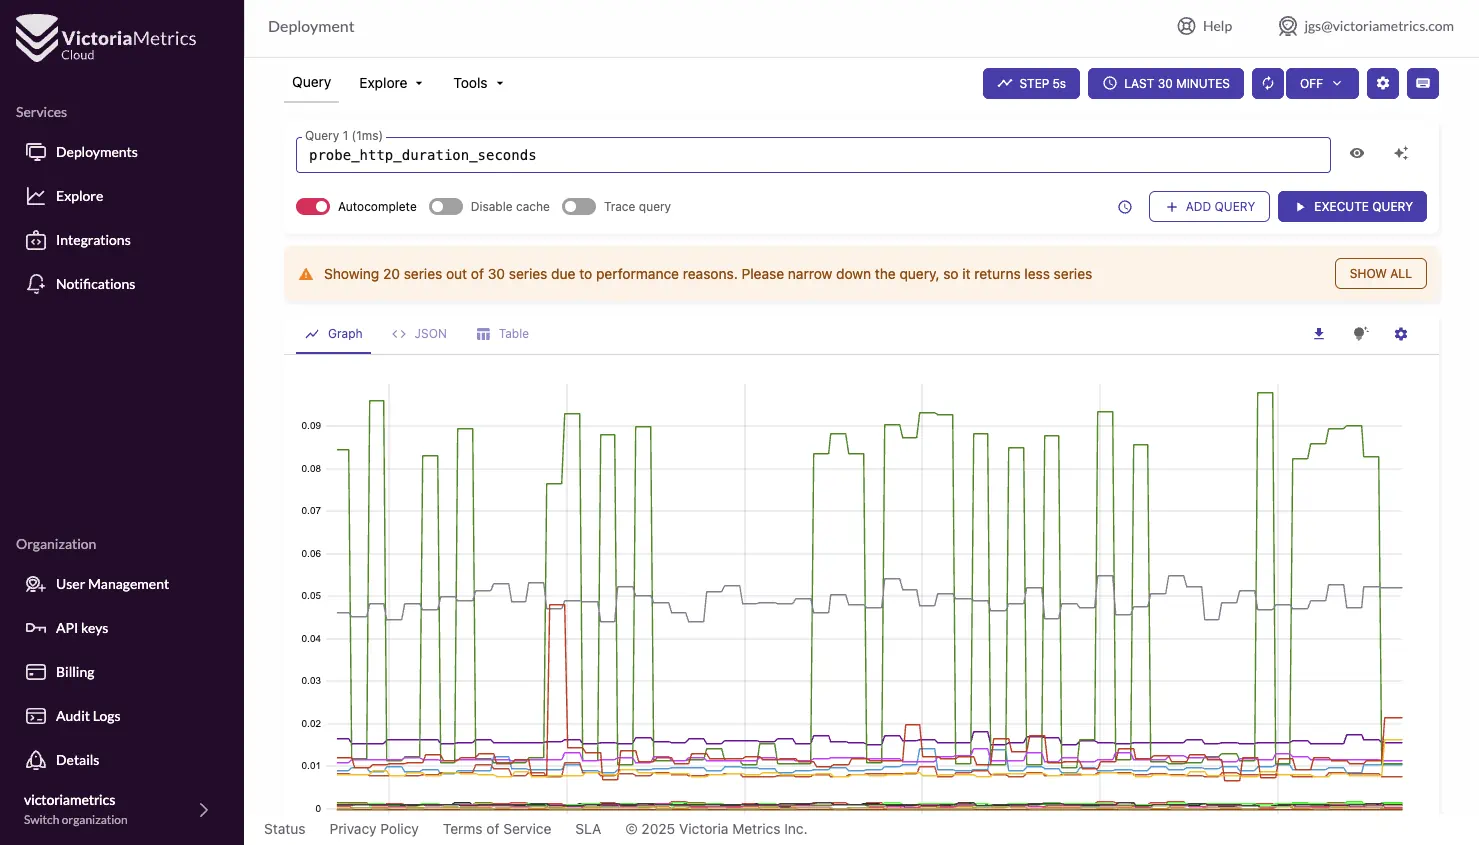
|
||||
<figcaption style="text-align: center; font-style: italic;">Visual Query Exploration in VictoriaMetrics Cloud</figcaption>
|
||||
|
||||
### Exploring metrics
|
||||
|
||||
VMUI provides built-in tools to analyze the structure and volume of your metrics data:
|
||||
|
||||
- **Explore Prometheus Metrics** helps you browse available metrics by job and instance, allowing to build simple charts by just selecting metric names.
|
||||
- **Explore Cardinality** offers insight into the complexity of your time series data, including label dimensions, high-cardinality metrics, and label usage statistics. This is especially useful for optimizing storage and query performance.
|
||||
- **Top Queries** By tracking the last 20,000 queries with durations of at least 1ms, it shows the most frequently executed queries, those with the highest average execution time, and those with the longest cumulative execution time.
|
||||
- **Active Queries** lists currently running queries along with execution duration, time range, and the client that initiated them.
|
||||
|
||||
> [!IMPORTANT] These tools can help you to understand your observability footprint
|
||||
> For example, preventing issues related to excessive cardinality, or debugging performance bottlenecks to identify inefficient queries in real time.
|
||||
|
||||
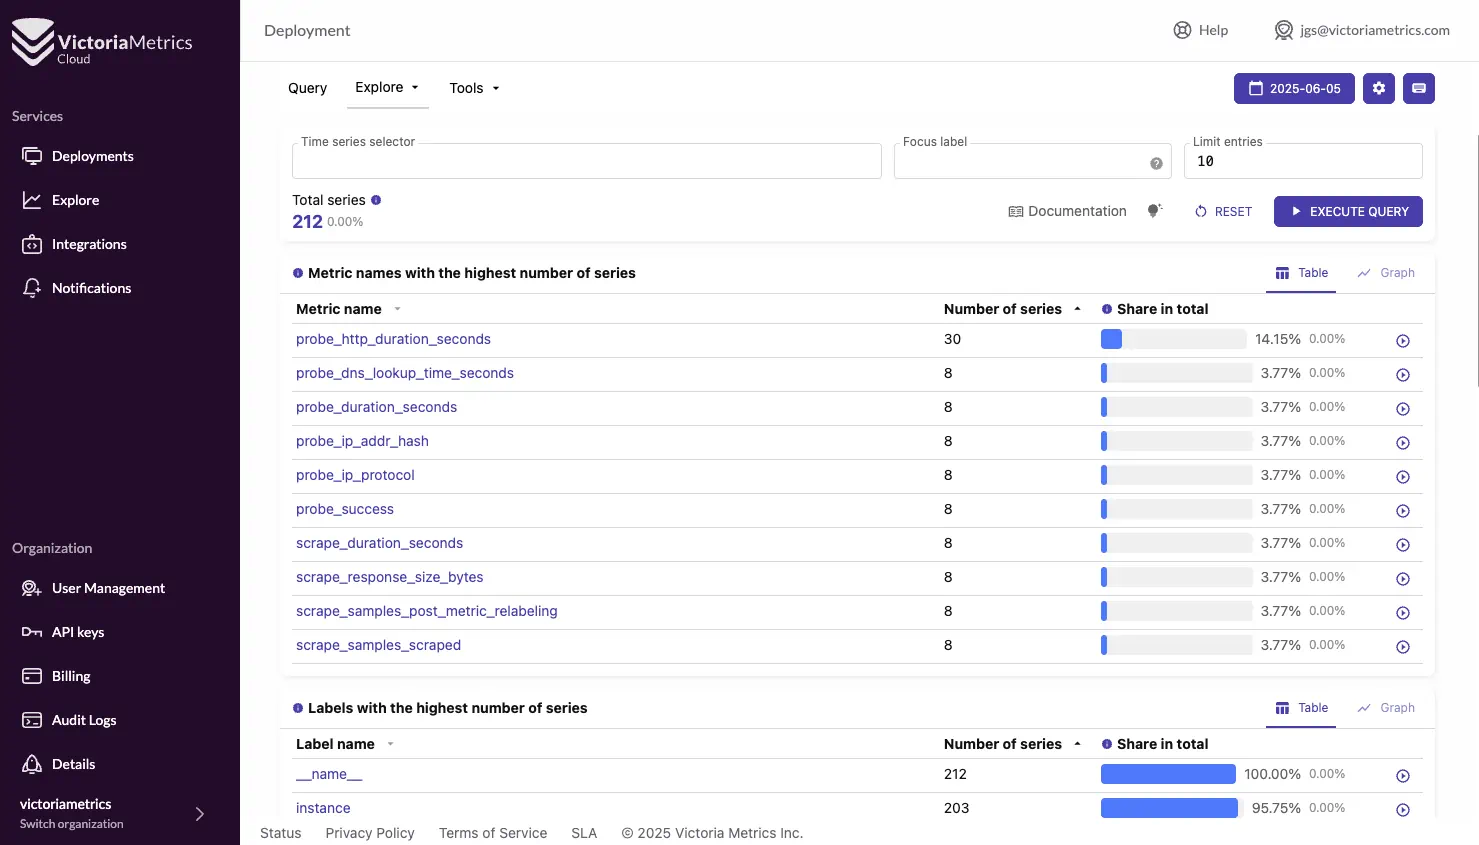
|
||||
<figcaption style="text-align: center; font-style: italic;">Metrics and Cardinality Explorer</figcaption>
|
||||
|
||||
### Debugging and Analysis Utilities
|
||||
|
||||
VMUI offers the following utilities for in-depth debugging:
|
||||
|
||||
- **Raw Query** lets you inspect raw time series samples, aiding in the diagnosis of unexpected results.
|
||||
- **Query and Trace Analyzers** allow you to export and later re-load queries and execution traces for offline inspection.
|
||||
- Tools like the **WITH expressions playground**, **metric relabel debugger**, **downsampling debugger**, and **retention filters debugger** help validate complex configuration logic and query constructs interactively.
|
||||
|
||||
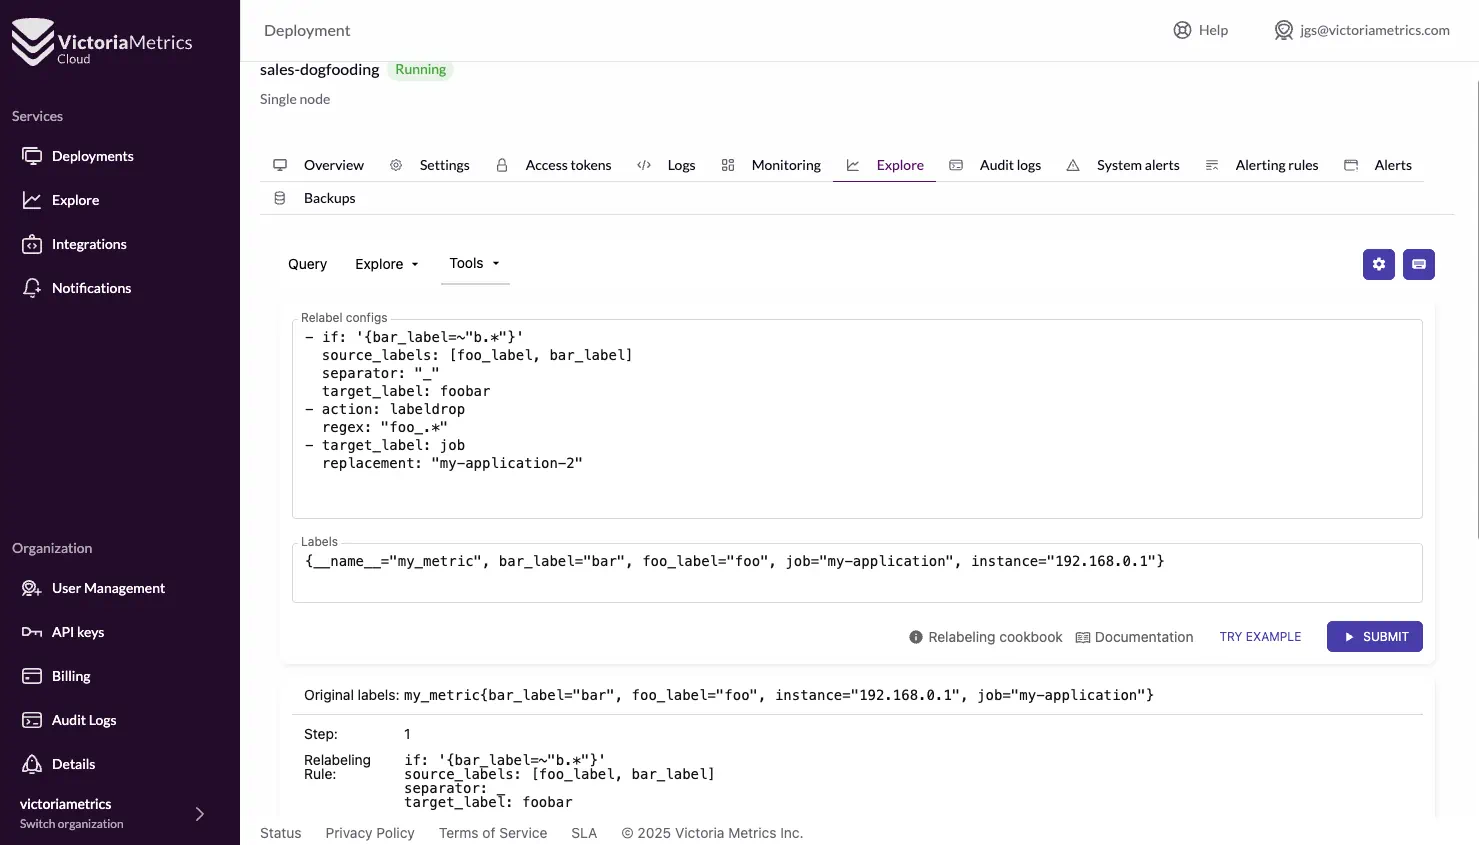
|
||||
<figcaption style="text-align: center; font-style: italic;">Explore tools: Relabel configs</figcaption>
|
||||
|
||||
> [!TIP] Stay up to date!
|
||||
> For the full and always-up-to-date list of features, please refer to the [official VMUI documentation](https://docs.victoriametrics.com/victoriametrics/single-server-victoriametrics/#vmui).
|
||||
|
||||
|
||||
## MetricsQL
|
||||
In addition, VictoriaMetrics Cloud supports advanced querying through [MetricsQL](https://docs.victoriametrics.com/victoriametrics/metricsql/),
|
||||
a powerful PromQL-compatible language that offers enhancements tailored for high-performance
|
||||
environments. MetricsQL is fully supported in the Explore UI and can also be used in
|
||||
[Grafana dashboards](https://docs.victoriametrics.com/grafana/#step-3-configure-the-data-source)
|
||||
for long-term observability workflows.
|
||||
|
||||
### What is MetricsQL?
|
||||
|
||||
[MetricsQL](https://docs.victoriametrics.com/victoriametrics/metricsql/) is VictoriaMetrics' powerful query language, designed as a high-performance, backwards-compatible extension of PromQL (Prometheus Query Language). It retains full compatibility with PromQL syntax while introducing enhancements that make it better suited for large-scale environments and advanced analytics.
|
||||
|
||||
### Using MetricsQL in VictoriaMetrics Cloud
|
||||
|
||||
MetricsQL is natively supported in the **Explore** section of VictoriaMetrics Cloud, where you can write, run, and visualize queries in real time. The interface includes autocomplete for MetricsQL syntax, functions, and label selectors—streamlining query creation and reducing the chance of errors.
|
||||
|
||||
You can also use MetricsQL in [Grafana](https://docs.victoriametrics.com/grafana/#step-3-configure-the-data-source)
|
||||
dashboards by configuring the [VictoriaMetrics data source](https://grafana.com/grafana/plugins/victoriametrics-metrics-datasource/),
|
||||
enabling consistent query logic across operational and visualization layers.
|
||||
|
||||
For deeper usage examples and advanced query patterns, please refer to the [official MetricsQL documentation](https://docs.victoriametrics.com/victoriametrics/metricsql/).
|
||||
|
||||
### Key Functionality in MetricsQL
|
||||
|
||||
MetricsQL extends PromQL with several unique capabilities:
|
||||
|
||||
- **`WITH` expressions**: Define temporary named subqueries to improve readability and reuse logic across queries.
|
||||
- **Performance-tuned functions**: Functions like `avg_over_time`, `count_over_time`, and others are optimized for efficient computation over long durations.
|
||||
- **Flexible filtering**: Enhanced match operators (`=~`, `!~`, `=`, `!=`) and aggregation logic make it easier to craft precise queries.
|
||||
- **Downsampling and rate smoothing**: Built-in functions help reduce noise and CPU cost for long-range queries.
|
||||
|
||||
For a full list of functions and capabilities, see the [MetricsQL reference](https://docs.victoriametrics.com/victoriametrics/metricsql/).
|
||||
|
||||
### Why Use MetricsQL?
|
||||
|
||||
MetricsQL addresses many real-world limitations found in PromQL when working with high-cardinality
|
||||
time series data, large datasets, or complex calculations. It introduces performance optimizations
|
||||
and new functions that enable more flexible, efficient, and maintainable queries. Users benefit from:
|
||||
|
||||
- **Better performance** on large-scale queries
|
||||
- **Enhanced expressiveness** with additional functions and operators
|
||||
- **Improved readability** through support for `WITH` expressions (query macros)
|
||||
- **Lower cost** by optimizing query execution paths
|
||||
@@ -1,30 +0,0 @@
|
||||
---
|
||||
title: Get Started
|
||||
weight: 1
|
||||
disableToc: true
|
||||
menu:
|
||||
docs:
|
||||
weight: 1
|
||||
parent: cloud
|
||||
identifier: get-started
|
||||
pageRef: /victoriametrics-cloud/get-started/
|
||||
tags:
|
||||
- metrics
|
||||
- cloud
|
||||
- enterprise
|
||||
- guide
|
||||
---
|
||||
In this section you will find everything you need to start using [VictoriaMetrics Cloud](https://console.victoriametrics.cloud/signUp?utm_source=website&utm_campaign=docs_vm_get_started).
|
||||
|
||||
* [Overview of VictoriaMetrics Cloud](https://docs.victoriametrics.com/victoriametrics-cloud/get-started/overview/)
|
||||
* [Key Features & Benefits](https://docs.victoriametrics.com/victoriametrics-cloud/get-started/features/)
|
||||
* [Quick Start](https://docs.victoriametrics.com/victoriametrics-cloud/get-started/quickstart/)
|
||||
* [Guides and Best Practices](https://docs.victoriametrics.com/victoriametrics-cloud/get-started/guides/)
|
||||
|
||||
<details>
|
||||
<summary>Learn more about VictoriaMetrics Cloud</summary>
|
||||
|
||||
* [VictoriaMetrics Cloud announcement](https://victoriametrics.com/blog/introduction-to-managed-monitoring/)
|
||||
* [Pricing comparison for Managed Prometheus](https://victoriametrics.com/blog/managed-prometheus-pricing/)
|
||||
* [Monitoring Proxmox VE via VictoriaMetrics Cloud and vmagent](https://victoriametrics.com/blog/proxmox-monitoring-with-dbaas/)
|
||||
</details>
|
||||
|
Before Width: | Height: | Size: 199 KiB |
|
Before Width: | Height: | Size: 218 KiB |
@@ -1,141 +0,0 @@
|
||||
---
|
||||
weight: 2
|
||||
title: Key Features & Benefits
|
||||
menu:
|
||||
docs:
|
||||
parent: get-started
|
||||
weight: 2
|
||||
tags:
|
||||
- metrics
|
||||
- cloud
|
||||
- enterprise
|
||||
aliases:
|
||||
- /victoriametrics-cloud/quickstart/features.html
|
||||
- /managed-victoriametrics/quickstart/features.html
|
||||
---
|
||||
|
||||
VictoriaMetrics Cloud helps optimizing your data and maximizing its value in the most reliable way. It can be used as an **Enterprise-level Managed Prometheus**: just configure Prometheus, [vmagent](https://docs.victoriametrics.com/victoriametrics/vmagent/), an OpenTelemetry Collector or any agent to write data to VictoriaMetrics Cloud, and point Grafana to VictoriaMetrics Cloud by configuring it as a Prometheus datasource.
|
||||
|
||||
## Features
|
||||
VictoriaMetrics Cloud offers a robust suite of features designed to optimize your cloud experience. Seamless integrations, scalability and cost-saving measures, and comprehensive operational tools ensure that VictoriaMetrics Cloud can support your business needs.
|
||||
|
||||
{{% collapse name="Integrations and Compatibility" %}}
|
||||
|
||||
* **Observability protocols**: Prometheus, OpenTelemetry, InfluxDB, DataDog, NewRelic, OpenTSDB & Graphite.
|
||||
* **Data visualization**: Use built-in [VictoriaMetrics UI](https://play.victoriametrics.com/) or integrate seamlessly with your current stack to query and visualize your data in [Grafana](https://grafana.com/) or [Perses](https://perses.dev).
|
||||
* [**AWS PrivateLink**](https://aws.amazon.com/privatelink/): enabling even more secure communication with VictoriaMetrics Cloud deployments directly from your VPC.
|
||||
|
||||
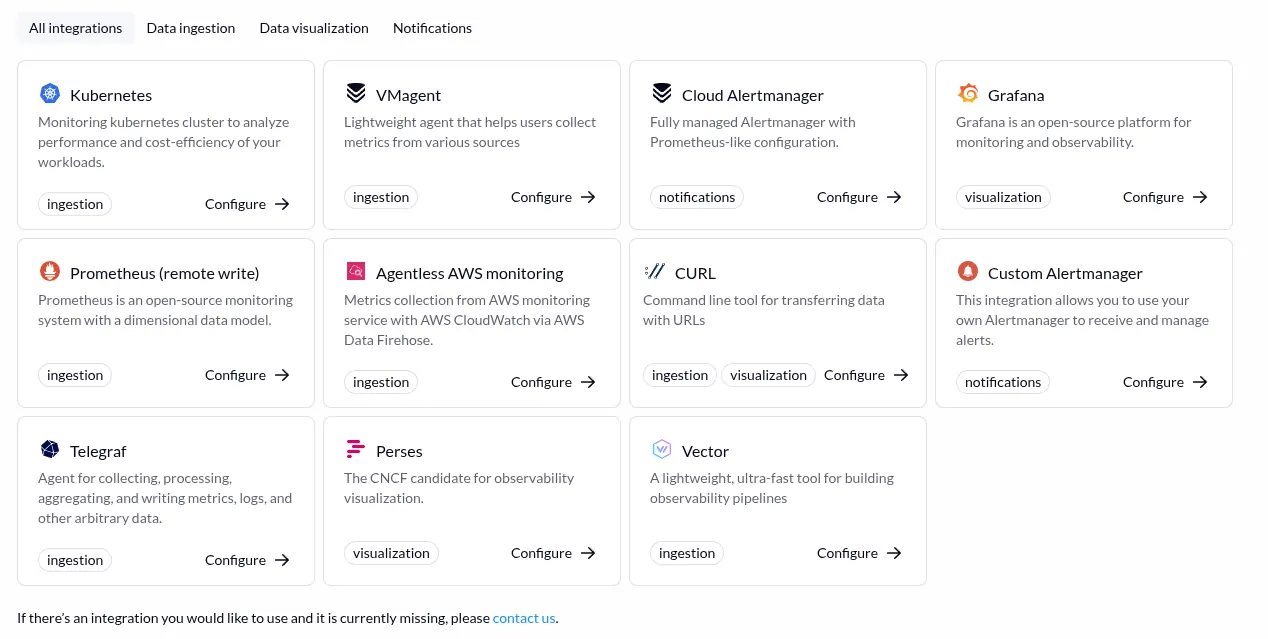
|
||||
<figcaption style="text-align: center; font-style: italic;">VictoriaMetrics Cloud Integrations</figcaption>
|
||||
|
||||
{{% /collapse %}}
|
||||
|
||||
{{% collapse name="Scale as you go and save costs" %}}
|
||||
|
||||
* **Easy Scaling**: VictoriaMetrics Cloud deployments can be scaled up or down with just a few clicks in line with growth and needs.
|
||||
* **Downsampling**: Lower your disk footprint (and save on storage costs!) by keeping fewer data points for historical data and speed up queries for it, while preserving high precision for your operational data.
|
||||
* **Retention filters**: Configure a custom retention period on a team (tenant) level or time series level by using label filters so that unneeded time series are wiped out freeing up storage space for new metrics data enabling additional cost savings
|
||||
* **Recording rules**: Improve query performance with recording rules, facilitating quicker data access & dashboard responsiveness.
|
||||
|
||||
{{% /collapse %}}
|
||||
|
||||
{{% collapse name="Operations" %}}
|
||||
|
||||
* **Enterprise, managed VictoriaMetrics Solution**: Comes with all the proven features in VictoriaMetrics open source & Enterprise.
|
||||
* **Single-node** & **Cluster** configurations with automatic software version and security updates.
|
||||
* Built-in [Alerting & Recording](https://docs.victoriametrics.com/victoriametrics-cloud/alertmanager-setup-for-deployment/#configure-alerting-rules) rules execution. Define your rules & get immediate alerts as issues arise, enabling swift action & minimizing disruption to your users.
|
||||
* Hosted [Alertmanager](https://docs.victoriametrics.com/victoriametrics-cloud/alertmanager-setup-for-deployment/) for sending notifications.
|
||||
* **Isolated Deployments**: VictoriaMetrics Cloud provisions dedicated resources for your deployments, so you won’t encounter “noisy neighbors” problems as deployments do not compete for resources.
|
||||
* **Multitenancy**: Easily serve multiple teams (tenants) with one Cluster deployment by having a dedicated namespace for each team.
|
||||
* **Automated Backups**: Regular backup procedures are in place. Your data is automatically saved to a backup storage, so you can easily restore it when the need arises.
|
||||
* **High-availability** & replication.
|
||||
* **Reliability** & extraordinary performance with 99.95% SLA.
|
||||
|
||||
{{% /collapse %}}
|
||||
|
||||
## Get instant value from your data
|
||||
|
||||
VictoriaMetrics Cloud allows you to explore and optimize both your data and deployments.
|
||||
|
||||
{{% collapse name="Query your own metrics" %}}
|
||||
|
||||
* Visualize your own data in graphs, table or json formats
|
||||
* Combine several queries at the same time
|
||||
* Prettify your queries to improve readability
|
||||
* Autocomplete to help you writing queries
|
||||
* Trace your queries to understand behavior
|
||||
|
||||
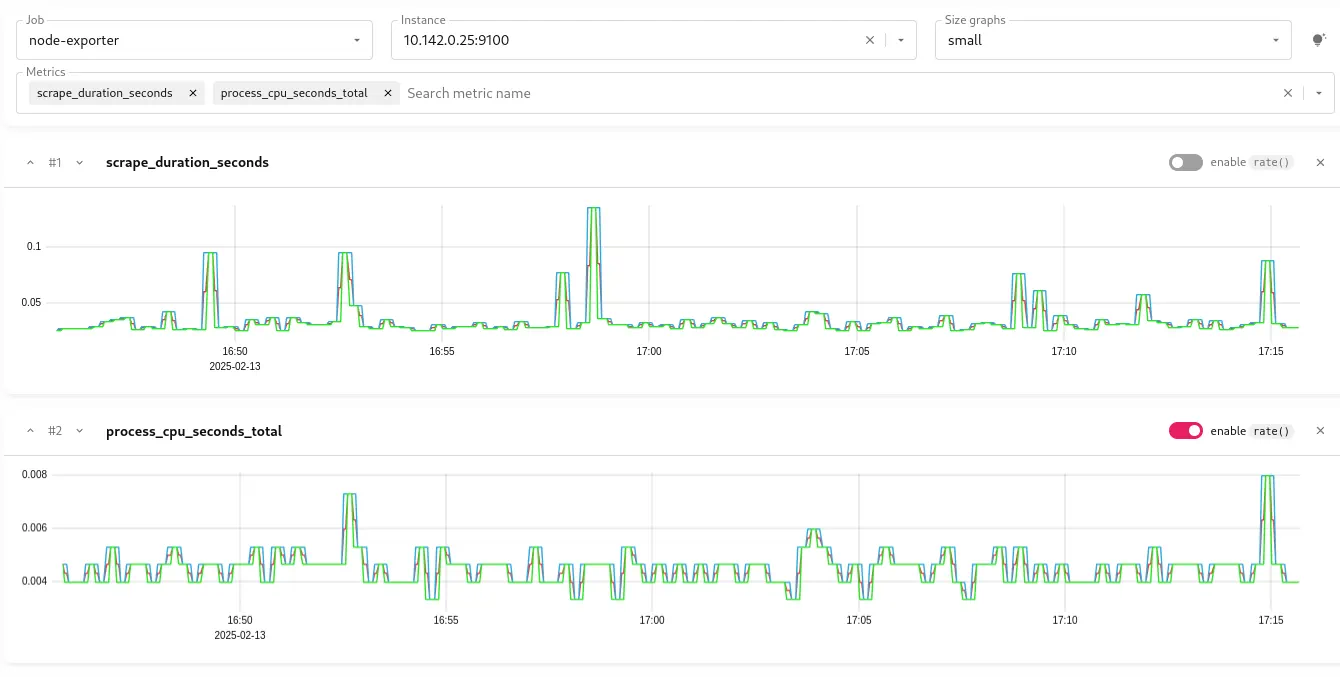
|
||||
<figcaption style="text-align: center; font-style: italic;">Query your data with VictoriaMetrics Cloud</figcaption>
|
||||
|
||||
{{% /collapse %}}
|
||||
|
||||
{{% collapse name="Explore valuable insights" %}}
|
||||
|
||||
* List your Prometheus metrics by Job and Instance
|
||||
* Inspect your time series data cardinality to optimize usage and costs
|
||||
* Discover top used or heaviest queries
|
||||
|
||||

|
||||
<figcaption style="text-align: center; font-style: italic;">Understand your data with VictoriaMetrics Cloud</figcaption>
|
||||
|
||||
{{% /collapse %}}
|
||||
|
||||
{{% collapse name="Analyze, debug and learn" %}}
|
||||
|
||||
* Trace and query analyzer to debug queries
|
||||
* WITH templating for MetricsQL: functions, variables and filters
|
||||
* Debug metrics relabling with easy-to-follow examples
|
||||
|
||||
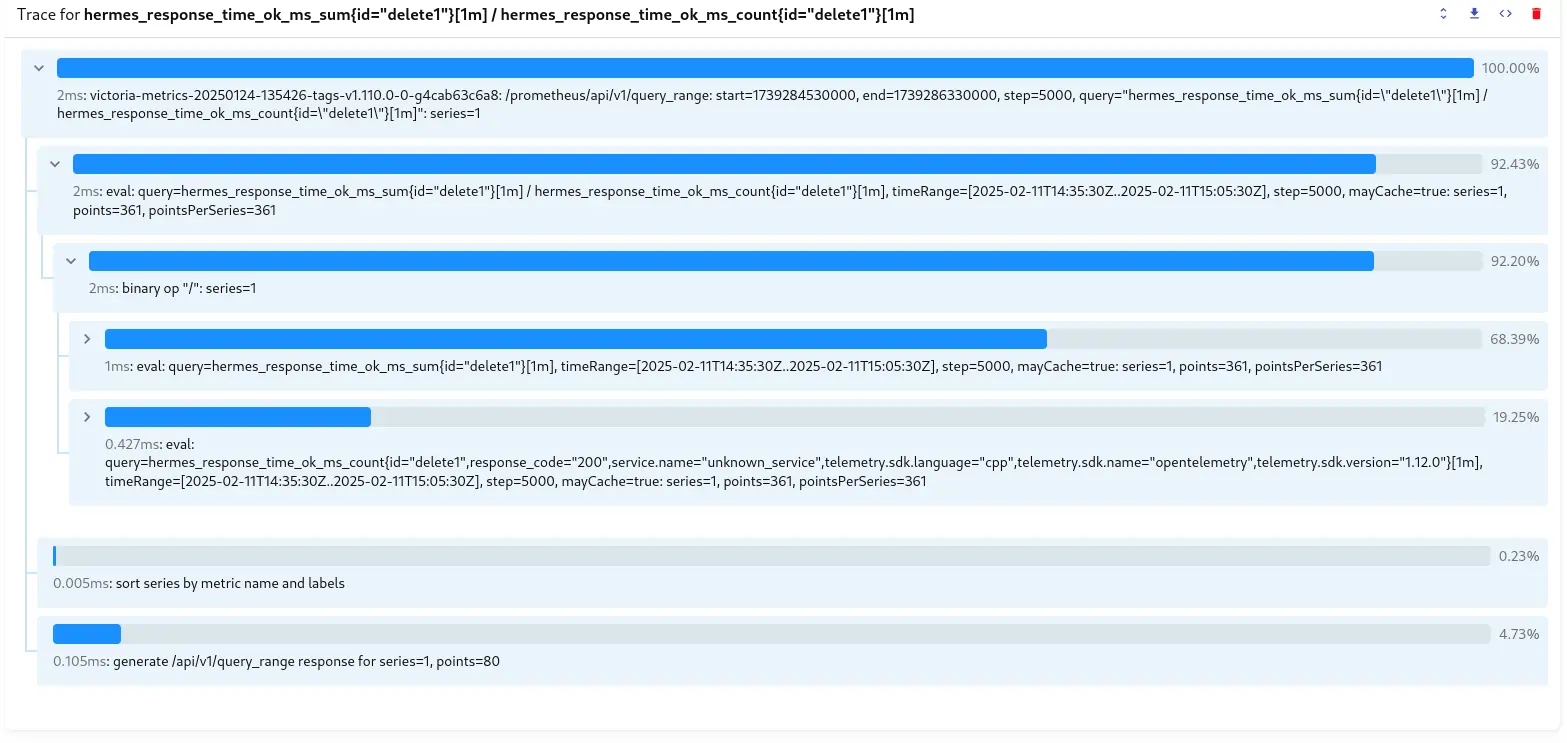
|
||||
<figcaption style="text-align: center; font-style: italic;">Debug your queries</figcaption>
|
||||
|
||||
{{% /collapse %}}
|
||||
|
||||
## Benefits
|
||||
In brief, we run VictoriaMetrics Cloud deployments in our AWS environment and provide direct endpoints
|
||||
for data ingestion and querying. The VictoriaMetrics team takes care of optimal configuration and software
|
||||
maintenance. You can think of it as having access to a **fully supported, enterprise** version of VictoriaMetrics
|
||||
that runs outside your environment, helping you to save resources and costs, without the hustle of performing
|
||||
typical DevOps tasks such as configuration management, monitoring, log collection, access protection, perform
|
||||
software and infrastructure upgrades, store backups regularly or control costs. **We take care of that**.
|
||||
|
||||
> VictoriaMetrics Cloud is able to handle larger workloads than competing solutions at a far lower cost.
|
||||
|
||||
{{% collapse name="Easy Migration" %}}
|
||||
|
||||
* Migrate from costly & less scalable monitoring solutions such as Managed Prometheus service from AWS, GCP or Azure, InfluxDB Cloud, or your on-premises setup.
|
||||
* Get higher data resolution with much higher cardinality.
|
||||
* Run more complex queries.
|
||||
|
||||
{{% /collapse %}}
|
||||
|
||||
{{% collapse name="Enterprise level support" %}}
|
||||
|
||||
Includes all VictoriaMetrics Enterprise Features Plus:
|
||||
|
||||
* Business days & hours support
|
||||
* 8 hours response time for system impaired issues
|
||||
|
||||
{{% /collapse %}}
|
||||
|
||||
{{% collapse name="Cost-efficient Scaling" %}}
|
||||
|
||||
* Only pay for the resources that you actually use (compute, disk and network).
|
||||
* Downsampling and retention filters features enable additional cost-savings.
|
||||
|
||||
{{% /collapse %}}
|
||||
|
||||
{{% collapse name="Ease of Budgeting" %}}
|
||||
|
||||
**No invoice surprises**: pick a tier at a fixed price. Our pricing model protects you from surprise overages coming from unexpected changes in workload such as spikes in data ingestion rate, cardinality explosions or accidental heavy queries.
|
||||
|
||||
{{% /collapse %}}
|
||||
|
||||
|
||||
{{% collapse name="Ease of use" %}}
|
||||
|
||||
The VictoriaMetrics team takes care of optimal configuration and handles all software maintenance, so you can focus on the monitoring.
|
||||
|
||||
{{% /collapse %}}
|
||||
|
||||
|
Before Width: | Height: | Size: 32 KiB |
|
Before Width: | Height: | Size: 48 KiB |
|
Before Width: | Height: | Size: 32 KiB |
|
Before Width: | Height: | Size: 52 KiB |
|
Before Width: | Height: | Size: 103 KiB |
@@ -1,25 +0,0 @@
|
||||
---
|
||||
weight: 4
|
||||
title: Guides and Best Practices
|
||||
menu:
|
||||
docs:
|
||||
parent: get-started
|
||||
weight: 4
|
||||
tags:
|
||||
- metrics
|
||||
- cloud
|
||||
- enterprise
|
||||
- guide
|
||||
aliases:
|
||||
- /victoriametrics-cloud/quickstart/best-practices.html
|
||||
- /managed-victoriametrics/quickstart/best-practices.html
|
||||
---
|
||||
|
||||
Here you can find some guides and best practices:
|
||||
|
||||
* [Understand Your Setup Size](https://docs.victoriametrics.com/guides/understand-your-setup-size/)
|
||||
* [Alerting & recording rules with Alertmanager configuration for VictoriaMetrics Cloud deployment](https://docs.victoriametrics.com/victoriametrics-cloud/alertmanager-setup-for-deployment/)
|
||||
* [Kubernetes Monitoring with VictoriaMetrics Cloud](https://docs.victoriametrics.com/victoriametrics-cloud/how-to-monitor-k8s/)
|
||||
* [Setup Notifications](https://docs.victoriametrics.com/victoriametrics-cloud/setup-notifications/)
|
||||
* [User Management](https://docs.victoriametrics.com/victoriametrics-cloud/user-management/)
|
||||
* [How to write and read data](https://docs.victoriametrics.com/victoriametrics-cloud/deployments/access-tokens/)
|
||||
@@ -1,18 +0,0 @@
|
||||
---
|
||||
weight: 1
|
||||
title: VictoriaMetrics Cloud Overview
|
||||
menu:
|
||||
docs:
|
||||
parent: get-started
|
||||
weight: 1
|
||||
name: Overview
|
||||
tags:
|
||||
- metrics
|
||||
- cloud
|
||||
- enterprise
|
||||
aliases:
|
||||
- /victoriametrics-cloud/overview/index.html
|
||||
- /managed-victoriametrics/overview/index.html
|
||||
- /victoriametrics-cloud/get-started/overview/index.html
|
||||
---
|
||||
{{% content "../README.md" %}}
|
||||
@@ -1,165 +0,0 @@
|
||||
---
|
||||
weight: 3
|
||||
title: Quick Start
|
||||
menu:
|
||||
docs:
|
||||
parent: "get-started"
|
||||
weight: 3
|
||||
tags:
|
||||
- metrics
|
||||
- cloud
|
||||
- enterprise
|
||||
- guide
|
||||
aliases:
|
||||
- /victoriametrics-cloud/get-started/index.html
|
||||
- /victoriametrics-cloud/quickstart/index.html
|
||||
- /managed-victoriametrics/quickstart/index.html
|
||||
|
||||
---
|
||||
Congratulations! You are just a few clicks away from running your favorite monitoring stack
|
||||
without needing to worry about its maintenance, proper configuration, access protection,
|
||||
software updates or backups. We take care of that so you can focus on what matters.
|
||||
|
||||
The process is very simple: once you are done with [registration](#registration), you'll be all set to
|
||||
[create a deployment](#creating-deployments) and [start writing and reading data](#start-writing-and-reading-data)
|
||||
right away.
|
||||
|
||||
Once the trial period ends, [adding a payment method](#adding-a-payment-method) will let you continue
|
||||
using VictoriaMetrics Cloud.
|
||||
|
||||
## Registration
|
||||
|
||||
Start your registration process by visiting the [Sign Up](https://console.victoriametrics.cloud/signUp?utm_source=website&utm_campaign=docs_quickstart) page.
|
||||
VictoriaMetrics Cloud supports registration via Sign up with Google Auth service or Email and password.
|
||||
|
||||
{{% collapse name="How to restore your password" %}}
|
||||
|
||||
> If you forgot your password, it can always be restored by clicking the `Forgot password?` link on the [Sign In](https://console.victoriametrics.cloud/signIn?utm_source=website&utm_campaign=docs_quickstart) page.
|
||||
If you need assistance or have any questions, don't hesitate to contact our support team at support-cloud@victoriametrics.com.
|
||||
|
||||
{{% /collapse %}}
|
||||
|
||||
## Creating deployments
|
||||
|
||||
Creating VictoriaMetrics Cloud deployments is straightforward. Simply navigate
|
||||
to the [Deployments](https://console.victoriametrics.cloud/deployments?utm_source=website&utm_campaign=docs_quickstart) page,
|
||||
click on `Create`, pick a [tier](https://docs.victoriametrics.com/victoriametrics-cloud/tiers-parameters/),
|
||||
and the instance will be up & running in a few seconds.
|
||||
|
||||
> To create your first deployment, click on `Start using VictoriaMetrics Cloud`.
|
||||
|
||||
### Customize your deployment
|
||||
|
||||
When creating a deployment, the following options are available:
|
||||
|
||||
| **Option** | **Description** |
|
||||
|------------------------------------|-----------------------------------|
|
||||
| <nobr>**`Deployment name`**</nobr> | A unique name for your deployment that will help you identify it. |
|
||||
| **`Single-node`** | For affordable, performant deployments. |
|
||||
| **`Cluster`** | For highly available and multi-tenant deployments at scale. |
|
||||
| **`Region`** | The cloud provider region where your deployment runs. For optimal performance and reduced traffic costs, select a region close to your application. |
|
||||
| **`Tier`** | VictoriaMetrics Cloud offers a predefined set of instance sizes (or [tiers](https://docs.victoriametrics.com/victoriametrics-cloud/tiers-parameters/)) that cover most use cases. In this way, we can keep fixed pricing without surprises. Read [this guide](https://docs.victoriametrics.com/guides/understand-your-setup-size.html) to understand your setup size. Keep in mind that deployments may be [modified](#modifying-an-existing-deployment)! |
|
||||
| **`Retention`** | The time, in months or days, you want to keep your metrics. Once set, VictoriaMetrics Cloud recommends storage size based on it. See this [note](#about-storage) for more information. |
|
||||
| **`Storage`** | Disk size for data storage. You always can expand disk size later. See this [note](#about-storage) for more information. |
|
||||
| **`Deduplication`** | Deduplication handles redundant data in high-availability (HA) setups to retain only one sample per interval. For best results, set deduplication to match the collect metrics interval. If you have multiple intervals, set it to the shortest one. |
|
||||
| <nobr>**`Maintenance Window`**</nobr> | We use this value as the preferred window for us to perform maintenance operations, such as upgrades, when needed. |
|
||||
|
||||

|
||||
<figcaption style="text-align: center; font-style: italic;">Selecting a tier</figcaption>
|
||||
|
||||
After selecting your desired configuration, you are set to `Create` your deployment. Once created, it will remain for a few seconds in `Provisioning` status while spinning-up.
|
||||
You'll also be notified via email once your deployment is ready to use.
|
||||
|
||||
{{% collapse name="Expand to learn more about retention and storage considerations" %}}
|
||||
|
||||
### About storage
|
||||
* **Data point sizes** are approximated to 0.8 bytes, based on our own experience managing VictoriaMetrics Cloud. This magnitude is increases with **cardinality**. For high cardinality data, more storage is expected.
|
||||
* **Long time retention**: for 6 months or more retention times, we recommend to start with a smaller storage size and increase it over time.
|
||||
* **Storage size can be increased**, however, you cannot reduce it due to AWS limitations.
|
||||
* **Enterprise features** like [downsampling](https://docs.victoriametrics.com/victoriametrics/single-server-victoriametrics/#downsampling) and [retention filters](https://docs.victoriametrics.com/victoriametrics/single-server-victoriametrics/#retention-filters) may dramatically help to optimize disk space.
|
||||
* The **formula** we use for calculating the recommended storage can be found [here](https://docs.victoriametrics.com/guides/understand-your-setup-size/#retention-perioddisk-space).
|
||||
|
||||
> Feel free to adjust your deployment based on these recommendations.
|
||||
|
||||
{{% /collapse %}}
|
||||
|
||||
## Start writing and reading data
|
||||
|
||||
After the transition from `Provisioning` to `Running` state, the VictoriaMetrics Cloud deployment
|
||||
is fully operational and ready to accept write and read requests. Writing and reading data in VictoriaMetrics Cloud is very simple.
|
||||
Many integrations are supported. Comprehensive examples and guides may be found in the [integrations](https://cloud.victoriametrics.com/integrations?utm_source=website&utm_campaign=docs_quickstart) section.
|
||||
|
||||
> To read or write data into VictoriaMetrics Cloud, you just need to point your application to your deployment's `Access endpoint` and authorize with an `Access token`.
|
||||
|
||||
In brief, you will **only need to perform 2 steps**:
|
||||
1. Obtain the [**`Access endpoint`**](https://docs.victoriametrics.com/victoriametrics-cloud/deployments/access-tokens/#access-endpoint) for your deployment, which can be found in the [Deployments](https://console.victoriametrics.cloud/deployments?utm_source=website&utm_campaign=docs_quickstart) overview. Typically, it looks like: `https://<xxxx>.cloud.victoriametrics.com`.
|
||||
2. Create or reuse an [**`Access token`**](https://docs.victoriametrics.com/victoriametrics-cloud/deployments/access-tokens/) to allow any application to read or write data into VictoriaMetrics Cloud. Just pick a `Name`, select read and/or write `Permission` and `Generate` it. For every deployment, you can `Generate tokens` in the `Access tokens` tab.
|
||||
|
||||
{{% collapse name="Expand to discover examples for vmagent, Prometheus, Grafana or any other software" %}}
|
||||
|
||||
### Examples for Reading and Writing data into VictoriaMetrics Cloud
|
||||
|
||||
Apart from the mentioned [integrations](https://cloud.victoriametrics.com/integrations?utm_source=website&utm_campaign=docs_quickstart) section,
|
||||
you can always check for quick and easy Copy-paste examples by clicking on the three dots of the desired [Access Token](https://docs.victoriametrics.com/victoriametrics-cloud/deployments/access-tokens/) and select `Show examples`.
|
||||
|
||||
It will provide snippets like:
|
||||
|
||||
#### vmagent
|
||||
|
||||
```sh
|
||||
./vmagent \
|
||||
--remoteWrite.url=https://<your_access_point>.cloud.victoriametrics.com/api/v1/write \
|
||||
--remoteWrite.bearerToken=********
|
||||
```
|
||||
|
||||
#### Prometheus Configuration
|
||||
|
||||
```yaml
|
||||
remote_write:
|
||||
- url: https://<your_access_point>.cloud-test.victoriametrics.com/api/v1/write
|
||||
authorization:
|
||||
credentials: ********
|
||||
```
|
||||
|
||||
#### Grafana
|
||||
|
||||
* `Datasource url`: https://<your_access_point>.cloud.victoriametrics.com
|
||||
* `Custom HTTP Header`: Authorization
|
||||
* `Header value`: **********
|
||||
|
||||
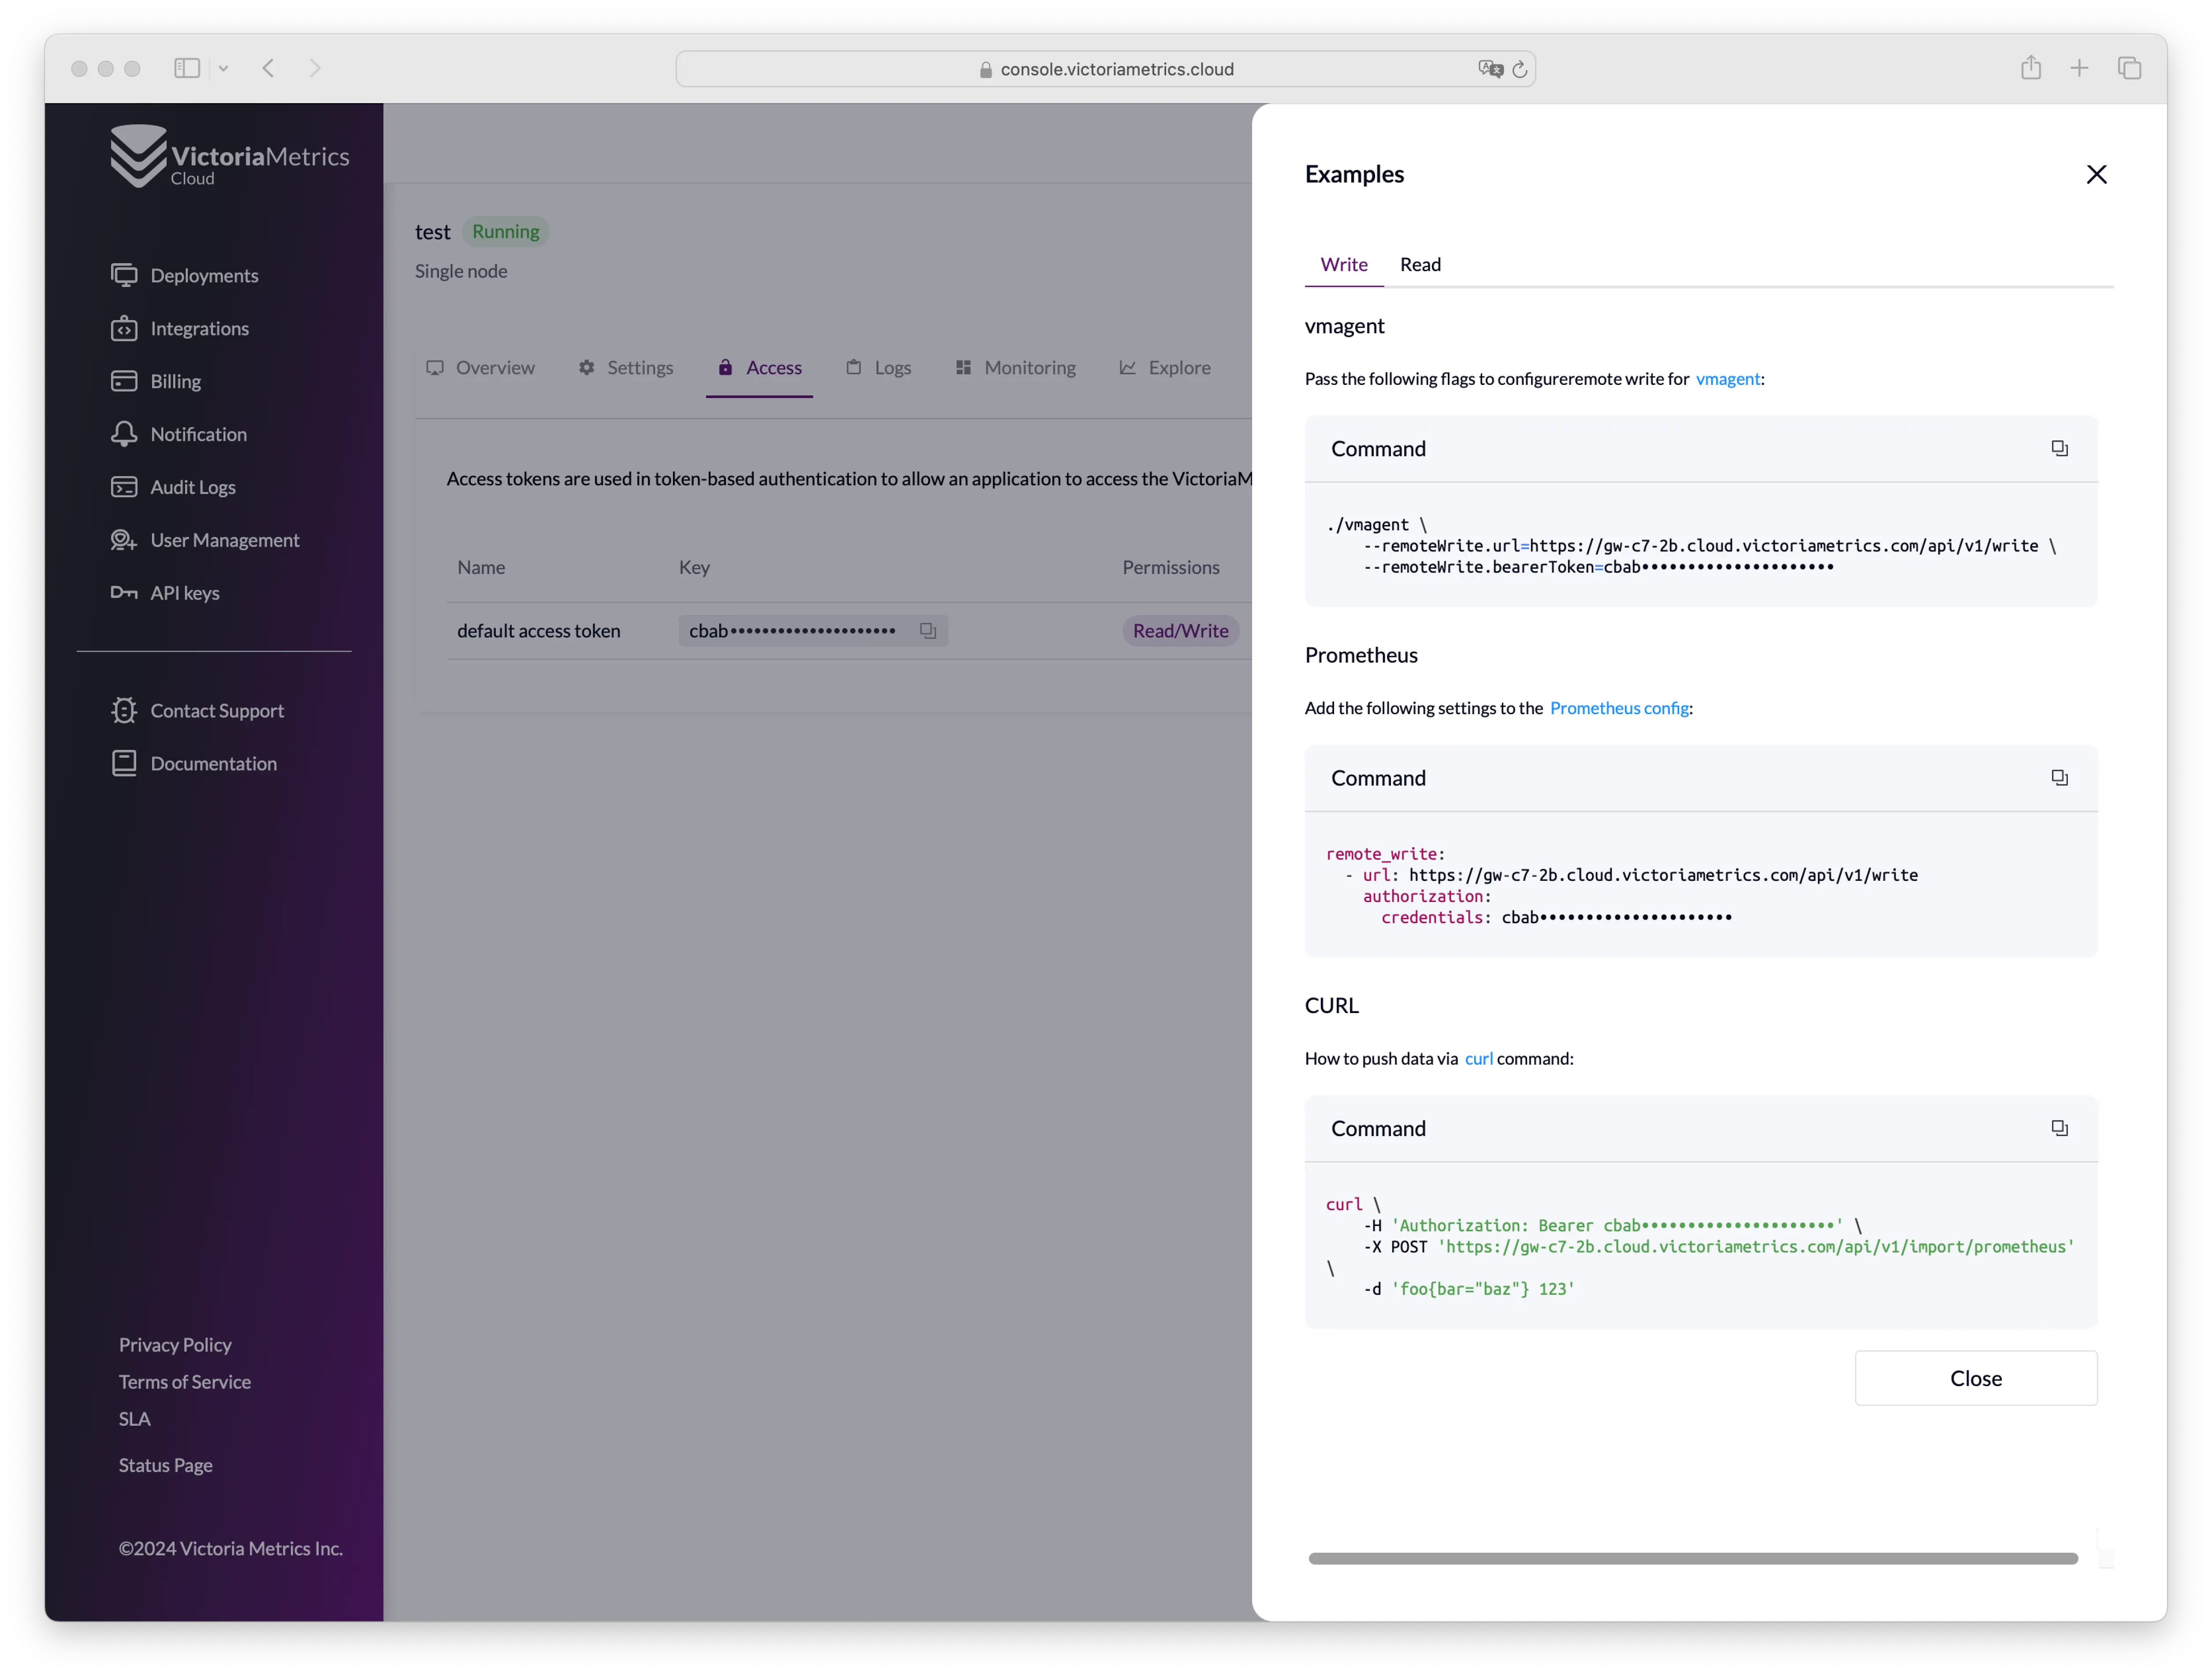
|
||||
<figcaption style="text-align: center; font-style: italic;">Write configuration examples</figcaption>
|
||||
|
||||
|
||||
{{% /collapse %}}
|
||||
|
||||
|
||||
## Modifying an existing deployment
|
||||
|
||||
Remember that you can always add, remove or modify existing deployments by changing their configuration on the
|
||||
deployment's page. It is important to know that downgrade for clusters is currently not available.
|
||||
|
||||
Additional configuration options may be found under `Advanced Settings` where the following additional parameters can be set:
|
||||
|
||||
* [`Deduplication`](https://docs.victoriametrics.com/victoriametrics/cluster-victoriametrics/#deduplication) defines interval when deployment leaves a single raw sample with the biggest timestamp per each discrete interval;
|
||||
* `Maintenance Window` when deployment should start an upgrade process if needed;
|
||||
* `Settings` to define VictoriaMetrics deployment flags, depending on your deployment type: [Cluster](https://docs.victoriametrics.com/victoriametrics/cluster-victoriametrics/#list-of-command-line-flags) or [Single-node](https://docs.victoriametrics.com/victoriametrics/single-server-victoriametrics/#list-of-command-line-flags).
|
||||
|
||||
> These updates require a deployment restart and may result in a short downtime for **single-node** deployments.
|
||||
|
||||
|
||||
## Adding a payment method
|
||||
|
||||
VictoriaMetrics Cloud supports different payment options. You can found more information under the [Billing](https://docs.victoriametrics.com/victoriametrics-cloud/billing/) section.
|
||||
|
||||
To add your payment method, navigate to the VictoriaMetrics Cloud [Billing](https://console.victoriametrics.cloud/billing?utm_source=website&utm_campaign=docs_quickstart)
|
||||
page, and go to the `Payment methods` tab. There, you'll be able to add a payment method by:
|
||||
|
||||
1. **Bank card**: fill required fields
|
||||
2. **AWS Marketplace**: link your AWS billing account via AWS Marketplace. This option will redirect you to the [AWS VictoriaMetrics Cloud product page](https://aws.amazon.com/marketplace/pp/prodview-atfvt3b73m2z4), where you can easily `Subscribe` to VictoriaMetrics Cloud. You'll be redirected back to VictoriaMetrics Cloud [Billing page](https://console.victoriametrics.cloud/billing?utm_source=website&utm_campaign=docs_quickstart) by clicking on `Set up your account`.
|
||||
|
||||
If you add both payment methods, you can easily switch between them by selecting your preferred option.
|
||||
|
||||
> [!NOTE] What happens if a payment method is not configured?
|
||||
> After the trial period expires, deployments will be stopped and deleted if no payment methods are found for your account.
|
||||
> If you need assistance or have any questions, don't hesitate to contact our support team at support-cloud@victoriametrics.com.
|
||||
@@ -1,143 +0,0 @@
|
||||
---
|
||||
weight: 14
|
||||
title: Kubernetes Monitoring with VictoriaMetrics Cloud
|
||||
menu:
|
||||
docs:
|
||||
parent: "cloud"
|
||||
weight: 14
|
||||
tags:
|
||||
- metrics
|
||||
- cloud
|
||||
- enterprise
|
||||
- guide
|
||||
aliases:
|
||||
- /victoriametrics-cloud/how-to-monitor-k8s/index.html
|
||||
- /managed-victoriametrics/how-to-monitor-k8s/index.html
|
||||
---
|
||||
Monitoring kubernetes cluster is necessary to build SLO/SLI, to analyze performance and cost-efficiency of your workloads.
|
||||
|
||||
To enable kubernetes cluster monitoring, we will be collecting metrics about cluster performance and utilization from kubernetes components like `kube-api-server`, `kube-controller-manager`, `kube-scheduler`, `kube-state-metrics`, `etcd`, `core-dns`, `kubelet` and `kube-proxy`. We will also install some recording rules, alert rules and dashboards to provide visibility of cluster performance, as well as alerting for cluster metrics.
|
||||
For node resource utilization we will be collecting metrics from `node-exporter`. We will also install dashboard and alerts for node related metrics
|
||||
|
||||
For workloads monitoring in kubernetes cluster we will have [VictoriaMetrics Operator](https://docs.victoriametrics.com/operator/). It enables us to define scrape jobs using kubernetes CRDs [VMServiceScrape](https://docs.victoriametrics.com/operator/design.html#vmservicescrape), [VMPodScrape](https://docs.victoriametrics.com/operator/design.html#vmpodscrape). To add alerts or recording rules for workloads we can use [VMRule](https://docs.victoriametrics.com/operator/design.html#vmrule) CRD
|
||||
|
||||
## Overview
|
||||
|
||||
In this guide we will be using [victoria-metrics-k8s-stack](https://github.com/VictoriaMetrics/helm-charts/tree/master/charts/victoria-metrics-k8s-stack) helm chart
|
||||
|
||||
This chart will install `VMOperator`, `VMAgent`, `NodeExporter`, `kube-state-metrics`, `grafana` and some service scrape configurations to start monitoring kubernetes cluster components
|
||||
|
||||
## Prerequisites
|
||||
|
||||
|
||||
- Active VictoriaMetrics Cloud instance. You can learn how to sign up for VictoriaMetrics Cloud [here](https://docs.victoriametrics.com/victoriametrics-cloud/quickstart#how-to-register).
|
||||
- Access to your kubernetes cluster
|
||||
- Helm binary. You can find installation [here](https://helm.sh/docs/intro/install/)
|
||||
|
||||
## Installation steps
|
||||
Install the Helm chart in a custom namespace
|
||||
|
||||
1. Create a unique Kubernetes namespace, for example `monitoring`
|
||||
|
||||
```shell
|
||||
kubectl create namespace monitoring
|
||||
```
|
||||
|
||||
1. Create kubernetes-secrets with token to access your dbaas deployment
|
||||
|
||||
```shell
|
||||
kubectl --namespace monitoring create secret generic dbaas-write-access-token --from-literal=bearerToken=your-token
|
||||
kubectl --namespace monitoring create secret generic dbaas-read-access-token --from-literal=bearerToken=your-token
|
||||
```
|
||||
|
||||
You can find your access token on the "Access" tab of your deployment
|
||||

|
||||
1. Set up a Helm repository using the following commands:
|
||||
|
||||
```shell
|
||||
helm repo add grafana https://grafana.github.io/helm-charts
|
||||
helm repo add prometheus-community https://prometheus-community.github.io/helm-charts
|
||||
helm repo add vm https://victoriametrics.github.io/helm-charts
|
||||
helm repo update
|
||||
```
|
||||
|
||||
1. Create a YAML file of Helm values called dbaas.yaml with following content
|
||||
|
||||
```yaml
|
||||
external:
|
||||
vm:
|
||||
read:
|
||||
url: <reading url, you can find it in examples on Access page>
|
||||
bearerTokenSecret:
|
||||
name: dbaas-write-access-token
|
||||
key: bearerToken
|
||||
write:
|
||||
url: <reading url, you can find it in examples on Access page>
|
||||
bearerTokenSecret:
|
||||
name: dbaas-read-access-token
|
||||
key: bearerToken
|
||||
|
||||
vmsingle:
|
||||
enabled: false
|
||||
|
||||
vmcluster:
|
||||
enabled: false
|
||||
|
||||
vmalert:
|
||||
enabled: true
|
||||
spec:
|
||||
evaluationInterval: 15s
|
||||
|
||||
vmagent:
|
||||
enabled: true
|
||||
|
||||
spec:
|
||||
scrapeInterval: 30s
|
||||
externalLabels:
|
||||
cluster: <your cluster name>
|
||||
|
||||
# dependencies
|
||||
# Grafana dependency chart configuration. For possible values refer to https://github.com/grafana/helm-charts/tree/main/charts/grafana#configuration
|
||||
grafana:
|
||||
enabled: true
|
||||
```
|
||||
|
||||
1. Install VictoriaMetrics-k8s-stack helm chart
|
||||
|
||||
```shell
|
||||
helm --namespace monitoring install vm vm/victoria-metrics-k8s-stack -f dbaas.yaml -n monitoring
|
||||
```
|
||||
|
||||
|
||||
## Connect grafana
|
||||
|
||||
Connect to grafana and create your datasource
|
||||
|
||||
> If you are using external grafana, you can skip steps 1-3 and you will need to import dashboards that can be found here manually
|
||||
|
||||
1. Get grafana password
|
||||
|
||||
```shell
|
||||
kubectl --namespace monitoring get secret vm-grafana -o jsonpath="{.data.admin-password}" | base64 -d
|
||||
```
|
||||
|
||||
1. Connect to grafana
|
||||
|
||||
```shell
|
||||
kubectl --namespace monitoring port-forward service/vm-grafana 3000:80
|
||||
```
|
||||
|
||||
1. Open grafana in your browser `http://localhost:3000/datasources`
|
||||
|
||||
Use admin as username and password from previous step
|
||||
1. Click on add datasource
|
||||
Choose VictoriaMetrics or Prometheus as datasource type. Make sure you made this datasource as default for dashboards to work.
|
||||
> You can find token and URL in your deployment, on Access tab
|
||||
|
||||

|
||||
|
||||
## Test it
|
||||
|
||||
|
||||
- You should be able to see data that was sent to your dbaas using VMAgent dashboard `http://localhost:3000/d/G7Z9GzMGz/victoriametrics-vmagent/`
|
||||
- You also will be able to see bunch of kubernetes dashboards in your grafana
|
||||
|
Before Width: | Height: | Size: 33 KiB |
@@ -1,41 +0,0 @@
|
||||
This section contains a collection of quick start guides for integrating various software and tools
|
||||
with VictoriaMetrics Cloud. The guides are organized by integration type to help you quickly find
|
||||
what you need.
|
||||
|
||||
In the [VictoriaMetrics Cloud Console](https://console.victoriametrics.cloud/integrations), you can
|
||||
explore interactive integration guides tailored to your actual deployments. These guides provide
|
||||
personalized assistance, including pre-filled configuration snippets, relevant URLs, and secure
|
||||
access tokens.
|
||||
|
||||
> [!NOTE] Tip
|
||||
> Generally, all integrations in VictoriaMetrics Cloud just require a URL and an
|
||||
> [Access Token](https://docs.victoriametrics.com/victoriametrics-cloud/deployments/access-tokens/) to work.
|
||||
|
||||
In this section, the same principle is applied so, in each integration, interactive guides and
|
||||
examples are provided for example deployments. Don't forget that you can always find interactive
|
||||
integration guides in [VictoriaMetrics Cloud Console](https://cloud.victoriametrics.com/integrations/),
|
||||
which generate steps and configurations specifically for your real cloud deployments.
|
||||
|
||||
If there's an integration you'd like to see here but it's currently missing, feel free to [contact us](mailto:support-cloud@victoriametrics.com).
|
||||
|
||||
## Ingestion
|
||||
|
||||
- [CloudWatch - Agentless AWS monitoring](https://docs.victoriametrics.com/victoriametrics-cloud/integrations/cloudwatch/)
|
||||
- [CURL](https://docs.victoriametrics.com/victoriametrics-cloud/integrations/curl/)
|
||||
- [Kubernetes](https://docs.victoriametrics.com/victoriametrics-cloud/integrations/kubernetes/)
|
||||
- [OpenTelemetry](https://docs.victoriametrics.com/victoriametrics-cloud/integrations/opentelemetry/)
|
||||
- [Prometheus (remote write)](https://docs.victoriametrics.com/victoriametrics-cloud/integrations/prometheus/)
|
||||
- [Telegraf](https://docs.victoriametrics.com/victoriametrics-cloud/integrations/telegraf/)
|
||||
- [Vector](https://docs.victoriametrics.com/victoriametrics-cloud/integrations/vector/)
|
||||
- [VMAgent](https://docs.victoriametrics.com/victoriametrics-cloud/integrations/vmagent/)
|
||||
|
||||
## Data Visualization
|
||||
|
||||
- [CURL](https://docs.victoriametrics.com/victoriametrics-cloud/integrations/curl/)
|
||||
- [Grafana](https://docs.victoriametrics.com/victoriametrics-cloud/integrations/grafana/)
|
||||
- [Perses](https://docs.victoriametrics.com/victoriametrics-cloud/integrations/perses/)
|
||||
|
||||
## Notifications
|
||||
|
||||
- [Cloud Alertmanager](https://docs.victoriametrics.com/victoriametrics-cloud/integrations/cloud-alertmanager/)
|
||||
- [Custom Alertmanager](https://docs.victoriametrics.com/victoriametrics-cloud/integrations/custom-alertmanager/)
|
||||
@@ -1,14 +0,0 @@
|
||||
---
|
||||
title: "Integrations"
|
||||
weight: 0
|
||||
menu:
|
||||
docs:
|
||||
weight: 5
|
||||
parent: cloud
|
||||
identifier: integrations
|
||||
pageRef: /victoriametrics-cloud/integrations/
|
||||
aliases:
|
||||
- /victoriametrics-cloud/integrations.html
|
||||
- /managed-victoriametrics/integrations.html
|
||||
---
|
||||
{{% content "README.md" %}}
|
||||
@@ -1,28 +0,0 @@
|
||||
---
|
||||
title : "Cloud Alertmanager"
|
||||
menu:
|
||||
docs:
|
||||
parent: "integrations"
|
||||
---
|
||||
|
||||
VictoriaMetrics Cloud allows you to define and manage alerting rules using
|
||||
[vmalert](https://docs.victoriametrics.com/vmalert/), and send notifications through a fully managed
|
||||
Alertmanager instance, built into the platform.
|
||||
|
||||
This integration provides a seamless way to trigger alerts based on Prometheus-compatible queries and
|
||||
route them to your preferred notification channels, such as email, PagerDuty, Slack, MS Teams or webhooks.
|
||||
|
||||
## Integrating with Cloud AlertManager
|
||||
|
||||
To configure alerting rules and notifications using the hosted Alertmanager, simply follow this guide:
|
||||
|
||||
|
||||
<iframe
|
||||
width="100%"
|
||||
height="950"
|
||||
name="iframe"
|
||||
id="integration"
|
||||
frameborder="0"
|
||||
src="https://console.victoriametrics.cloud/public/integrations/cloud-alertmanager"
|
||||
style="background: white;" >
|
||||
</iframe>
|
||||
@@ -1,38 +0,0 @@
|
||||
---
|
||||
title : "CloudWatch - Agentless AWS monitoring"
|
||||
menu:
|
||||
docs:
|
||||
parent: "integrations"
|
||||
---
|
||||
|
||||
VictoriaMetrics Cloud supports **agentless AWS monitoring** by integrating directly with
|
||||
[Amazon CloudWatch](https://docs.aws.amazon.com/AmazonCloudWatch/latest/monitoring/WhatIsCloudWatch.html)
|
||||
via [Amazon Kinesis Data Firehose](https://docs.aws.amazon.com/firehose/latest/dev/what-is-this-service.html).
|
||||
This allows you to forward metrics from AWS services (like EC2, RDS, Lambda, etc.) to VictoriaMetrics
|
||||
Cloud without deploying any collectors or agents.
|
||||
|
||||
This integration provides a simple, scalable, and maintenance-free way to monitor your AWS infrastructure.
|
||||
|
||||
## Integrating CloudWatch via AWS Firehose
|
||||
|
||||
All VictoriaMetrics Cloud integrations, including this one, require an access token for authentication.
|
||||
The configuration examples below contain two placeholders: `<DEPLOYMENT_ENDPOINT_URL>` and
|
||||
`<YOUR_ACCESS_TOKEN>`. These need to be replaced with your actual access token.
|
||||
|
||||
To generate your access token (with **write access**, as metrics are pushed from AWS), follow the
|
||||
steps in the [Access Tokens documentation](https://docs.victoriametrics.com/victoriametrics-cloud/deployments/access-tokens).
|
||||
|
||||
To set up agentless AWS monitoring using Firehose, visit the
|
||||
[cloud console](https://console.victoriametrics.cloud/integrations/cloudwatch),
|
||||
or follow this interactive guide:
|
||||
|
||||
|
||||
<iframe
|
||||
width="100%"
|
||||
height="7000"
|
||||
name="iframe"
|
||||
id="integration"
|
||||
frameborder="0"
|
||||
src="https://console.victoriametrics.cloud/public/integrations/cloudwatch"
|
||||
style="background: white;" >
|
||||
</iframe>
|
||||
@@ -1,33 +0,0 @@
|
||||
---
|
||||
title : "CURL"
|
||||
menu:
|
||||
docs:
|
||||
parent: "integrations"
|
||||
---
|
||||
|
||||
You can use [curl](https://curl.se/) to interact with VictoriaMetrics Cloud for both **pushing** metrics and **querying**
|
||||
stored data using HTTP API endpoints. This makes it a simple and flexible option for testing or basic
|
||||
integrations.
|
||||
|
||||
## Integrating with CURL
|
||||
|
||||
All VictoriaMetrics Cloud integrations, including this one, require an access token for authentication.
|
||||
The configuration examples below contain two placeholders: `<DEPLOYMENT_ENDPOINT_URL>` and
|
||||
`<YOUR_ACCESS_TOKEN>`. These need to be replaced with your actual access token.
|
||||
|
||||
To generate your access token (with **write access** for pushing data or **read access** for querying),
|
||||
follow the steps in the [Access Tokens documentation](https://docs.victoriametrics.com/victoriametrics-cloud/deployments/access-tokens).
|
||||
|
||||
To integrate CURL with VictoriaMetrics Cloud, visit the [cloud console](https://console.victoriametrics.cloud/integrations/curl),
|
||||
or simply follow this interactive guide:
|
||||
|
||||
|
||||
<iframe
|
||||
width="100%"
|
||||
height="1350"
|
||||
name="iframe"
|
||||
id="integration"
|
||||
frameborder="0"
|
||||
src="https://console.victoriametrics.cloud/public/integrations/curl"
|
||||
style="background: white;" >
|
||||
</iframe>
|
||||
@@ -1,28 +0,0 @@
|
||||
---
|
||||
title : "Custom Alertmanager"
|
||||
menu:
|
||||
docs:
|
||||
parent: "integrations"
|
||||
---
|
||||
|
||||
VictoriaMetrics Cloud allows you to define and manage alerting rules using
|
||||
[vmalert](https://docs.victoriametrics.com/vmalert/), and send notifications to an
|
||||
**external Alertmanager instance** that you host and control in your own environment.
|
||||
|
||||
This integration provides full flexibility for organizations that already operate their own
|
||||
Alertmanager setup and want to connect it to VictoriaMetrics Cloud’s alerting engine.
|
||||
|
||||
## Integrating with Custom Alertmanager
|
||||
|
||||
To configure alerting rules and route notifications to your self-hosted Alertmanager, simply follow
|
||||
this guide:
|
||||
|
||||
<iframe
|
||||
width="100%"
|
||||
height="900"
|
||||
name="iframe"
|
||||
id="integration"
|
||||
frameborder="0"
|
||||
src="https://console.victoriametrics.cloud/public/integrations/custom-alertmanager"
|
||||
style="background: white;" >
|
||||
</iframe>
|
||||
@@ -1,34 +0,0 @@
|
||||
---
|
||||
title : "Grafana"
|
||||
menu:
|
||||
docs:
|
||||
parent: "integrations"
|
||||
---
|
||||
|
||||
[Grafana](https://grafana.com/) is a popular open-source visualization and dashboarding tool. You can
|
||||
use Grafana to query and visualize metrics stored in VictoriaMetrics Cloud using the built-in **Prometheus data source**.
|
||||
|
||||
This integration allows you to build powerful, customizable dashboards and monitor your systems in
|
||||
real time using VictoriaMetrics as the backend.
|
||||
|
||||
## Integrating with Grafana
|
||||
|
||||
All VictoriaMetrics Cloud integrations, including this one, require an access token for authentication.
|
||||
The configuration examples below contain two placeholders: `<DEPLOYMENT_ENDPOINT_URL>` and
|
||||
`<YOUR_ACCESS_TOKEN>`. These need to be replaced with your actual access token.
|
||||
|
||||
To generate your access token (with **read access**, for querying metrics), follow the steps in the
|
||||
[Access Tokens documentation](https://docs.victoriametrics.com/victoriametrics-cloud/deployments/access-tokens).
|
||||
|
||||
To connect Grafana with VictoriaMetrics Cloud, visit the [cloud console](https://console.victoriametrics.cloud/integrations/grafana),
|
||||
or follow this interactive guide:
|
||||
|
||||
<iframe
|
||||
width="100%"
|
||||
height="3400"
|
||||
name="iframe"
|
||||
id="integration"
|
||||
frameborder="0"
|
||||
src="https://console.victoriametrics.cloud/public/integrations/grafana"
|
||||
style="background: white;" >
|
||||
</iframe>
|
||||
@@ -1,32 +0,0 @@
|
||||
---
|
||||
title : "Kubernetes"
|
||||
menu:
|
||||
docs:
|
||||
parent: "integrations"
|
||||
---
|
||||
|
||||
VictoriaMetrics Cloud supports monitoring Kubernetes clusters using the
|
||||
[VictoriaMetrics Kubernetes Stack](https://docs.victoriametrics.com/helm/victoriametrics-k8s-stack/), a Helm-based
|
||||
deployment that includes preconfigured components for efficient and scalable metrics collection in Kubernetes environments.
|
||||
|
||||
This stack collects metrics from the cluster, nodes, and workloads, and forwards them to VictoriaMetrics Cloud using
|
||||
`vmagent`, along with built-in dashboards and alerting capabilities.
|
||||
|
||||
## Integrating with Kubernetes
|
||||
|
||||
All VictoriaMetrics Cloud integrations, including this one, require an access token for authentication. The configuration examples below contain two placeholders: `<DEPLOYMENT_ENDPOINT_URL>` and `<YOUR_ACCESS_TOKEN>`. These need to be replaced with your actual access token.
|
||||
|
||||
To generate your access token (with **write access**, as metrics will be pushed), follow the steps in the [Access Tokens documentation](https://docs.victoriametrics.com/victoriametrics-cloud/deployments/access-tokens).
|
||||
|
||||
To set up Kubernetes monitoring using the VictoriaMetrics stack, visit the [cloud console](https://console.victoriametrics.cloud/integrations/kubernetes), or follow this interactive guide:
|
||||
|
||||
|
||||
<iframe
|
||||
width="100%"
|
||||
height="2100"
|
||||
name="iframe"
|
||||
id="integration"
|
||||
frameborder="0"
|
||||
src="https://console.victoriametrics.cloud/public/integrations/kubernetes"
|
||||
style="background: white;" >
|
||||
</iframe>
|
||||
@@ -1,35 +0,0 @@
|
||||
---
|
||||
title : "OpenTelemetry"
|
||||
menu:
|
||||
docs:
|
||||
parent: "integrations"
|
||||
---
|
||||
|
||||
VictoriaMetrics Cloud supports integration with the [OpenTelemetry Collector](https://opentelemetry.io/docs/collector/)
|
||||
for ingesting metrics using the OpenTelemetry Protocol (OTLP).
|
||||
|
||||
You can deploy the OpenTelemetry Collector using either the **Helm chart** or the **Operator**,
|
||||
depending on your preference and environment, to collect, process, and
|
||||
forward observability data from a wide variety of sources into VictoriaMetrics Cloud.
|
||||
|
||||
## Integrating with OpenTelemetry
|
||||
|
||||
All VictoriaMetrics Cloud integrations, including this one, require an access token for
|
||||
authentication. The configuration examples below contain two placeholders: `<DEPLOYMENT_ENDPOINT_URL>`
|
||||
and `<YOUR_ACCESS_TOKEN>`. These need to be replaced with your actual access token.
|
||||
|
||||
To generate your access token (with **write access**, as metrics are pushed to VictoriaMetrics Cloud),
|
||||
follow the steps in the [Access Tokens documentation](https://docs.victoriametrics.com/victoriametrics-cloud/deployments/access-tokens).
|
||||
|
||||
To integrate OpenTelemetry Collector with VictoriaMetrics Cloud, visit the
|
||||
[cloud console](https://console.victoriametrics.cloud/integrations/opentelemetry), or follow this interactive guide:
|
||||
|
||||
<iframe
|
||||
width="100%"
|
||||
height="1800"
|
||||
name="iframe"
|
||||
id="integration"
|
||||
frameborder="0"
|
||||
src="https://console.victoriametrics.cloud/public/integrations/opentelemetry"
|
||||
style="background: white;" >
|
||||
</iframe>
|
||||
@@ -1,33 +0,0 @@
|
||||
---
|
||||
title : "Perses"
|
||||
menu:
|
||||
docs:
|
||||
parent: "integrations"
|
||||
---
|
||||
[Perses](https://perses.dev/) is an open-source visualization and dashboarding tool, designed for
|
||||
simplicity, performance, and scalability.
|
||||
|
||||
VictoriaMetrics Cloud can be used as a data source in Perses via the **Prometheus-compatible query API**,
|
||||
allowing you to create dashboards and monitor time series data with a modern and lightweight interface.
|
||||
|
||||
## Integrating with Perses
|
||||
|
||||
All VictoriaMetrics Cloud integrations, including this one, require an access token for authentication.
|
||||
The configuration examples below contain two placeholders: `<DEPLOYMENT_ENDPOINT_URL>` and `<YOUR_ACCESS_TOKEN>`.
|
||||
These need to be replaced with your actual access token.
|
||||
|
||||
To generate your access token (with **read access**, for querying metrics), follow the steps in the
|
||||
[Access Tokens documentation](https://docs.victoriametrics.com/victoriametrics-cloud/deployments/access-tokens).
|
||||
|
||||
To connect Perses with VictoriaMetrics Cloud, visit the [cloud console](https://console.victoriametrics.cloud/integrations/perses),
|
||||
or follow this interactive guide:
|
||||
|
||||
<iframe
|
||||
width="100%"
|
||||
height="3400"
|
||||
name="iframe"
|
||||
id="integration"
|
||||
frameborder="0"
|
||||
src="https://console.victoriametrics.cloud/public/integrations/perses"
|
||||
style="background: white;" >
|
||||
</iframe>
|
||||
@@ -1,35 +0,0 @@
|
||||
---
|
||||
title : "Prometheus (remote write)"
|
||||
menu:
|
||||
docs:
|
||||
parent: "integrations"
|
||||
---
|
||||
|
||||
VictoriaMetrics Cloud supports integration with [Prometheus](https://prometheus.io/) using the
|
||||
**remote write** protocol, allowing you to forward metrics collected by Prometheus to VictoriaMetrics
|
||||
Cloud for long-term storage and advanced querying.
|
||||
|
||||
This setup enables you to keep using your existing Prometheus instances for local scraping and rule
|
||||
evaluation, while offloading storage and visualization to VictoriaMetrics Cloud.
|
||||
|
||||
## Integrating with Prometheus Remote Write
|
||||
|
||||
All VictoriaMetrics Cloud integrations, including this one, require an access token for authentication.
|
||||
The configuration examples below contain two placeholders: `<DEPLOYMENT_ENDPOINT_URL>` and `<YOUR_ACCESS_TOKEN>`.
|
||||
These need to be replaced with your actual access token.
|
||||
|
||||
To generate your access token (with **write access**, since Prometheus pushes metrics), follow the steps
|
||||
in the [Access Tokens documentation](https://docs.victoriametrics.com/victoriametrics-cloud/deployments/access-tokens).
|
||||
|
||||
To configure Prometheus to remote write to VictoriaMetrics Cloud, visit the [cloud console](https://console.victoriametrics.cloud/integrations/prometheus),
|
||||
or follow this interactive guide:
|
||||
|
||||
<iframe
|
||||
width="100%"
|
||||
height="1200"
|
||||
name="iframe"
|
||||
id="integration"
|
||||
frameborder="0"
|
||||
src="https://console.victoriametrics.cloud/public/integrations/prometheus"
|
||||
style="background: white;" >
|
||||
</iframe>
|
||||