mirror of
https://github.com/VictoriaMetrics/VictoriaMetrics.git
synced 2026-05-30 23:30:40 +03:00
Compare commits
26 Commits
vmui/fix-i
...
v1.102.16
| Author | SHA1 | Date | |
|---|---|---|---|

|
a7d0a75f4c | ||
|
|
ecc46a4f42 | ||
|
|
c4fd62188a | ||
|
|
b131c3bc22 | ||
|
|
2b8b9b8536 | ||
|
|
3f2289653c | ||
|
|
021c2552dd | ||
|
|
f7e1c430bb | ||
|
|
e8e2ef54a0 | ||
|
|
fd7b016c5b | ||
|
|
ec68ea2222 | ||
|
|
b85b28d30a | ||
|
|
7dfaef9088 | ||
|
|
75601c2d9a | ||
|
|
bcbe5e80b3 | ||
|
|
f7d5b11f00 | ||
|
|
26fba57cfa | ||
|
|
e3e5733b77 | ||
|
|
e11f5eda1c | ||
|
|
bbdb650f2f | ||
|
|
400101c674 | ||
|
|
08baa8139a | ||
|
|
97e99e1fc1 | ||
|
|
6828cca5a6 | ||
|
|
fc5d495900 | ||
|
|
974c094a52 |
@@ -101,7 +101,7 @@ func pushProtobufRequest(data []byte, lmp insertutils.LogMessageProcessor, useDe
|
||||
commonFields = slicesutil.SetLength(commonFields, len(attributes))
|
||||
for i, attr := range attributes {
|
||||
commonFields[i].Name = attr.Key
|
||||
commonFields[i].Value = attr.Value.FormatString()
|
||||
commonFields[i].Value = attr.Value.FormatString(true)
|
||||
}
|
||||
commonFieldsLen := len(commonFields)
|
||||
for _, sc := range rl.ScopeLogs {
|
||||
@@ -118,12 +118,12 @@ func pushFieldsFromScopeLogs(sc *pb.ScopeLogs, commonFields []logstorage.Field,
|
||||
fields = fields[:len(commonFields)]
|
||||
fields = append(fields, logstorage.Field{
|
||||
Name: "_msg",
|
||||
Value: lr.Body.FormatString(),
|
||||
Value: lr.Body.FormatString(true),
|
||||
})
|
||||
for _, attr := range lr.Attributes {
|
||||
fields = append(fields, logstorage.Field{
|
||||
Name: attr.Key,
|
||||
Value: attr.Value.FormatString(),
|
||||
Value: attr.Value.FormatString(true),
|
||||
})
|
||||
}
|
||||
if len(lr.TraceID) > 0 {
|
||||
|
||||
@@ -66,9 +66,9 @@ func TestPushProtoOk(t *testing.T) {
|
||||
},
|
||||
},
|
||||
[]int64{1234, 1235, 1236},
|
||||
`{"logger":"context","instance_id":"10","node_taints":"[{\"Key\":\"role\",\"Value\":{\"StringValue\":\"dev\",\"BoolValue\":null,\"IntValue\":null,\"DoubleValue\":null,\"ArrayValue\":null,\"KeyValueList\":null,\"BytesValue\":null}},{\"Key\":\"cluster_load_percent\",\"Value\":{\"StringValue\":null,\"BoolValue\":null,\"IntValue\":null,\"DoubleValue\":0.55,\"ArrayValue\":null,\"KeyValueList\":null,\"BytesValue\":null}}]","_msg":"log-line-message","severity":"Trace"}
|
||||
{"logger":"context","instance_id":"10","node_taints":"[{\"Key\":\"role\",\"Value\":{\"StringValue\":\"dev\",\"BoolValue\":null,\"IntValue\":null,\"DoubleValue\":null,\"ArrayValue\":null,\"KeyValueList\":null,\"BytesValue\":null}},{\"Key\":\"cluster_load_percent\",\"Value\":{\"StringValue\":null,\"BoolValue\":null,\"IntValue\":null,\"DoubleValue\":0.55,\"ArrayValue\":null,\"KeyValueList\":null,\"BytesValue\":null}}]","_msg":"log-line-message-msg-2","severity":"Unspecified"}
|
||||
{"logger":"context","instance_id":"10","node_taints":"[{\"Key\":\"role\",\"Value\":{\"StringValue\":\"dev\",\"BoolValue\":null,\"IntValue\":null,\"DoubleValue\":null,\"ArrayValue\":null,\"KeyValueList\":null,\"BytesValue\":null}},{\"Key\":\"cluster_load_percent\",\"Value\":{\"StringValue\":null,\"BoolValue\":null,\"IntValue\":null,\"DoubleValue\":0.55,\"ArrayValue\":null,\"KeyValueList\":null,\"BytesValue\":null}}]","_msg":"log-line-message-msg-2","severity":"Unspecified"}`,
|
||||
`{"logger":"context","instance_id":"10","node_taints":"{\"role\":\"dev\",\"cluster_load_percent\":0.55}","_msg":"log-line-message","severity":"Trace"}
|
||||
{"logger":"context","instance_id":"10","node_taints":"{\"role\":\"dev\",\"cluster_load_percent\":0.55}","_msg":"log-line-message-msg-2","severity":"Unspecified"}
|
||||
{"logger":"context","instance_id":"10","node_taints":"{\"role\":\"dev\",\"cluster_load_percent\":0.55}","_msg":"log-line-message-msg-2","severity":"Unspecified"}`,
|
||||
)
|
||||
|
||||
// multi-scope with resource attributes and multi-line
|
||||
@@ -113,8 +113,8 @@ func TestPushProtoOk(t *testing.T) {
|
||||
},
|
||||
},
|
||||
[]int64{1234, 1235, 2345, 2346, 2347, 2348},
|
||||
`{"logger":"context","instance_id":"10","node_taints":"[{\"Key\":\"role\",\"Value\":{\"StringValue\":\"dev\",\"BoolValue\":null,\"IntValue\":null,\"DoubleValue\":null,\"ArrayValue\":null,\"KeyValueList\":null,\"BytesValue\":null}},{\"Key\":\"cluster_load_percent\",\"Value\":{\"StringValue\":null,\"BoolValue\":null,\"IntValue\":null,\"DoubleValue\":0.55,\"ArrayValue\":null,\"KeyValueList\":null,\"BytesValue\":null}}]","_msg":"log-line-message","severity":"Trace"}
|
||||
{"logger":"context","instance_id":"10","node_taints":"[{\"Key\":\"role\",\"Value\":{\"StringValue\":\"dev\",\"BoolValue\":null,\"IntValue\":null,\"DoubleValue\":null,\"ArrayValue\":null,\"KeyValueList\":null,\"BytesValue\":null}},{\"Key\":\"cluster_load_percent\",\"Value\":{\"StringValue\":null,\"BoolValue\":null,\"IntValue\":null,\"DoubleValue\":0.55,\"ArrayValue\":null,\"KeyValueList\":null,\"BytesValue\":null}}]","_msg":"log-line-message-msg-2","severity":"Debug"}
|
||||
`{"logger":"context","instance_id":"10","node_taints":"{\"role\":\"dev\",\"cluster_load_percent\":0.55}","_msg":"log-line-message","severity":"Trace"}
|
||||
{"logger":"context","instance_id":"10","node_taints":"{\"role\":\"dev\",\"cluster_load_percent\":0.55}","_msg":"log-line-message-msg-2","severity":"Debug"}
|
||||
{"_msg":"log-line-resource-scope-1-0-0","severity":"Info2"}
|
||||
{"_msg":"log-line-resource-scope-1-0-1","severity":"Info2"}
|
||||
{"_msg":"log-line-resource-scope-1-1-0","severity":"Info4"}
|
||||
|
||||
@@ -2349,4 +2349,4 @@ VictoriaMetrics performs the following implicit conversions for incoming queries
|
||||
is passed to [rollup function](#rollup-functions), then a [subquery](#subqueries) with `1i` lookbehind window and `1i` step is automatically formed.
|
||||
For example, `rate(sum(up))` is automatically converted to `rate((sum(default_rollup(up)))[1i:1i])`.
|
||||
This behavior can be disabled or logged via `-search.disableImplicitConversion` and `-search.logImplicitConversion` command-line flags
|
||||
starting from [`v1.101.0` release](https://docs.victoriametrics.com/changelog/).
|
||||
starting from [`v1.102.0-rc2` release](https://docs.victoriametrics.com/changelog/changelog_2024/#v11020-rc2).
|
||||
File diff suppressed because one or more lines are too long
204
app/vlselect/vmui/assets/index-C68hz-qY.js
Normal file
204
app/vlselect/vmui/assets/index-C68hz-qY.js
Normal file
File diff suppressed because one or more lines are too long
File diff suppressed because one or more lines are too long
File diff suppressed because one or more lines are too long
@@ -35,10 +35,10 @@
|
||||
<meta property="og:title" content="UI for VictoriaLogs">
|
||||
<meta property="og:url" content="https://victoriametrics.com/products/victorialogs/">
|
||||
<meta property="og:description" content="Explore your log data with VictoriaLogs UI">
|
||||
<script type="module" crossorigin src="./assets/index-DuTUAk-m.js"></script>
|
||||
<script type="module" crossorigin src="./assets/index-C68hz-qY.js"></script>
|
||||
<link rel="modulepreload" crossorigin href="./assets/vendor-DojlIpLz.js">
|
||||
<link rel="stylesheet" crossorigin href="./assets/vendor-D1GxaB_c.css">
|
||||
<link rel="stylesheet" crossorigin href="./assets/index-CEiptoJw.css">
|
||||
<link rel="stylesheet" crossorigin href="./assets/index-B_R5bdPN.css">
|
||||
</head>
|
||||
<body>
|
||||
<noscript>You need to enable JavaScript to run this app.</noscript>
|
||||
|
||||
@@ -88,6 +88,9 @@ func (g *Group) Validate(validateTplFn ValidateTplFn, validateExpressions bool)
|
||||
if g.EvalOffset.Duration() > g.Interval.Duration() {
|
||||
return fmt.Errorf("eval_offset should be smaller than interval; now eval_offset: %v, interval: %v", g.EvalOffset.Duration(), g.Interval.Duration())
|
||||
}
|
||||
if g.EvalOffset != nil && g.EvalDelay != nil {
|
||||
return fmt.Errorf("eval_offset cannot be used with eval_delay")
|
||||
}
|
||||
if g.Limit < 0 {
|
||||
return fmt.Errorf("invalid limit %d, shouldn't be less than 0", g.Limit)
|
||||
}
|
||||
|
||||
@@ -27,14 +27,15 @@ import (
|
||||
var (
|
||||
ruleUpdateEntriesLimit = flag.Int("rule.updateEntriesLimit", 20, "Defines the max number of rule's state updates stored in-memory. "+
|
||||
"Rule's updates are available on rule's Details page and are used for debugging purposes. The number of stored updates can be overridden per rule via update_entries_limit param.")
|
||||
resendDelay = flag.Duration("rule.resendDelay", 0, "MiniMum amount of time to wait before resending an alert to notifier")
|
||||
resendDelay = flag.Duration("rule.resendDelay", 0, "MiniMum amount of time to wait before resending an alert to notifier.")
|
||||
maxResolveDuration = flag.Duration("rule.maxResolveDuration", 0, "Limits the maxiMum duration for automatic alert expiration, "+
|
||||
"which by default is 4 times evaluationInterval of the parent group")
|
||||
evalDelay = flag.Duration("rule.evalDelay", 30*time.Second, "Adjustment of the `time` parameter for rule evaluation requests to compensate intentional data delay from the datasource."+
|
||||
"Normally, should be equal to `-search.latencyOffset` (cmd-line flag configured for VictoriaMetrics single-node or vmselect).")
|
||||
evalDelay = flag.Duration("rule.evalDelay", 30*time.Second, "Adjustment of the `time` parameter for rule evaluation requests to compensate intentional data delay from the datasource. "+
|
||||
"Normally, should be equal to `-search.latencyOffset` (cmd-line flag configured for VictoriaMetrics single-node or vmselect). "+
|
||||
"This doesn't apply to groups with eval_offset specified.")
|
||||
disableAlertGroupLabel = flag.Bool("disableAlertgroupLabel", false, "Whether to disable adding group's Name as label to generated alerts and time series.")
|
||||
remoteReadLookBack = flag.Duration("remoteRead.lookback", time.Hour, "Lookback defines how far to look into past for alerts timeseries."+
|
||||
" For example, if lookback=1h then range from now() to now()-1h will be scanned.")
|
||||
remoteReadLookBack = flag.Duration("remoteRead.lookback", time.Hour, "Lookback defines how far to look into past for alerts timeseries. "+
|
||||
"For example, if lookback=1h then range from now() to now()-1h will be scanned.")
|
||||
)
|
||||
|
||||
// Group is an entity for grouping rules
|
||||
@@ -88,10 +89,10 @@ func newGroupMetrics(g *Group) *groupMetrics {
|
||||
m.set = metrics.NewSet()
|
||||
|
||||
labels := fmt.Sprintf(`group=%q, file=%q`, g.Name, g.File)
|
||||
m.iterationTotal = m.set.GetOrCreateCounter(fmt.Sprintf(`vmalert_iteration_total{%s}`, labels))
|
||||
m.iterationDuration = m.set.GetOrCreateSummary(fmt.Sprintf(`vmalert_iteration_duration_seconds{%s}`, labels))
|
||||
m.iterationMissed = m.set.GetOrCreateCounter(fmt.Sprintf(`vmalert_iteration_missed_total{%s}`, labels))
|
||||
m.iterationInterval = m.set.GetOrCreateGauge(fmt.Sprintf(`vmalert_iteration_interval_seconds{%s}`, labels), func() float64 {
|
||||
m.iterationTotal = m.set.NewCounter(fmt.Sprintf(`vmalert_iteration_total{%s}`, labels))
|
||||
m.iterationDuration = m.set.NewSummary(fmt.Sprintf(`vmalert_iteration_duration_seconds{%s}`, labels))
|
||||
m.iterationMissed = m.set.NewCounter(fmt.Sprintf(`vmalert_iteration_missed_total{%s}`, labels))
|
||||
m.iterationInterval = m.set.NewGauge(fmt.Sprintf(`vmalert_iteration_interval_seconds{%s}`, labels), func() float64 {
|
||||
g.mu.RLock()
|
||||
i := g.Interval.Seconds()
|
||||
g.mu.RUnlock()
|
||||
@@ -375,6 +376,7 @@ func (g *Group) Start(ctx context.Context, nts func() []notifier.Notifier, rw re
|
||||
}
|
||||
|
||||
resolveDuration := getResolveDuration(g.Interval, *resendDelay, *maxResolveDuration)
|
||||
// adjust request timestamp using evalDelay and evalAlignment if necessary
|
||||
ts = g.adjustReqTimestamp(ts)
|
||||
errs := e.execConcurrently(ctx, g.Rules, ts, g.Concurrency, resolveDuration, g.Limit)
|
||||
for err := range errs {
|
||||
@@ -468,10 +470,18 @@ func (g *Group) DeepCopy() *Group {
|
||||
return &newG
|
||||
}
|
||||
|
||||
// delayBeforeStart returns a duration on the interval between [ts..ts+interval].
|
||||
// delayBeforeStart accounts for `offset`, so returned duration should be always
|
||||
// bigger than the `offset`.
|
||||
// if offset is specified, delayBeforeStart returns a duration to help aligning timestamp with offset;
|
||||
// otherwise, it returns a random duration between [0..interval] based on group key.
|
||||
func delayBeforeStart(ts time.Time, key uint64, interval time.Duration, offset *time.Duration) time.Duration {
|
||||
if offset != nil {
|
||||
currentOffsetPoint := ts.Truncate(interval).Add(*offset)
|
||||
if currentOffsetPoint.Before(ts) {
|
||||
// wait until the next offset point
|
||||
return currentOffsetPoint.Add(interval).Sub(ts)
|
||||
}
|
||||
return currentOffsetPoint.Sub(ts)
|
||||
}
|
||||
|
||||
var randSleep time.Duration
|
||||
randSleep = time.Duration(float64(interval) * (float64(key) / (1 << 64)))
|
||||
sleepOffset := time.Duration(ts.UnixNano() % interval.Nanoseconds())
|
||||
@@ -479,15 +489,6 @@ func delayBeforeStart(ts time.Time, key uint64, interval time.Duration, offset *
|
||||
randSleep += interval
|
||||
}
|
||||
randSleep -= sleepOffset
|
||||
// check if `ts` after randSleep is before `offset`,
|
||||
// if it is, add extra eval_offset to randSleep.
|
||||
// see https://github.com/VictoriaMetrics/VictoriaMetrics/issues/3409.
|
||||
if offset != nil {
|
||||
tmpEvalTS := ts.Add(randSleep)
|
||||
if tmpEvalTS.Before(tmpEvalTS.Truncate(interval).Add(*offset)) {
|
||||
randSleep += *offset
|
||||
}
|
||||
}
|
||||
return randSleep
|
||||
}
|
||||
|
||||
@@ -593,26 +594,14 @@ func getResolveDuration(groupInterval, delta, maxDuration time.Duration) time.Du
|
||||
}
|
||||
|
||||
func (g *Group) adjustReqTimestamp(timestamp time.Time) time.Time {
|
||||
// if `eval_offset` is specified, timestamp is already aligned with offset, do nothing
|
||||
if g.EvalOffset != nil {
|
||||
// calculate the min timestamp on the evaluationInterval
|
||||
intervalStart := timestamp.Truncate(g.Interval)
|
||||
ts := intervalStart.Add(*g.EvalOffset)
|
||||
if timestamp.Before(ts) {
|
||||
// if passed timestamp is before the expected evaluation offset,
|
||||
// then we should adjust it to the previous evaluation round.
|
||||
// E.g. request with evaluationInterval=1h and evaluationOffset=30m
|
||||
// was evaluated at 11:20. Then the timestamp should be adjusted
|
||||
// to 10:30, to the previous evaluationInterval.
|
||||
return ts.Add(-g.Interval)
|
||||
}
|
||||
// when `eval_offset` is using, ts shouldn't be effect by `eval_alignment` and `eval_delay`
|
||||
// since it should be always aligned.
|
||||
return ts
|
||||
return timestamp
|
||||
}
|
||||
|
||||
timestamp = timestamp.Add(-g.getEvalDelay())
|
||||
|
||||
// always apply the alignment as a last step
|
||||
// apply the alignment as the last step
|
||||
if g.evalAlignment == nil || *g.evalAlignment {
|
||||
// align query time with interval to get similar result with grafana when plotting time series.
|
||||
// see https://github.com/VictoriaMetrics/VictoriaMetrics/issues/5049
|
||||
|
||||
@@ -533,34 +533,14 @@ func TestGroupStartDelay(t *testing.T) {
|
||||
f("2023-01-01T00:00:29.000+00:00", "2023-01-01T00:00:30.000+00:00")
|
||||
f("2023-01-01T00:00:31.000+00:00", "2023-01-01T00:05:30.000+00:00")
|
||||
|
||||
// test group with offset smaller than above fixed randSleep,
|
||||
// this way randSleep will always be enough
|
||||
offset := 20 * time.Second
|
||||
// test group with offset
|
||||
offset := 3 * time.Minute
|
||||
g.EvalOffset = &offset
|
||||
|
||||
f("2023-01-01T00:00:00.000+00:00", "2023-01-01T00:00:30.000+00:00")
|
||||
f("2023-01-01T00:00:29.000+00:00", "2023-01-01T00:00:30.000+00:00")
|
||||
f("2023-01-01T00:00:31.000+00:00", "2023-01-01T00:05:30.000+00:00")
|
||||
|
||||
// test group with offset bigger than above fixed randSleep,
|
||||
// this way offset will be added to delay
|
||||
offset = 3 * time.Minute
|
||||
g.EvalOffset = &offset
|
||||
|
||||
f("2023-01-01T00:00:00.000+00:00", "2023-01-01T00:03:30.000+00:00")
|
||||
f("2023-01-01T00:00:29.000+00:00", "2023-01-01T00:03:30.000+00:00")
|
||||
f("2023-01-01T00:01:00.000+00:00", "2023-01-01T00:08:30.000+00:00")
|
||||
f("2023-01-01T00:03:30.000+00:00", "2023-01-01T00:08:30.000+00:00")
|
||||
f("2023-01-01T00:07:30.000+00:00", "2023-01-01T00:13:30.000+00:00")
|
||||
|
||||
offset = 10 * time.Minute
|
||||
g.EvalOffset = &offset
|
||||
// interval of 1h and key generate a static delay of 6m
|
||||
g.Interval = time.Hour
|
||||
|
||||
f("2023-01-01T00:00:00.000+00:00", "2023-01-01T00:16:00.000+00:00")
|
||||
f("2023-01-01T00:05:00.000+00:00", "2023-01-01T00:16:00.000+00:00")
|
||||
f("2023-01-01T00:30:00.000+00:00", "2023-01-01T01:16:00.000+00:00")
|
||||
f("2023-01-01T00:00:15.000+00:00", "2023-01-01T00:03:00.000+00:00")
|
||||
f("2023-01-01T00:01:00.000+00:00", "2023-01-01T00:03:00.000+00:00")
|
||||
f("2023-01-01T00:03:30.000+00:00", "2023-01-01T00:08:00.000+00:00")
|
||||
f("2023-01-01T00:08:00.000+00:00", "2023-01-01T00:08:00.000+00:00")
|
||||
}
|
||||
|
||||
func TestGetPrometheusReqTimestamp(t *testing.T) {
|
||||
@@ -590,17 +570,11 @@ func TestGetPrometheusReqTimestamp(t *testing.T) {
|
||||
evalAlignment: &disableAlign,
|
||||
}, "2023-08-28T11:11:00+00:00", "2023-08-28T11:10:30+00:00")
|
||||
|
||||
// with eval_offset, find previous offset point + default evalDelay
|
||||
// with eval_offset
|
||||
f(&Group{
|
||||
EvalOffset: &offset,
|
||||
Interval: time.Hour,
|
||||
}, "2023-08-28T11:11:00+00:00", "2023-08-28T10:30:00+00:00")
|
||||
|
||||
// with eval_offset + default evalDelay
|
||||
f(&Group{
|
||||
EvalOffset: &offset,
|
||||
Interval: time.Hour,
|
||||
}, "2023-08-28T11:41:00+00:00", "2023-08-28T11:30:00+00:00")
|
||||
}, "2023-08-28T11:30:00+00:00", "2023-08-28T11:30:00+00:00")
|
||||
|
||||
// 1h interval with eval_delay
|
||||
f(&Group{
|
||||
|
||||
@@ -15,6 +15,7 @@ import (
|
||||
"github.com/VictoriaMetrics/VictoriaMetrics/app/vmselect/prometheus"
|
||||
"github.com/VictoriaMetrics/VictoriaMetrics/app/vmselect/promql"
|
||||
"github.com/VictoriaMetrics/VictoriaMetrics/app/vmselect/searchutils"
|
||||
"github.com/VictoriaMetrics/VictoriaMetrics/app/vmselect/stats"
|
||||
"github.com/VictoriaMetrics/VictoriaMetrics/app/vmstorage"
|
||||
"github.com/VictoriaMetrics/VictoriaMetrics/lib/cgroup"
|
||||
"github.com/VictoriaMetrics/VictoriaMetrics/lib/flagutil"
|
||||
@@ -29,7 +30,10 @@ import (
|
||||
)
|
||||
|
||||
var (
|
||||
deleteAuthKey = flagutil.NewPassword("deleteAuthKey", "authKey for metrics' deletion via /api/v1/admin/tsdb/delete_series and /tags/delSeries. It could be passed via authKey query arg. It overrides -httpAuth.*")
|
||||
deleteAuthKey = flagutil.NewPassword("deleteAuthKey", "authKey for metrics' deletion via /api/v1/admin/tsdb/delete_series and /tags/delSeries. It could be passed via authKey query arg. It overrides -httpAuth.*")
|
||||
metricNamesStatsResetAuthKey = flagutil.NewPassword("metricNamesStatsResetAuthKey", "authKey for reseting metric names usage cache via /api/v1/admin/status/metric_names_stats/reset. It overrides -httpAuth.*. "+
|
||||
"See https://docs.victoriametrics.com/#track-ingested-metrics-usage")
|
||||
|
||||
maxConcurrentRequests = flag.Int("search.maxConcurrentRequests", getDefaultMaxConcurrentRequests(), "The maximum number of concurrent search requests. "+
|
||||
"It shouldn't be high, since a single request can saturate all the CPU cores, while many concurrently executed requests may require high amounts of memory. "+
|
||||
"See also -search.maxQueueDuration and -search.maxMemoryPerQuery")
|
||||
@@ -178,7 +182,6 @@ func RequestHandler(w http.ResponseWriter, r *http.Request) bool {
|
||||
promql.ResetRollupResultCache()
|
||||
return true
|
||||
}
|
||||
|
||||
if strings.HasPrefix(path, "/api/v1/label/") {
|
||||
s := path[len("/api/v1/label/"):]
|
||||
if strings.HasSuffix(s, "/values") {
|
||||
@@ -399,6 +402,26 @@ func RequestHandler(w http.ResponseWriter, r *http.Request) bool {
|
||||
}
|
||||
w.WriteHeader(http.StatusNoContent)
|
||||
return true
|
||||
case "/api/v1/status/metric_names_stats":
|
||||
metricNamesStatsRequests.Inc()
|
||||
if err := stats.MetricNamesStatsHandler(qt, w, r); err != nil {
|
||||
metricNamesStatsErrors.Inc()
|
||||
httpserver.Errorf(w, r, "%s", err)
|
||||
return true
|
||||
}
|
||||
return true
|
||||
case "/api/v1/admin/status/metric_names_stats/reset":
|
||||
metricNamesStatsResetRequests.Inc()
|
||||
if !httpserver.CheckAuthFlag(w, r, metricNamesStatsResetAuthKey) {
|
||||
return true
|
||||
}
|
||||
if err := stats.ResetMetricNamesStatsHandler(qt); err != nil {
|
||||
metricNamesStatsResetErrors.Inc()
|
||||
httpserver.Errorf(w, r, "%s", err)
|
||||
return true
|
||||
}
|
||||
w.WriteHeader(http.StatusNoContent)
|
||||
return true
|
||||
default:
|
||||
return false
|
||||
}
|
||||
@@ -674,6 +697,12 @@ var (
|
||||
metadataRequests = metrics.NewCounter(`vm_http_requests_total{path="/api/v1/metadata"}`)
|
||||
buildInfoRequests = metrics.NewCounter(`vm_http_requests_total{path="/api/v1/buildinfo"}`)
|
||||
queryExemplarsRequests = metrics.NewCounter(`vm_http_requests_total{path="/api/v1/query_exemplars"}`)
|
||||
|
||||
metricNamesStatsRequests = metrics.NewCounter(`vm_http_requests_total{path="/api/v1/status/metric_names_stats"}`)
|
||||
metricNamesStatsErrors = metrics.NewCounter(`vm_http_request_errors_total{path="/api/v1/status/metric_names_stats"}`)
|
||||
|
||||
metricNamesStatsResetRequests = metrics.NewCounter(`vm_http_requests_total{path="/api/v1/admin/status/metric_names_stats/reset"}`)
|
||||
metricNamesStatsResetErrors = metrics.NewCounter(`vm_http_request_errors_total{path="/api/v1/admin/status/metric_names_stats/reset"}`)
|
||||
)
|
||||
|
||||
func proxyVMAlertRequests(w http.ResponseWriter, r *http.Request) {
|
||||
|
||||
@@ -1367,3 +1367,18 @@ func applyGraphiteRegexpFilter(filter string, ss []string) ([]string, error) {
|
||||
//
|
||||
// See https://github.com/golang/go/blob/704401ffa06c60e059c9e6e4048045b4ff42530a/src/runtime/malloc.go#L11
|
||||
const maxFastAllocBlockSize = 32 * 1024
|
||||
|
||||
// GetMetricNamesStats returns statistic for timeseries metric names usage.
|
||||
func GetMetricNamesStats(qt *querytracer.Tracer, limit, le int, matchPattern string) (storage.MetricNamesStatsResponse, error) {
|
||||
qt = qt.NewChild("get metric names usage statistics with limit: %d, less or equal to: %d, match pattern=%q", limit, le, matchPattern)
|
||||
defer qt.Done()
|
||||
return vmstorage.GetMetricNamesStats(qt, limit, le, matchPattern)
|
||||
}
|
||||
|
||||
// ResetMetricNamesStats resets state of metric names usage
|
||||
func ResetMetricNamesStats(qt *querytracer.Tracer) error {
|
||||
qt = qt.NewChild("reset metric names usage stats")
|
||||
defer qt.Done()
|
||||
vmstorage.ResetMetricNamesStats(qt)
|
||||
return nil
|
||||
}
|
||||
|
||||
@@ -12,6 +12,9 @@ import (
|
||||
"time"
|
||||
"unsafe"
|
||||
|
||||
"github.com/VictoriaMetrics/metrics"
|
||||
"github.com/VictoriaMetrics/metricsql"
|
||||
|
||||
"github.com/VictoriaMetrics/VictoriaMetrics/app/vmselect/netstorage"
|
||||
"github.com/VictoriaMetrics/VictoriaMetrics/app/vmselect/searchutils"
|
||||
"github.com/VictoriaMetrics/VictoriaMetrics/lib/bytesutil"
|
||||
@@ -25,8 +28,6 @@ import (
|
||||
"github.com/VictoriaMetrics/VictoriaMetrics/lib/querytracer"
|
||||
"github.com/VictoriaMetrics/VictoriaMetrics/lib/storage"
|
||||
"github.com/VictoriaMetrics/VictoriaMetrics/lib/stringsutil"
|
||||
"github.com/VictoriaMetrics/metrics"
|
||||
"github.com/VictoriaMetrics/metricsql"
|
||||
)
|
||||
|
||||
var (
|
||||
@@ -814,7 +815,19 @@ func evalRollupFunc(qt *querytracer.Tracer, ec *EvalConfig, funcName string, rf
|
||||
Err: fmt.Errorf("`@` modifier must return a single series; it returns %d series instead", len(tssAt)),
|
||||
}
|
||||
}
|
||||
atTimestamp := int64(tssAt[0].Values[0] * 1000)
|
||||
atValue := math.NaN()
|
||||
for _, v := range tssAt[0].Values {
|
||||
if !math.IsNaN(v) {
|
||||
atValue = v
|
||||
break
|
||||
}
|
||||
}
|
||||
if math.IsNaN(atValue) {
|
||||
return nil, &httpserver.UserReadableError{
|
||||
Err: fmt.Errorf("`@` modifier must return a non-NaN value"),
|
||||
}
|
||||
}
|
||||
atTimestamp := int64(atValue * 1000)
|
||||
ecNew := copyEvalConfig(ec)
|
||||
ecNew.Start = atTimestamp
|
||||
ecNew.End = atTimestamp
|
||||
|
||||
33
app/vmselect/stats/metric_names_usage_response.qtpl
Normal file
33
app/vmselect/stats/metric_names_usage_response.qtpl
Normal file
@@ -0,0 +1,33 @@
|
||||
{% import (
|
||||
"github.com/VictoriaMetrics/VictoriaMetrics/lib/querytracer"
|
||||
"github.com/VictoriaMetrics/VictoriaMetrics/lib/storage"
|
||||
) %}
|
||||
|
||||
{% stripspace %}
|
||||
MetricNamesStatsResponse generates response for /api/v1/status/metric_names_stats .
|
||||
{% func MetricNamesStatsResponse(stats *storage.MetricNamesStatsResponse, qt *querytracer.Tracer) %}
|
||||
{
|
||||
"status":"success",
|
||||
"statsCollectedSince": {%dul= stats.CollectedSinceTs %},
|
||||
"statsCollectedRecordsTotal": {%dul= stats.TotalRecords %},
|
||||
"trackerMemoryMaxSizeBytes": {%dul= stats.MaxSizeBytes %},
|
||||
"trackerCurrentMemoryUsageBytes": {%dul= stats.CurrentSizeBytes %},
|
||||
"records":
|
||||
[
|
||||
{% for i, r := range stats.Records %}
|
||||
{
|
||||
"metricName":{%q= r.MetricName %},
|
||||
"queryRequestsCount":{%dul= r.RequestsCount %},
|
||||
"lastQueryRequestTimestamp":{%dul= r.LastRequestTs %}
|
||||
}
|
||||
{% if i+1 < len(stats.Records) %},{% endif %}
|
||||
{% endfor %}
|
||||
]
|
||||
{% code qt.Done() %}
|
||||
{% code traceJSON := qt.ToJSON() %}
|
||||
{% if traceJSON != "" %},"trace":{%s= traceJSON %}{% endif %}
|
||||
|
||||
}
|
||||
{% endfunc %}
|
||||
|
||||
{% endstripspace %}
|
||||
117
app/vmselect/stats/metric_names_usage_response.qtpl.go
Normal file
117
app/vmselect/stats/metric_names_usage_response.qtpl.go
Normal file
@@ -0,0 +1,117 @@
|
||||
// Code generated by qtc from "metric_names_usage_response.qtpl". DO NOT EDIT.
|
||||
// See https://github.com/valyala/quicktemplate for details.
|
||||
|
||||
//line app/vmselect/stats/metric_names_usage_response.qtpl:1
|
||||
package stats
|
||||
|
||||
//line app/vmselect/stats/metric_names_usage_response.qtpl:1
|
||||
import (
|
||||
"github.com/VictoriaMetrics/VictoriaMetrics/lib/querytracer"
|
||||
"github.com/VictoriaMetrics/VictoriaMetrics/lib/storage"
|
||||
)
|
||||
|
||||
// MetricNamesStatsResponse generates response for /api/v1/status/metric_names_stats .
|
||||
|
||||
//line app/vmselect/stats/metric_names_usage_response.qtpl:8
|
||||
import (
|
||||
qtio422016 "io"
|
||||
|
||||
qt422016 "github.com/valyala/quicktemplate"
|
||||
)
|
||||
|
||||
//line app/vmselect/stats/metric_names_usage_response.qtpl:8
|
||||
var (
|
||||
_ = qtio422016.Copy
|
||||
_ = qt422016.AcquireByteBuffer
|
||||
)
|
||||
|
||||
//line app/vmselect/stats/metric_names_usage_response.qtpl:8
|
||||
func StreamMetricNamesStatsResponse(qw422016 *qt422016.Writer, stats *storage.MetricNamesStatsResponse, qt *querytracer.Tracer) {
|
||||
//line app/vmselect/stats/metric_names_usage_response.qtpl:8
|
||||
qw422016.N().S(`{"status":"success","statsCollectedSince":`)
|
||||
//line app/vmselect/stats/metric_names_usage_response.qtpl:11
|
||||
qw422016.N().DUL(stats.CollectedSinceTs)
|
||||
//line app/vmselect/stats/metric_names_usage_response.qtpl:11
|
||||
qw422016.N().S(`,"statsCollectedRecordsTotal":`)
|
||||
//line app/vmselect/stats/metric_names_usage_response.qtpl:12
|
||||
qw422016.N().DUL(stats.TotalRecords)
|
||||
//line app/vmselect/stats/metric_names_usage_response.qtpl:12
|
||||
qw422016.N().S(`,"trackerMemoryMaxSizeBytes":`)
|
||||
//line app/vmselect/stats/metric_names_usage_response.qtpl:13
|
||||
qw422016.N().DUL(stats.MaxSizeBytes)
|
||||
//line app/vmselect/stats/metric_names_usage_response.qtpl:13
|
||||
qw422016.N().S(`,"trackerCurrentMemoryUsageBytes":`)
|
||||
//line app/vmselect/stats/metric_names_usage_response.qtpl:14
|
||||
qw422016.N().DUL(stats.CurrentSizeBytes)
|
||||
//line app/vmselect/stats/metric_names_usage_response.qtpl:14
|
||||
qw422016.N().S(`,"records":[`)
|
||||
//line app/vmselect/stats/metric_names_usage_response.qtpl:17
|
||||
for i, r := range stats.Records {
|
||||
//line app/vmselect/stats/metric_names_usage_response.qtpl:17
|
||||
qw422016.N().S(`{"metricName":`)
|
||||
//line app/vmselect/stats/metric_names_usage_response.qtpl:19
|
||||
qw422016.N().Q(r.MetricName)
|
||||
//line app/vmselect/stats/metric_names_usage_response.qtpl:19
|
||||
qw422016.N().S(`,"queryRequestsCount":`)
|
||||
//line app/vmselect/stats/metric_names_usage_response.qtpl:20
|
||||
qw422016.N().DUL(r.RequestsCount)
|
||||
//line app/vmselect/stats/metric_names_usage_response.qtpl:20
|
||||
qw422016.N().S(`,"lastQueryRequestTimestamp":`)
|
||||
//line app/vmselect/stats/metric_names_usage_response.qtpl:21
|
||||
qw422016.N().DUL(r.LastRequestTs)
|
||||
//line app/vmselect/stats/metric_names_usage_response.qtpl:21
|
||||
qw422016.N().S(`}`)
|
||||
//line app/vmselect/stats/metric_names_usage_response.qtpl:23
|
||||
if i+1 < len(stats.Records) {
|
||||
//line app/vmselect/stats/metric_names_usage_response.qtpl:23
|
||||
qw422016.N().S(`,`)
|
||||
//line app/vmselect/stats/metric_names_usage_response.qtpl:23
|
||||
}
|
||||
//line app/vmselect/stats/metric_names_usage_response.qtpl:24
|
||||
}
|
||||
//line app/vmselect/stats/metric_names_usage_response.qtpl:24
|
||||
qw422016.N().S(`]`)
|
||||
//line app/vmselect/stats/metric_names_usage_response.qtpl:26
|
||||
qt.Done()
|
||||
|
||||
//line app/vmselect/stats/metric_names_usage_response.qtpl:27
|
||||
traceJSON := qt.ToJSON()
|
||||
|
||||
//line app/vmselect/stats/metric_names_usage_response.qtpl:28
|
||||
if traceJSON != "" {
|
||||
//line app/vmselect/stats/metric_names_usage_response.qtpl:28
|
||||
qw422016.N().S(`,"trace":`)
|
||||
//line app/vmselect/stats/metric_names_usage_response.qtpl:28
|
||||
qw422016.N().S(traceJSON)
|
||||
//line app/vmselect/stats/metric_names_usage_response.qtpl:28
|
||||
}
|
||||
//line app/vmselect/stats/metric_names_usage_response.qtpl:28
|
||||
qw422016.N().S(`}`)
|
||||
//line app/vmselect/stats/metric_names_usage_response.qtpl:31
|
||||
}
|
||||
|
||||
//line app/vmselect/stats/metric_names_usage_response.qtpl:31
|
||||
func WriteMetricNamesStatsResponse(qq422016 qtio422016.Writer, stats *storage.MetricNamesStatsResponse, qt *querytracer.Tracer) {
|
||||
//line app/vmselect/stats/metric_names_usage_response.qtpl:31
|
||||
qw422016 := qt422016.AcquireWriter(qq422016)
|
||||
//line app/vmselect/stats/metric_names_usage_response.qtpl:31
|
||||
StreamMetricNamesStatsResponse(qw422016, stats, qt)
|
||||
//line app/vmselect/stats/metric_names_usage_response.qtpl:31
|
||||
qt422016.ReleaseWriter(qw422016)
|
||||
//line app/vmselect/stats/metric_names_usage_response.qtpl:31
|
||||
}
|
||||
|
||||
//line app/vmselect/stats/metric_names_usage_response.qtpl:31
|
||||
func MetricNamesStatsResponse(stats *storage.MetricNamesStatsResponse, qt *querytracer.Tracer) string {
|
||||
//line app/vmselect/stats/metric_names_usage_response.qtpl:31
|
||||
qb422016 := qt422016.AcquireByteBuffer()
|
||||
//line app/vmselect/stats/metric_names_usage_response.qtpl:31
|
||||
WriteMetricNamesStatsResponse(qb422016, stats, qt)
|
||||
//line app/vmselect/stats/metric_names_usage_response.qtpl:31
|
||||
qs422016 := string(qb422016.B)
|
||||
//line app/vmselect/stats/metric_names_usage_response.qtpl:31
|
||||
qt422016.ReleaseByteBuffer(qb422016)
|
||||
//line app/vmselect/stats/metric_names_usage_response.qtpl:31
|
||||
return qs422016
|
||||
//line app/vmselect/stats/metric_names_usage_response.qtpl:31
|
||||
}
|
||||
50
app/vmselect/stats/stats.go
Normal file
50
app/vmselect/stats/stats.go
Normal file
@@ -0,0 +1,50 @@
|
||||
package stats
|
||||
|
||||
import (
|
||||
"fmt"
|
||||
"net/http"
|
||||
"strconv"
|
||||
|
||||
"github.com/VictoriaMetrics/VictoriaMetrics/app/vmselect/netstorage"
|
||||
"github.com/VictoriaMetrics/VictoriaMetrics/lib/querytracer"
|
||||
)
|
||||
|
||||
// MetricNamesStatsHandler returns timeseries metric names usage statistics
|
||||
func MetricNamesStatsHandler(qt *querytracer.Tracer, w http.ResponseWriter, r *http.Request) error {
|
||||
limit := 1000
|
||||
limitStr := r.FormValue("limit")
|
||||
if len(limitStr) > 0 {
|
||||
n, err := strconv.Atoi(limitStr)
|
||||
if err != nil {
|
||||
return fmt.Errorf("cannot parse `limit` arg %q: %w", limitStr, err)
|
||||
}
|
||||
if n > 0 {
|
||||
limit = n
|
||||
}
|
||||
}
|
||||
// by default display all values
|
||||
le := -1
|
||||
leStr := r.FormValue("le")
|
||||
if len(leStr) > 0 {
|
||||
n, err := strconv.Atoi(leStr)
|
||||
if err != nil {
|
||||
return fmt.Errorf("cannot parse `le` arg %q: %w", leStr, err)
|
||||
}
|
||||
le = n
|
||||
}
|
||||
matchPattern := r.FormValue("match_pattern")
|
||||
stats, err := netstorage.GetMetricNamesStats(qt, limit, le, matchPattern)
|
||||
if err != nil {
|
||||
return err
|
||||
}
|
||||
WriteMetricNamesStatsResponse(w, &stats, qt)
|
||||
return nil
|
||||
}
|
||||
|
||||
// ResetMetricNamesStatsHandler resets metric names usage state
|
||||
func ResetMetricNamesStatsHandler(qt *querytracer.Tracer) error {
|
||||
if err := netstorage.ResetMetricNamesStats(qt); err != nil {
|
||||
return err
|
||||
}
|
||||
return nil
|
||||
}
|
||||
@@ -2349,4 +2349,4 @@ VictoriaMetrics performs the following implicit conversions for incoming queries
|
||||
is passed to [rollup function](#rollup-functions), then a [subquery](#subqueries) with `1i` lookbehind window and `1i` step is automatically formed.
|
||||
For example, `rate(sum(up))` is automatically converted to `rate((sum(default_rollup(up)))[1i:1i])`.
|
||||
This behavior can be disabled or logged via `-search.disableImplicitConversion` and `-search.logImplicitConversion` command-line flags
|
||||
starting from [`v1.101.0` release](https://docs.victoriametrics.com/changelog/).
|
||||
starting from [`v1.102.0-rc2` release](https://docs.victoriametrics.com/changelog/changelog_2024/#v11020-rc2).
|
||||
1
app/vmselect/vmui/assets/index-B_R5bdPN.css
Normal file
1
app/vmselect/vmui/assets/index-B_R5bdPN.css
Normal file
File diff suppressed because one or more lines are too long
File diff suppressed because one or more lines are too long
@@ -36,10 +36,10 @@
|
||||
<meta property="og:title" content="UI for VictoriaMetrics">
|
||||
<meta property="og:url" content="https://victoriametrics.com/">
|
||||
<meta property="og:description" content="Explore and troubleshoot your VictoriaMetrics data">
|
||||
<script type="module" crossorigin src="./assets/index-DzehQsnZ.js"></script>
|
||||
<script type="module" crossorigin src="./assets/index-C4jrb8hY.js"></script>
|
||||
<link rel="modulepreload" crossorigin href="./assets/vendor-DojlIpLz.js">
|
||||
<link rel="stylesheet" crossorigin href="./assets/vendor-D1GxaB_c.css">
|
||||
<link rel="stylesheet" crossorigin href="./assets/index-Cqbobgy7.css">
|
||||
<link rel="stylesheet" crossorigin href="./assets/index-B_R5bdPN.css">
|
||||
</head>
|
||||
<body>
|
||||
<noscript>You need to enable JavaScript to run this app.</noscript>
|
||||
|
||||
@@ -76,6 +76,11 @@ var (
|
||||
"This may improve performance and decrease disk space usage for the use cases with fixed set of timeseries scattered across a "+
|
||||
"big time range (for example, when loading years of historical data). "+
|
||||
"See https://docs.victoriametrics.com/single-server-victoriametrics/#index-tuning")
|
||||
trackMetricNamesStats = flag.Bool("storage.trackMetricNamesStats", false, "Whether to track ingest and query requests for timeseries metric names. "+
|
||||
"This feature allows to track metric names unused at query requests. "+
|
||||
"See https://docs.victoriametrics.com/#track-ingested-metrics-usage")
|
||||
cacheSizeMetricNamesStats = flagutil.NewBytes("storage.cacheSizeMetricNamesStats", 0, "Overrides max size for storage/metricNamesStatsTracker cache. "+
|
||||
"See https://docs.victoriametrics.com/single-server-victoriametrics/#cache-tuning")
|
||||
)
|
||||
|
||||
// CheckTimeRange returns true if the given tr is denied for querying.
|
||||
@@ -105,6 +110,7 @@ func Init(resetCacheIfNeeded func(mrs []storage.MetricRow)) {
|
||||
storage.SetFreeDiskSpaceLimit(minFreeDiskSpaceBytes.N)
|
||||
storage.SetTSIDCacheSize(cacheSizeStorageTSID.IntN())
|
||||
storage.SetTagFiltersCacheSize(cacheSizeIndexDBTagFilters.IntN())
|
||||
storage.SetMetricNamesStatsCacheSize(cacheSizeMetricNamesStats.IntN())
|
||||
mergeset.SetIndexBlocksCacheSize(cacheSizeIndexDBIndexBlocks.IntN())
|
||||
mergeset.SetDataBlocksCacheSize(cacheSizeIndexDBDataBlocks.IntN())
|
||||
mergeset.SetDataBlocksSparseCacheSize(cacheSizeIndexDBDataBlocksSparse.IntN())
|
||||
@@ -115,12 +121,12 @@ func Init(resetCacheIfNeeded func(mrs []storage.MetricRow)) {
|
||||
logger.Infof("opening storage at %q with -retentionPeriod=%s", *DataPath, retentionPeriod)
|
||||
startTime := time.Now()
|
||||
WG = syncwg.WaitGroup{}
|
||||
|
||||
opts := storage.OpenOptions{
|
||||
Retention: retentionPeriod.Duration(),
|
||||
MaxHourlySeries: *maxHourlySeries,
|
||||
MaxDailySeries: *maxDailySeries,
|
||||
DisablePerDayIndex: *disablePerDayIndex,
|
||||
Retention: retentionPeriod.Duration(),
|
||||
MaxHourlySeries: *maxHourlySeries,
|
||||
MaxDailySeries: *maxDailySeries,
|
||||
DisablePerDayIndex: *disablePerDayIndex,
|
||||
TrackMetricNamesStats: *trackMetricNamesStats,
|
||||
}
|
||||
strg := storage.MustOpenStorage(*DataPath, opts)
|
||||
Storage = strg
|
||||
@@ -193,6 +199,21 @@ func DeleteSeries(qt *querytracer.Tracer, tfss []*storage.TagFilters, maxMetrics
|
||||
return n, err
|
||||
}
|
||||
|
||||
// GetMetricNamesStats returns metric names usage stats with give limit and lte predicate
|
||||
func GetMetricNamesStats(qt *querytracer.Tracer, limit, le int, matchPattern string) (storage.MetricNamesStatsResponse, error) {
|
||||
WG.Add(1)
|
||||
r := Storage.GetMetricNamesStats(qt, limit, le, matchPattern)
|
||||
WG.Done()
|
||||
return r, nil
|
||||
}
|
||||
|
||||
// ResetMetricNamesStats resets state for metric names usage tracker
|
||||
func ResetMetricNamesStats(qt *querytracer.Tracer) {
|
||||
WG.Add(1)
|
||||
Storage.ResetMetricNamesStats(qt)
|
||||
WG.Done()
|
||||
}
|
||||
|
||||
// SearchMetricNames returns metric names for the given tfss on the given tr.
|
||||
func SearchMetricNames(qt *querytracer.Tracer, tfss []*storage.TagFilters, tr storage.TimeRange, maxMetrics int, deadline uint64) ([]string, error) {
|
||||
WG.Add(1)
|
||||
@@ -657,6 +678,12 @@ func writeStorageMetrics(w io.Writer, strg *storage.Storage) {
|
||||
|
||||
metrics.WriteGaugeUint64(w, `vm_next_retention_seconds`, m.NextRetentionSeconds)
|
||||
|
||||
if *trackMetricNamesStats {
|
||||
metrics.WriteCounterUint64(w, `vm_cache_size_bytes{type="storage/metricNamesStatsTracker"}`, m.MetricNamesUsageTrackerSizeBytes)
|
||||
metrics.WriteCounterUint64(w, `vm_cache_size{type="storage/metricNamesStatsTracker"}`, m.MetricNamesUsageTrackerSize)
|
||||
metrics.WriteCounterUint64(w, `vm_cache_size_max_bytes{type="storage/metricNamesStatsTracker"}`, m.MetricNamesUsageTrackerSizeMaxBytes)
|
||||
}
|
||||
|
||||
metrics.WriteGaugeUint64(w, `vm_downsampling_partitions_scheduled`, tm.ScheduledDownsamplingPartitions)
|
||||
metrics.WriteGaugeUint64(w, `vm_downsampling_partitions_scheduled_size_bytes`, tm.ScheduledDownsamplingPartitionsSize)
|
||||
}
|
||||
|
||||
@@ -2349,4 +2349,4 @@ VictoriaMetrics performs the following implicit conversions for incoming queries
|
||||
is passed to [rollup function](#rollup-functions), then a [subquery](#subqueries) with `1i` lookbehind window and `1i` step is automatically formed.
|
||||
For example, `rate(sum(up))` is automatically converted to `rate((sum(default_rollup(up)))[1i:1i])`.
|
||||
This behavior can be disabled or logged via `-search.disableImplicitConversion` and `-search.logImplicitConversion` command-line flags
|
||||
starting from [`v1.101.0` release](https://docs.victoriametrics.com/changelog/).
|
||||
starting from [`v1.102.0-rc2` release](https://docs.victoriametrics.com/changelog/changelog_2024/#v11020-rc2).
|
||||
|
||||
@@ -9,7 +9,7 @@ export const useDebugDownsamplingFilters = () => {
|
||||
const { serverUrl } = useAppState();
|
||||
const [searchParams, setSearchParams] = useSearchParams();
|
||||
|
||||
const [data, setData] = useState<Map<string, string[]>>(new Map());
|
||||
const [data, setData] = useState<Map<string, string[] | null>>(new Map());
|
||||
const [loading, setLoading] = useState(false);
|
||||
const [metricsError, setMetricsError] = useState<ErrorTypes | string>();
|
||||
const [flagsError, setFlagsError] = useState<ErrorTypes | string>();
|
||||
|
||||
@@ -7,6 +7,7 @@ import { PlayIcon, WikiIcon } from "../../components/Main/Icons";
|
||||
import { useDebugDownsamplingFilters } from "./hooks/useDebugDownsamplingFilters";
|
||||
import Spinner from "../../components/Main/Spinner/Spinner";
|
||||
import { useSearchParams } from "react-router-dom";
|
||||
import classNames from "classnames";
|
||||
|
||||
const example = {
|
||||
flags: `-downsampling.period={env="dev"}:7d:5m,{env="dev"}:30d:30m
|
||||
@@ -54,7 +55,14 @@ const DownsamplingFilters: FC = () => {
|
||||
for (const [key, value] of data) {
|
||||
rows.push(<tr className="vm-table__row">
|
||||
<td className="vm-table-cell">{key}</td>
|
||||
<td className="vm-table-cell">{value.join(" ")}</td>
|
||||
<td
|
||||
className={classNames({
|
||||
"vm-table-cell": true,
|
||||
"vm-table-cell_empty": !value,
|
||||
})}
|
||||
>
|
||||
{value ? value.join(" ") : "No matching rules found!"}
|
||||
</td>
|
||||
</tr>);
|
||||
}
|
||||
return (
|
||||
|
||||
@@ -94,6 +94,11 @@
|
||||
white-space: nowrap;
|
||||
width: 100px;
|
||||
}
|
||||
|
||||
&_empty {
|
||||
color: $color-text-secondary;
|
||||
font-style: italic;
|
||||
}
|
||||
}
|
||||
|
||||
&__sort-icon {
|
||||
|
||||
@@ -258,3 +258,15 @@ func (t *Trace) Contains(s string) int {
|
||||
}
|
||||
return times
|
||||
}
|
||||
|
||||
// MetricNamesStatsResponse is an inmemory representation of the
|
||||
// /api/v1/status/metric_names_stats API response
|
||||
type MetricNamesStatsResponse struct {
|
||||
Records []MetricNamesStatsRecord
|
||||
}
|
||||
|
||||
// MetricNamesStatsRecord is a record item for MetricNamesStatsResponse
|
||||
type MetricNamesStatsRecord struct {
|
||||
MetricName string
|
||||
QueryRequestsCount uint64
|
||||
}
|
||||
|
||||
200
apptest/tests/metric_names_stats_test.go
Normal file
200
apptest/tests/metric_names_stats_test.go
Normal file
@@ -0,0 +1,200 @@
|
||||
package tests
|
||||
|
||||
import (
|
||||
"fmt"
|
||||
"os"
|
||||
"testing"
|
||||
|
||||
"github.com/google/go-cmp/cmp"
|
||||
|
||||
"github.com/VictoriaMetrics/VictoriaMetrics/apptest"
|
||||
at "github.com/VictoriaMetrics/VictoriaMetrics/apptest"
|
||||
)
|
||||
|
||||
func TestSingleMetricNamesStats(t *testing.T) {
|
||||
os.RemoveAll(t.Name())
|
||||
tc := at.NewTestCase(t)
|
||||
defer tc.Stop()
|
||||
sut := tc.MustStartVmsingle("vmsingle", []string{"-storage.trackMetricNamesStats=true", "-retentionPeriod=100y"})
|
||||
|
||||
const ingestDateTime = `2024-02-05T08:57:36.700Z`
|
||||
const ingestTimestamp = ` 1707123456700`
|
||||
dataSet := []string{
|
||||
`metric_name_1{label="foo"} 10`,
|
||||
`metric_name_1{label="bar"} 10`,
|
||||
`metric_name_2{label="baz"} 20`,
|
||||
`metric_name_1{label="baz"} 10`,
|
||||
`metric_name_3{label="baz"} 30`,
|
||||
}
|
||||
for idx := range dataSet {
|
||||
dataSet[idx] += ingestTimestamp
|
||||
}
|
||||
|
||||
sut.PrometheusAPIV1ImportPrometheus(t, dataSet, at.QueryOpts{})
|
||||
sut.ForceFlush(t)
|
||||
|
||||
// verify ingest request correctly registered
|
||||
expected := apptest.MetricNamesStatsResponse{
|
||||
Records: []at.MetricNamesStatsRecord{
|
||||
{MetricName: "metric_name_1"},
|
||||
{MetricName: "metric_name_2"},
|
||||
{MetricName: "metric_name_3"},
|
||||
},
|
||||
}
|
||||
got := sut.APIV1StatusMetricNamesStats(t, "", "", "", at.QueryOpts{})
|
||||
if diff := cmp.Diff(expected, got); diff != "" {
|
||||
t.Errorf("unexpected response (-want, +got):\n%s", diff)
|
||||
}
|
||||
|
||||
// verify query request correctly registered
|
||||
sut.PrometheusAPIV1Query(t, `{__name__!=""}`, at.QueryOpts{Time: ingestDateTime})
|
||||
expected = apptest.MetricNamesStatsResponse{
|
||||
Records: []at.MetricNamesStatsRecord{
|
||||
{MetricName: "metric_name_1", QueryRequestsCount: 3},
|
||||
{MetricName: "metric_name_2", QueryRequestsCount: 1},
|
||||
{MetricName: "metric_name_3", QueryRequestsCount: 1},
|
||||
},
|
||||
}
|
||||
got = sut.APIV1StatusMetricNamesStats(t, "", "", "", at.QueryOpts{})
|
||||
if diff := cmp.Diff(expected, got); diff != "" {
|
||||
t.Errorf("unexpected response (-want, +got):\n%s", diff)
|
||||
}
|
||||
|
||||
// perform query request for single metric and check counter increase
|
||||
sut.PrometheusAPIV1Query(t, `metric_name_2`, at.QueryOpts{Time: ingestDateTime})
|
||||
expected = apptest.MetricNamesStatsResponse{
|
||||
Records: []at.MetricNamesStatsRecord{
|
||||
{MetricName: "metric_name_1", QueryRequestsCount: 3},
|
||||
{MetricName: "metric_name_2", QueryRequestsCount: 2},
|
||||
{MetricName: "metric_name_3", QueryRequestsCount: 1},
|
||||
},
|
||||
}
|
||||
got = sut.APIV1StatusMetricNamesStats(t, "", "", "", at.QueryOpts{})
|
||||
if diff := cmp.Diff(expected, got); diff != "" {
|
||||
t.Errorf("unexpected response (-want, +got):\n%s", diff)
|
||||
}
|
||||
|
||||
// verify le filter
|
||||
expected = apptest.MetricNamesStatsResponse{
|
||||
Records: []at.MetricNamesStatsRecord{
|
||||
{MetricName: "metric_name_2", QueryRequestsCount: 2},
|
||||
{MetricName: "metric_name_3", QueryRequestsCount: 1},
|
||||
},
|
||||
}
|
||||
got = sut.APIV1StatusMetricNamesStats(t, "", "2", "", at.QueryOpts{})
|
||||
if diff := cmp.Diff(expected, got); diff != "" {
|
||||
t.Errorf("unexpected response (-want, +got):\n%s", diff)
|
||||
}
|
||||
|
||||
// reset state and check empty request response
|
||||
sut.APIV1AdminStatusMetricNamesStatsReset(t, at.QueryOpts{})
|
||||
expected = apptest.MetricNamesStatsResponse{
|
||||
Records: []at.MetricNamesStatsRecord{},
|
||||
}
|
||||
got = sut.APIV1StatusMetricNamesStats(t, "", "", "", at.QueryOpts{})
|
||||
if diff := cmp.Diff(expected, got); diff != "" {
|
||||
t.Errorf("unexpected response (-want, +got):\n%s", diff)
|
||||
}
|
||||
|
||||
}
|
||||
|
||||
func TestClusterMetricNamesStats(t *testing.T) {
|
||||
|
||||
os.RemoveAll(t.Name())
|
||||
|
||||
tc := apptest.NewTestCase(t)
|
||||
defer tc.Stop()
|
||||
vmstorage1 := tc.MustStartVmstorage("vmstorage-1", []string{
|
||||
"-storageDataPath=" + tc.Dir() + "/vmstorage-1",
|
||||
"-retentionPeriod=100y",
|
||||
"-storage.trackMetricNamesStats",
|
||||
})
|
||||
vmstorage2 := tc.MustStartVmstorage("vmstorage-2", []string{
|
||||
"-storageDataPath=" + tc.Dir() + "/vmstorage-2",
|
||||
"-retentionPeriod=100y",
|
||||
"-storage.trackMetricNamesStats",
|
||||
})
|
||||
|
||||
vminsert := tc.MustStartVminsert("vminsert", []string{
|
||||
fmt.Sprintf("-storageNode=%s,%s", vmstorage1.VminsertAddr(), vmstorage2.VminsertAddr()),
|
||||
})
|
||||
vmselect := tc.MustStartVmselect("vmselect", []string{
|
||||
fmt.Sprintf("-storageNode=%s,%s", vmstorage1.VmselectAddr(), vmstorage2.VmselectAddr()),
|
||||
})
|
||||
// verify empty stats
|
||||
resp := vmselect.MetricNamesStats(t, "", "", "", apptest.QueryOpts{Tenant: "0:0"})
|
||||
if len(resp.Records) != 0 {
|
||||
t.Fatalf("unexpected resp Records: %d, want: %d", len(resp.Records), 0)
|
||||
}
|
||||
|
||||
const ingestDateTime = `2024-02-05T08:57:36.700Z`
|
||||
const ingestTimestamp = ` 1707123456700`
|
||||
dataSet := []string{
|
||||
`metric_name_1{label="foo"} 10`,
|
||||
`metric_name_1{label="bar"} 10`,
|
||||
`metric_name_2{label="baz"} 20`,
|
||||
`metric_name_1{label="baz"} 10`,
|
||||
`metric_name_3{label="baz"} 30`,
|
||||
}
|
||||
for idx := range dataSet {
|
||||
dataSet[idx] += ingestTimestamp
|
||||
}
|
||||
|
||||
// ingest per tenant data and verify it with search
|
||||
tenantIDs := []string{"1:1", "1:15", "15:15"}
|
||||
for _, tenantID := range tenantIDs {
|
||||
vminsert.PrometheusAPIV1ImportPrometheus(t, dataSet, apptest.QueryOpts{Tenant: tenantID})
|
||||
vmstorage1.ForceFlush(t)
|
||||
vmstorage2.ForceFlush(t)
|
||||
|
||||
// verify ingest request correctly registered
|
||||
expected := apptest.MetricNamesStatsResponse{
|
||||
Records: []at.MetricNamesStatsRecord{
|
||||
{MetricName: "metric_name_1"},
|
||||
{MetricName: "metric_name_2"},
|
||||
{MetricName: "metric_name_3"},
|
||||
},
|
||||
}
|
||||
gotStats := vmselect.MetricNamesStats(t, "", "", "", apptest.QueryOpts{Tenant: tenantID})
|
||||
if diff := cmp.Diff(expected, gotStats); diff != "" {
|
||||
t.Errorf("unexpected response (-want, +got):\n%s", diff)
|
||||
}
|
||||
|
||||
// verify query request registered correctly
|
||||
vmselect.PrometheusAPIV1Query(t, `{__name__!=""}`, apptest.QueryOpts{
|
||||
Tenant: tenantID, Time: ingestDateTime,
|
||||
})
|
||||
|
||||
expected = apptest.MetricNamesStatsResponse{
|
||||
Records: []at.MetricNamesStatsRecord{
|
||||
{MetricName: "metric_name_2", QueryRequestsCount: 1},
|
||||
{MetricName: "metric_name_3", QueryRequestsCount: 1},
|
||||
{MetricName: "metric_name_1", QueryRequestsCount: 3},
|
||||
},
|
||||
}
|
||||
gotStats = vmselect.MetricNamesStats(t, "", "", "", apptest.QueryOpts{Tenant: tenantID})
|
||||
if diff := cmp.Diff(expected, gotStats); diff != "" {
|
||||
t.Errorf("unexpected response tenant: %s (-want, +got):\n%s", tenantID, diff)
|
||||
}
|
||||
}
|
||||
|
||||
// verify multitenant stats
|
||||
expected := apptest.MetricNamesStatsResponse{
|
||||
Records: []at.MetricNamesStatsRecord{
|
||||
{MetricName: "metric_name_2", QueryRequestsCount: 3},
|
||||
{MetricName: "metric_name_3", QueryRequestsCount: 3},
|
||||
{MetricName: "metric_name_1", QueryRequestsCount: 9},
|
||||
},
|
||||
}
|
||||
gotStats := vmselect.MetricNamesStats(t, "", "", "", apptest.QueryOpts{Tenant: "multitenant"})
|
||||
if diff := cmp.Diff(expected, gotStats); diff != "" {
|
||||
t.Errorf("unexpected response (-want, +got):\n%s", diff)
|
||||
}
|
||||
|
||||
// reset cache and check empty state
|
||||
vmselect.MetricNamesStatsReset(t, at.QueryOpts{})
|
||||
resp = vmselect.MetricNamesStats(t, "", "", "", apptest.QueryOpts{Tenant: "multitenant"})
|
||||
if len(resp.Records) != 0 {
|
||||
t.Fatalf("want 0 records, got: %d", len(resp.Records))
|
||||
}
|
||||
}
|
||||
@@ -2,14 +2,16 @@ package tests
|
||||
|
||||
import (
|
||||
"fmt"
|
||||
"strings"
|
||||
"testing"
|
||||
"time"
|
||||
|
||||
"github.com/google/go-cmp/cmp"
|
||||
"github.com/google/go-cmp/cmp/cmpopts"
|
||||
|
||||
"github.com/VictoriaMetrics/VictoriaMetrics/apptest"
|
||||
"github.com/VictoriaMetrics/VictoriaMetrics/lib/decimal"
|
||||
pb "github.com/VictoriaMetrics/VictoriaMetrics/lib/prompbmarshal"
|
||||
"github.com/google/go-cmp/cmp"
|
||||
"github.com/google/go-cmp/cmp/cmpopts"
|
||||
)
|
||||
|
||||
func millis(s string) int64 {
|
||||
@@ -28,6 +30,8 @@ func TestSingleInstantQuery(t *testing.T) {
|
||||
|
||||
testInstantQueryWithUTFNames(t, sut)
|
||||
testInstantQueryDoesNotReturnStaleNaNs(t, sut)
|
||||
|
||||
testQueryRangeWithAtModifier(t, sut)
|
||||
}
|
||||
|
||||
func TestClusterInstantQuery(t *testing.T) {
|
||||
@@ -38,6 +42,8 @@ func TestClusterInstantQuery(t *testing.T) {
|
||||
|
||||
testInstantQueryWithUTFNames(t, sut)
|
||||
testInstantQueryDoesNotReturnStaleNaNs(t, sut)
|
||||
|
||||
testQueryRangeWithAtModifier(t, sut)
|
||||
}
|
||||
|
||||
func testInstantQueryWithUTFNames(t *testing.T, sut apptest.PrometheusWriteQuerier) {
|
||||
@@ -173,3 +179,54 @@ func testInstantQueryDoesNotReturnStaleNaNs(t *testing.T, sut apptest.Prometheus
|
||||
t.Errorf("unexpected response (-want, +got):\n%s", diff)
|
||||
}
|
||||
}
|
||||
|
||||
// This test checks absence of panic after conversion of math.NaN to int64 in vmselect.
|
||||
// See: https://github.com/VictoriaMetrics/VictoriaMetrics/issues/8444
|
||||
// However, conversion of math.NaN to int64 could behave differently depending on platform and Go version.
|
||||
// Hence, this test could succeed for some platforms even if fix is rolled back.
|
||||
func testQueryRangeWithAtModifier(t *testing.T, sut apptest.PrometheusWriteQuerier) {
|
||||
data := []pb.TimeSeries{
|
||||
{
|
||||
Labels: []pb.Label{
|
||||
{Name: "__name__", Value: "up"},
|
||||
},
|
||||
Samples: []pb.Sample{
|
||||
{Value: 1, Timestamp: millis("2025-01-01T00:01:00Z")},
|
||||
},
|
||||
},
|
||||
{
|
||||
Labels: []pb.Label{
|
||||
{Name: "__name__", Value: "metricNaN"},
|
||||
},
|
||||
Samples: []pb.Sample{
|
||||
{Value: decimal.StaleNaN, Timestamp: millis("2025-01-01T00:01:00Z")},
|
||||
},
|
||||
},
|
||||
}
|
||||
|
||||
sut.PrometheusAPIV1Write(t, data, apptest.QueryOpts{})
|
||||
sut.ForceFlush(t)
|
||||
|
||||
resp := sut.PrometheusAPIV1QueryRange(t, `vector(1) @ up`, apptest.QueryOpts{
|
||||
Start: "2025-01-01T00:00:00Z",
|
||||
End: "2025-01-01T00:02:00Z",
|
||||
Step: "10s",
|
||||
})
|
||||
|
||||
if resp.Status != "success" {
|
||||
t.Fatalf("unexpected status: %q", resp.Status)
|
||||
}
|
||||
|
||||
resp = sut.PrometheusAPIV1QueryRange(t, `vector(1) @ metricNaN`, apptest.QueryOpts{
|
||||
Start: "2025-01-01T00:00:00Z",
|
||||
End: "2025-01-01T00:02:00Z",
|
||||
Step: "10s",
|
||||
})
|
||||
|
||||
if resp.Status != "error" {
|
||||
t.Fatalf("unexpected status: %q", resp.Status)
|
||||
}
|
||||
if !strings.Contains(resp.Error, "modifier must return a non-NaN value") {
|
||||
t.Fatalf("unexpected error: %q", resp.Error)
|
||||
}
|
||||
}
|
||||
|
||||
@@ -1,7 +1,9 @@
|
||||
package apptest
|
||||
|
||||
import (
|
||||
"encoding/json"
|
||||
"fmt"
|
||||
"net/http"
|
||||
"regexp"
|
||||
"testing"
|
||||
)
|
||||
@@ -133,6 +135,45 @@ func (app *Vmselect) DeleteSeries(t *testing.T, matchQuery string, opts QueryOpt
|
||||
}
|
||||
}
|
||||
|
||||
// MetricNamesStats sends a query to a /select/tenant/prometheus/api/v1/status/metric_names_stats endpoint
|
||||
// and returns the statistics response for given params.
|
||||
//
|
||||
// See https://docs.victoriametrics.com/#Trackingestedmetricsusage
|
||||
func (app *Vmselect) MetricNamesStats(t *testing.T, limit, le, matchPattern string, opts QueryOpts) MetricNamesStatsResponse {
|
||||
t.Helper()
|
||||
|
||||
values := opts.asURLValues()
|
||||
values.Add("limit", limit)
|
||||
values.Add("le", le)
|
||||
values.Add("match_pattern", matchPattern)
|
||||
queryURL := fmt.Sprintf("http://%s/select/%s/prometheus/api/v1/status/metric_names_stats", app.httpListenAddr, opts.getTenant())
|
||||
|
||||
res, statusCode := app.cli.PostForm(t, queryURL, values)
|
||||
if statusCode != http.StatusOK {
|
||||
t.Fatalf("unexpected status code: got %d, want %d, resp text=%q", statusCode, http.StatusOK, res)
|
||||
}
|
||||
var resp MetricNamesStatsResponse
|
||||
if err := json.Unmarshal([]byte(res), &resp); err != nil {
|
||||
t.Fatalf("could not unmarshal series response data:\n%s\n err: %v", res, err)
|
||||
}
|
||||
return resp
|
||||
}
|
||||
|
||||
// MetricNamesStatsReset sends a query to a /admin/api/v1/status/metric_names_stats/reset endpoint
|
||||
//
|
||||
// See https://docs.victoriametrics.com/#Trackingestedmetricsusage
|
||||
func (app *Vmselect) MetricNamesStatsReset(t *testing.T, opts QueryOpts) {
|
||||
t.Helper()
|
||||
|
||||
values := opts.asURLValues()
|
||||
queryURL := fmt.Sprintf("http://%s/admin/api/v1/admin/status/metric_names_stats/reset", app.httpListenAddr)
|
||||
|
||||
res, statusCode := app.cli.PostForm(t, queryURL, values)
|
||||
if statusCode != http.StatusNoContent {
|
||||
t.Fatalf("unexpected status code: got %d, want %d, resp text=%q", statusCode, http.StatusNoContent, res)
|
||||
}
|
||||
}
|
||||
|
||||
// String returns the string representation of the vmselect app state.
|
||||
func (app *Vmselect) String() string {
|
||||
return fmt.Sprintf("{app: %s httpListenAddr: %q}", app.app, app.httpListenAddr)
|
||||
|
||||
@@ -1,6 +1,7 @@
|
||||
package apptest
|
||||
|
||||
import (
|
||||
"encoding/json"
|
||||
"fmt"
|
||||
"net/http"
|
||||
"os"
|
||||
@@ -188,6 +189,45 @@ func (app *Vmsingle) PrometheusAPIV1Series(t *testing.T, matchQuery string, opts
|
||||
return NewPrometheusAPIV1SeriesResponse(t, res)
|
||||
}
|
||||
|
||||
// APIV1StatusMetricNamesStats sends a query to a /api/v1/status/metric_names_stats endpoint
|
||||
// and returns the statistics response for given params.
|
||||
//
|
||||
// See https://docs.victoriametrics.com/#track-ingested-metrics-usage
|
||||
func (app *Vmsingle) APIV1StatusMetricNamesStats(t *testing.T, limit, le, matchPattern string, opts QueryOpts) MetricNamesStatsResponse {
|
||||
t.Helper()
|
||||
|
||||
values := opts.asURLValues()
|
||||
values.Add("limit", limit)
|
||||
values.Add("le", le)
|
||||
values.Add("match_pattern", matchPattern)
|
||||
queryURL := fmt.Sprintf("http://%s/api/v1/status/metric_names_stats", app.httpListenAddr)
|
||||
|
||||
res, statusCode := app.cli.PostForm(t, queryURL, values)
|
||||
if statusCode != http.StatusOK {
|
||||
t.Fatalf("unexpected status code: got %d, want %d, resp text=%q", statusCode, http.StatusOK, res)
|
||||
}
|
||||
var resp MetricNamesStatsResponse
|
||||
if err := json.Unmarshal([]byte(res), &resp); err != nil {
|
||||
t.Fatalf("could not unmarshal metric names stats response data:\n%s\n err: %v", res, err)
|
||||
}
|
||||
return resp
|
||||
}
|
||||
|
||||
// APIV1AdminStatusMetricNamesStatsReset sends a query to a /api/v1/admin/status/metric_names_stats/reset endpoint
|
||||
//
|
||||
// See https://docs.victoriametrics.com/#Trackingestedmetricsusage
|
||||
func (app *Vmsingle) APIV1AdminStatusMetricNamesStatsReset(t *testing.T, opts QueryOpts) {
|
||||
t.Helper()
|
||||
|
||||
values := opts.asURLValues()
|
||||
queryURL := fmt.Sprintf("http://%s/api/v1/admin/status/metric_names_stats/reset", app.httpListenAddr)
|
||||
|
||||
res, statusCode := app.cli.PostForm(t, queryURL, values)
|
||||
if statusCode != http.StatusNoContent {
|
||||
t.Fatalf("unexpected status code: got %d, want %d, resp text=%q", statusCode, http.StatusNoContent, res)
|
||||
}
|
||||
}
|
||||
|
||||
// String returns the string representation of the vmsingle app state.
|
||||
func (app *Vmsingle) String() string {
|
||||
return fmt.Sprintf("{app: %s storageDataPath: %q httpListenAddr: %q}", []any{
|
||||
|
||||
@@ -72,7 +72,7 @@ services:
|
||||
restart: always
|
||||
vmanomaly:
|
||||
container_name: vmanomaly
|
||||
image: victoriametrics/vmanomaly:v1.19.2
|
||||
image: victoriametrics/vmanomaly:v1.20.0
|
||||
depends_on:
|
||||
- "victoriametrics"
|
||||
ports:
|
||||
|
||||
@@ -1264,6 +1264,11 @@ Below is the output for `/path/to/vminsert -help`:
|
||||
Supports the following optional suffixes for size values: KB, MB, GB, TB, KiB, MiB, GiB, TiB (default 0)
|
||||
-memory.allowedPercent float
|
||||
Allowed percent of system memory VictoriaMetrics caches may occupy. See also -memory.allowedBytes. Too low a value may increase cache miss rate usually resulting in higher CPU and disk IO usage. Too high a value may evict too much data from the OS page cache which will result in higher disk IO usage (default 60)
|
||||
-metricNamesStatsResetAuthKey value
|
||||
AuthKey for reseting metric names usage cache via /api/v1/admin/status/metric_names_stats/reset. It overrides -httpAuth.*
|
||||
See https://docs.victoriametrics.com/#track-ingested-metrics-usage
|
||||
Flag value can be read from the given file when using -metricNamesStatsResetAuthKey=file:///abs/path/to/file or -metricNamesStatsResetAuthKey=file://./relative/path/to/file . Flag value can be read from the given http/https
|
||||
url when using -metricNamesStatsResetAuthKey=http://host/path or -metricNamesStatsResetAuthKey=https://host/path
|
||||
-metrics.exposeMetadata
|
||||
Whether to expose TYPE and HELP metadata at the /metrics page, which is exposed at -httpListenAddr . The metadata may be needed when the /metrics page is consumed by systems, which require this information. For example, Managed Prometheus in Google Cloud - https://cloud.google.com/stackdriver/docs/managed-prometheus/troubleshooting#missing-metric-type
|
||||
-metricsAuthKey value
|
||||
@@ -1936,6 +1941,9 @@ Below is the output for `/path/to/vmstorage -help`:
|
||||
-storage.cacheSizeIndexDBTagFilters size
|
||||
Overrides max size for indexdb/tagFiltersToMetricIDs cache. See https://docs.victoriametrics.com/single-server-victoriametrics/#cache-tuning
|
||||
Supports the following optional suffixes for size values: KB, MB, GB, TB, KiB, MiB, GiB, TiB (default 0)
|
||||
-storage.cacheSizeMetricNamesStats size
|
||||
Overrides max size for storage/metricNamesStatsTracker cache. See https://docs.victoriametrics.com/single-server-victoriametrics/#cache-tuning
|
||||
Supports the following optional suffixes for size values: KB, MB, GB, TB, KiB, MiB, GiB, TiB (default 0)
|
||||
-storage.cacheSizeStorageTSID size
|
||||
Overrides max size for storage/tsid cache. See https://docs.victoriametrics.com/single-server-victoriametrics/#cache-tuning
|
||||
Supports the following optional suffixes for size values: KB, MB, GB, TB, KiB, MiB, GiB, TiB (default 0)
|
||||
@@ -1950,6 +1958,9 @@ Below is the output for `/path/to/vmstorage -help`:
|
||||
-storage.minFreeDiskSpaceBytes size
|
||||
The minimum free disk space at -storageDataPath after which the storage stops accepting new data
|
||||
Supports the following optional suffixes for size values: KB, MB, GB, TB, KiB, MiB, GiB, TiB (default 10000000)
|
||||
-storage.trackMetricNamesStats
|
||||
Whether to track ingest and query requests for timeseries metric names. This feature allows to track metric names unused at query requests.
|
||||
See https://docs.victoriametrics.com/#track-ingested-metrics-usage
|
||||
-storage.vminsertConnsShutdownDuration duration
|
||||
The time needed for gradual closing of vminsert connections during graceful shutdown. Bigger duration reduces spikes in CPU, RAM and disk IO load on the remaining vmstorage nodes during rolling restart. Smaller duration reduces the time needed to close all the vminsert connections, thus reducing the time for graceful shutdown. See https://docs.victoriametrics.com/cluster-victoriametrics/#improving-re-routing-performance-during-restart (default 25s)
|
||||
-storageDataPath string
|
||||
|
||||
@@ -461,6 +461,58 @@ vmselect requests stats via [/api/v1/status/tsdb](#tsdb-stats) API from each vms
|
||||
This may lead to inflated values when samples for the same time series are spread across multiple vmstorage nodes
|
||||
due to [replication](#replication) or [rerouting](https://docs.victoriametrics.com/cluster-victoriametrics/?highlight=re-routes#cluster-availability).
|
||||
|
||||
### Track ingested metrics usage
|
||||
|
||||
VictoriaMetrics provides the ability to record statistics of fetched [metric names](https://docs.victoriametrics.com/keyconcepts/#structure-of-a-metric) during [querying](https://docs.victoriametrics.com/keyconcepts/#query-data). This feature can be enabled via the flag `--storage.trackMetricNamesStats` (disabled by default) on a single-node VictoriaMetrics or [vmstorage](https://docs.victoriametrics.com/cluster-victoriametrics/#architecture-overview). Querying a metric with non-matching filters doesn't increase the counter for this particular metric name.
|
||||
For example, querying for `vm_log_messages_total{level!="info"}` won't increment usage counter for `vm_log_messages_total` if there are no `{level="error"}` or `{level="warning"}` series yet.
|
||||
VictoriaMetrics tracks metric names query statistics for `/api/v1/query`, `/api/v1/query_range`, `/render`, `/federate` and `/api/v1/export` API calls.
|
||||
|
||||
To get metric names usage statistics, use the `/prometheus/api/v1/status/metric_names_stats` API endpoint. It accepts the following query parameters:
|
||||
|
||||
* `limit` - integer value to limit the number of metric names in response. By default, API returns 1000 records.
|
||||
* `le` - `less than or equal`, is an integer threshold for filtering metric names by their usage count in queries. For example, with `?le=1` API returns metric names that were queried <=1 times.
|
||||
* `match_pattern` - a substring pattern to match metric names. For example, `?match_pattern=vm_` will match any metric names with `vm_` pattern, like `vm_http_requests`, `max_vm_memory_available`. It doesn't support regex syntax.
|
||||
|
||||
The API endpoint returns the following `JSON` response:
|
||||
|
||||
```json
|
||||
{
|
||||
"status": "success",
|
||||
"statsSollectedSince": 1737534094,
|
||||
"statsCollectedRecordsTotal": 2,
|
||||
"records": [
|
||||
{
|
||||
"metricName": "node_disk_writes_completed_total",
|
||||
"queryRequests": 50,
|
||||
"lastRequestTimestamp": 1737534262
|
||||
},
|
||||
{
|
||||
"metricName": "node_network_transmit_errs_total",
|
||||
"queryRequestsCount": 100,
|
||||
"lastRequestTimestamp": 1737534262
|
||||
}
|
||||
]
|
||||
}
|
||||
```
|
||||
|
||||
VictoriaMetrics stores tracked metric names in memory and saves the state to disk in the data/cache folder during restarts.
|
||||
The size of the in-memory state is limited to 1% of the available memory by default.
|
||||
This limit can be adjusted using the `-storage.cacheSizeMetricNamesStats` flag.
|
||||
|
||||
When the maximum state capacity is reached, VictoriaMetrics will stop tracking stats for newly registered time series.
|
||||
However, read request statistics for already tracked time series will continue to work as expected.
|
||||
|
||||
VictoriaMetrics exposes the following metrics for the metric name tracker:
|
||||
* vm_cache_size_bytes{type="storage/metricNamesStatsTracker"}
|
||||
* vm_cache_size{type="storage/metricNamesStatsTracker"}
|
||||
* vm_cache_size_max_bytes{type="storage/metricNamesStatsTracker"}
|
||||
|
||||
|
||||
An alerting rule with query `vm_cache_size_bytes{type="storage/metricNamesStatsTracker"} \ vm_cache_size_max_bytes{type="storage/metricNamesStatsTracker"} > 0.9` can be used to notify the user of cache utilization exceeding 90%.
|
||||
|
||||
The metric name tracker state can be reset via the API endpoint /api/v1/admin/status/metric_names_stats/reset or
|
||||
via [cache removal](#cache-removal) procedure.
|
||||
|
||||
## How to apply new config to VictoriaMetrics
|
||||
|
||||
VictoriaMetrics is configured via command-line flags, so it must be restarted when new command-line flags should be applied:
|
||||
@@ -3209,6 +3261,11 @@ Pass `-help` to VictoriaMetrics in order to see the list of supported command-li
|
||||
-reloadAuthKey value
|
||||
Auth key for /-/reload http endpoint. It must be passed via authKey query arg. It overrides -httpAuth.*
|
||||
Flag value can be read from the given file when using -reloadAuthKey=file:///abs/path/to/file or -reloadAuthKey=file://./relative/path/to/file . Flag value can be read from the given http/https url when using -reloadAuthKey=http://host/path or -reloadAuthKey=https://host/path
|
||||
-metricNamesStatsResetAuthKey value
|
||||
AuthKey for reseting metric names usage cache via /api/v1/admin/status/metric_names_stats/reset. It overrides -httpAuth.*
|
||||
See https://docs.victoriametrics.com/#track-ingested-metrics-usage
|
||||
Flag value can be read from the given file when using -metricNamesStatsResetAuthKey=file:///abs/path/to/file or -metricNamesStatsResetAuthKey=file://./relative/path/to/file . Flag value can be read from the given http/https
|
||||
url when using -metricNamesStatsResetAuthKey=http://host/path or -metricNamesStatsResetAuthKey=https://host/path
|
||||
-retentionFilter array
|
||||
Retention filter in the format 'filter:retention'. For example, '{env="dev"}:3d' configures the retention for time series with env="dev" label to 3 days. See https://docs.victoriametrics.com/#retention-filters for details. This flag is available only in VictoriaMetrics enterprise. See https://docs.victoriametrics.com/enterprise/
|
||||
Supports an array of values separated by comma or specified via multiple flags.
|
||||
@@ -3357,6 +3414,9 @@ Pass `-help` to VictoriaMetrics in order to see the list of supported command-li
|
||||
-storage.cacheSizeIndexDBTagFilters size
|
||||
Overrides max size for indexdb/tagFiltersToMetricIDs cache. See https://docs.victoriametrics.com/single-server-victoriametrics/#cache-tuning
|
||||
Supports the following optional suffixes for size values: KB, MB, GB, TB, KiB, MiB, GiB, TiB (default 0)
|
||||
-storage.cacheSizeMetricNamesStats size
|
||||
Overrides max size for storage/metricNamesStatsTracker cache. See https://docs.victoriametrics.com/single-server-victoriametrics/#cache-tuning
|
||||
Supports the following optional suffixes for size values: KB, MB, GB, TB, KiB, MiB, GiB, TiB (default 0)
|
||||
-storage.cacheSizeStorageTSID size
|
||||
Overrides max size for storage/tsid cache. See https://docs.victoriametrics.com/single-server-victoriametrics/#cache-tuning
|
||||
Supports the following optional suffixes for size values: KB, MB, GB, TB, KiB, MiB, GiB, TiB (default 0)
|
||||
@@ -3371,6 +3431,9 @@ Pass `-help` to VictoriaMetrics in order to see the list of supported command-li
|
||||
-storage.minFreeDiskSpaceBytes size
|
||||
The minimum free disk space at -storageDataPath after which the storage stops accepting new data
|
||||
Supports the following optional suffixes for size values: KB, MB, GB, TB, KiB, MiB, GiB, TiB (default 10000000)
|
||||
-storage.trackMetricNamesStats
|
||||
Whether to track ingest and query requests for timeseries metric names. This feature allows to track metric names unused at query requests.
|
||||
See https://docs.victoriametrics.com/#track-ingested-metrics-usage
|
||||
-storageDataPath string
|
||||
Path to storage data (default "victoria-metrics-data")
|
||||
-streamAggr.config string
|
||||
|
||||
@@ -22,12 +22,13 @@ Released at 2025-02-27
|
||||
|
||||
* FEATURE: [`pack_json` pipe](https://docs.victoriametrics.com/victorialogs/logsql/#pack_json-pipe): allow packing fields, which start with the given prefixes. For example, `pack_json fields (foo.*, bar.*)` creates a JSON containing all the fields, which start with either `foo.` or `bar.`.
|
||||
* FEATURE: [`pack_logfmt` pipe](https://docs.victoriametrics.com/victorialogs/logsql/#pack_logfmt-pipe): allow packing fields, which start with the given prefixes. For example, `pack_logfmt fields (foo.*, bar.*)` creates [logfmt](https://brandur.org/logfmt) message containing all the fields, which start with either `foo.` or `bar.`.
|
||||
* FEATURE: expose `vl_request_duration_seconds` [summaries](https://docs.victoriametrics.com/keyconcepts/#summary) for [select APIs](https://docs.victoriametrics.com/victorialogs/querying/#http-api) at the [/metrics](https://docs.victoriametrics.com/victorialogs/#monitoring) page.
|
||||
* FEATURE: expose `vl_http_request_duration_seconds` [summaries](https://docs.victoriametrics.com/keyconcepts/#summary) for [select APIs](https://docs.victoriametrics.com/victorialogs/querying/#http-api) at the [/metrics](https://docs.victoriametrics.com/victorialogs/#monitoring) page.
|
||||
* FEATURE: allow passing `*` as a subquery inside [`in(*)`, `contains_any(*)` and `contains_all(*)` filters](https://docs.victoriametrics.com/victorialogs/logsql/#subquery-filter). Such filters are treated as `match all` aka `*`. This is going to be used by [Grafana plugin for VictoriaLogs](https://docs.victoriametrics.com/victorialogs/victorialogs-datasource/). See [this issue](https://github.com/VictoriaMetrics/victorialogs-datasource/issues/238#issuecomment-2685447673).
|
||||
* FEATURE: [victorialogs dashboard](https://grafana.com/grafana/dashboards/22084-victorialogs/): add panels to display amount of ingested logs in bytes, latency of [select APIs](https://docs.victoriametrics.com/victorialogs/querying/#http-api) calls, troubleshooting panels.
|
||||
* FEATURE: provide alternative registry for all VictoriaLogs components at [Quay.io](https://quay.io/organization/victoriametrics): [VictoriaLogs](https://quay.io/repository/victoriametrics/victoria-logs?tab=tags) and [vlogscli](https://quay.io/repository/victoriametrics/vlogscli?tab=tags).
|
||||
|
||||
* BUGFIX: do not treat a string containing leading zeros as a number during data ingestion and querying. For example, `00123` string shouldn't be treated as `123` number. See [this issue](https://github.com/VictoriaMetrics/VictoriaMetrics/issues/8361).
|
||||
* BUGFIX: [data ingestion](https://docs.victoriametrics.com/victorialogs/data-ingestion/): Properly convert nested OpenTelemetry attributes into JSON. See [this issue](https://github.com/VictoriaMetrics/VictoriaMetrics/issues/8384).
|
||||
|
||||
## [v1.14.0](https://github.com/VictoriaMetrics/VictoriaMetrics/releases/tag/v1.14.0-victorialogs)
|
||||
|
||||
|
||||
@@ -289,7 +289,10 @@ or similar authorization proxies.
|
||||
|
||||
## Benchmarks
|
||||
|
||||
See [the comparison of VictoriaLogs with Elasticsearch, MongoDB, TimescaleDB, PostgreSQL, MySQL and SQLite](https://benchmark.clickhouse.com/#eyJzeXN0ZW0iOnsiQWxsb3lEQiI6ZmFsc2UsIkFsbG95REIgKHR1bmVkKSI6ZmFsc2UsIkF0aGVuYSAocGFydGl0aW9uZWQpIjpmYWxzZSwiQXRoZW5hIChzaW5nbGUpIjpmYWxzZSwiQXVyb3JhIGZvciBNeVNRTCI6ZmFsc2UsIkF1cm9yYSBmb3IgUG9zdGdyZVNRTCI6ZmFsc2UsIkJ5Q29uaXR5IjpmYWxzZSwiQnl0ZUhvdXNlIjpmYWxzZSwiY2hEQiAoRGF0YUZyYW1lKSI6ZmFsc2UsImNoREIgKFBhcnF1ZXQsIHBhcnRpdGlvbmVkKSI6ZmFsc2UsImNoREIiOmZhbHNlLCJDaXR1cyI6ZmFsc2UsIkNsaWNrSG91c2UgQ2xvdWQgKGF3cykiOmZhbHNlLCJDbGlja0hvdXNlIENsb3VkIChhenVyZSkiOmZhbHNlLCJDbGlja0hvdXNlIENsb3VkIChnY3ApIjpmYWxzZSwiQ2xpY2tIb3VzZSAoZGF0YSBsYWtlLCBwYXJ0aXRpb25lZCkiOmZhbHNlLCJDbGlja0hvdXNlIChkYXRhIGxha2UsIHNpbmdsZSkiOmZhbHNlLCJDbGlja0hvdXNlIChQYXJxdWV0LCBwYXJ0aXRpb25lZCkiOmZhbHNlLCJDbGlja0hvdXNlIChQYXJxdWV0LCBzaW5nbGUpIjpmYWxzZSwiQ2xpY2tIb3VzZSAod2ViKSI6ZmFsc2UsIkNsaWNrSG91c2UiOmZhbHNlLCJDbGlja0hvdXNlICh0dW5lZCkiOmZhbHNlLCJDbGlja0hvdXNlICh0dW5lZCwgbWVtb3J5KSI6ZmFsc2UsIkNsb3VkYmVycnkiOmZhbHNlLCJDcmF0ZURCIjpmYWxzZSwiQ3J1bmNoeSBCcmlkZ2UgZm9yIEFuYWx5dGljcyAoUGFycXVldCkiOmZhbHNlLCJEYXRhYmVuZCI6ZmFsc2UsIkRhdGFGdXNpb24gKFBhcnF1ZXQsIHBhcnRpdGlvbmVkKSI6ZmFsc2UsIkRhdGFGdXNpb24gKFBhcnF1ZXQsIHNpbmdsZSkiOmZhbHNlLCJBcGFjaGUgRG9yaXMiOmZhbHNlLCJEcmlsbCI6ZmFsc2UsIkRydWlkIjpmYWxzZSwiRHVja0RCIChEYXRhRnJhbWUpIjpmYWxzZSwiRHVja0RCIChtZW1vcnkpIjpmYWxzZSwiRHVja0RCIChQYXJxdWV0LCBwYXJ0aXRpb25lZCkiOmZhbHNlLCJEdWNrREIiOmZhbHNlLCJFbGFzdGljc2VhcmNoIjp0cnVlLCJFbGFzdGljc2VhcmNoICh0dW5lZCkiOmZhbHNlLCJHbGFyZURCIjpmYWxzZSwiR3JlZW5wbHVtIjpmYWxzZSwiSGVhdnlBSSI6ZmFsc2UsIkh5ZHJhIjpmYWxzZSwiSW5mb2JyaWdodCI6ZmFsc2UsIktpbmV0aWNhIjpmYWxzZSwiTWFyaWFEQiBDb2x1bW5TdG9yZSI6ZmFsc2UsIk1hcmlhREIiOmZhbHNlLCJNb25ldERCIjpmYWxzZSwiTW9uZ29EQiI6dHJ1ZSwiTW90aGVyRHVjayI6ZmFsc2UsIk15U1FMIChNeUlTQU0pIjpmYWxzZSwiTXlTUUwiOnRydWUsIk9jdG9TUUwiOmZhbHNlLCJPeGxhIjpmYWxzZSwiUGFuZGFzIChEYXRhRnJhbWUpIjpmYWxzZSwiUGFyYWRlREIgKFBhcnF1ZXQsIHBhcnRpdGlvbmVkKSI6ZmFsc2UsIlBhcmFkZURCIChQYXJxdWV0LCBzaW5nbGUpIjpmYWxzZSwicGdfZHVja2RiIChNb3RoZXJEdWNrIGVuYWJsZWQpIjpmYWxzZSwicGdfZHVja2RiIjpmYWxzZSwiUGlub3QiOmZhbHNlLCJQb2xhcnMgKERhdGFGcmFtZSkiOmZhbHNlLCJQb2xhcnMgKFBhcnF1ZXQpIjpmYWxzZSwiUG9zdGdyZVNRTCAodHVuZWQpIjpmYWxzZSwiUG9zdGdyZVNRTCI6dHJ1ZSwiUXVlc3REQiI6ZmFsc2UsIlJlZHNoaWZ0IjpmYWxzZSwiU2VsZWN0REIiOmZhbHNlLCJTaW5nbGVTdG9yZSI6ZmFsc2UsIlNub3dmbGFrZSI6ZmFsc2UsIlNwYXJrIjpmYWxzZSwiU1FMaXRlIjp0cnVlLCJTdGFyUm9ja3MiOmZhbHNlLCJUYWJsZXNwYWNlIjpmYWxzZSwiVGVtYm8gT0xBUCAoY29sdW1uYXIpIjpmYWxzZSwiVGltZXNjYWxlIENsb3VkIjpmYWxzZSwiVGltZXNjYWxlREIgKG5vIGNvbHVtbnN0b3JlKSI6ZmFsc2UsIlRpbWVzY2FsZURCIjp0cnVlLCJUaW55YmlyZCAoRnJlZSBUcmlhbCkiOmZhbHNlLCJVbWJyYSI6ZmFsc2UsIlZpY3RvcmlhTG9ncyI6dHJ1ZX0sInR5cGUiOnsiQyI6dHJ1ZSwiY29sdW1uLW9yaWVudGVkIjp0cnVlLCJQb3N0Z3JlU1FMIGNvbXBhdGlibGUiOnRydWUsIm1hbmFnZWQiOnRydWUsImdjcCI6dHJ1ZSwic3RhdGVsZXNzIjp0cnVlLCJKYXZhIjp0cnVlLCJDKysiOnRydWUsIk15U1FMIGNvbXBhdGlibGUiOnRydWUsInJvdy1vcmllbnRlZCI6dHJ1ZSwiQ2xpY2tIb3VzZSBkZXJpdmF0aXZlIjp0cnVlLCJlbWJlZGRlZCI6dHJ1ZSwic2VydmVybGVzcyI6dHJ1ZSwiZGF0YWZyYW1lIjp0cnVlLCJhd3MiOnRydWUsImF6dXJlIjp0cnVlLCJhbmFseXRpY2FsIjp0cnVlLCJSdXN0Ijp0cnVlLCJzZWFyY2giOnRydWUsImRvY3VtZW50Ijp0cnVlLCJHbyI6dHJ1ZSwic29tZXdoYXQgUG9zdGdyZVNRTCBjb21wYXRpYmxlIjp0cnVlLCJEYXRhRnJhbWUiOnRydWUsInBhcnF1ZXQiOnRydWUsInRpbWUtc2VyaWVzIjp0cnVlfSwibWFjaGluZSI6eyIxNiB2Q1BVIDEyOEdCIjpmYWxzZSwiOCB2Q1BVIDY0R0IiOmZhbHNlLCJzZXJ2ZXJsZXNzIjpmYWxzZSwiMTZhY3UiOmZhbHNlLCJjNmEuNHhsYXJnZSwgNTAwZ2IgZ3AyIjp0cnVlLCJMIjpmYWxzZSwiTSI6ZmFsc2UsIlMiOmZhbHNlLCJYUyI6ZmFsc2UsImM2YS5tZXRhbCwgNTAwZ2IgZ3AyIjpmYWxzZSwiMTkyR0IiOmZhbHNlLCIyNEdCIjpmYWxzZSwiMzYwR0IiOmZhbHNlLCI0OEdCIjpmYWxzZSwiNzIwR0IiOmZhbHNlLCI5NkdCIjpmYWxzZSwiZGV2IjpmYWxzZSwiNzA4R0IiOmZhbHNlLCJjNW4uNHhsYXJnZSwgNTAwZ2IgZ3AyIjpmYWxzZSwiQW5hbHl0aWNzLTI1NkdCICg2NCB2Q29yZXMsIDI1NiBHQikiOmZhbHNlLCJjNS40eGxhcmdlLCA1MDBnYiBncDIiOmZhbHNlLCJjNmEuNHhsYXJnZSwgMTUwMGdiIGdwMiI6dHJ1ZSwiY2xvdWQiOmZhbHNlLCJkYzIuOHhsYXJnZSI6ZmFsc2UsInJhMy4xNnhsYXJnZSI6ZmFsc2UsInJhMy40eGxhcmdlIjpmYWxzZSwicmEzLnhscGx1cyI6ZmFsc2UsIlMyIjpmYWxzZSwiUzI0IjpmYWxzZSwiMlhMIjpmYWxzZSwiM1hMIjpmYWxzZSwiNFhMIjpmYWxzZSwiWEwiOmZhbHNlLCJMMSAtIDE2Q1BVIDMyR0IiOmZhbHNlLCJjNmEuNHhsYXJnZSwgNTAwZ2IgZ3AzIjpmYWxzZSwiMTYgdkNQVSA2NEdCIjpmYWxzZSwiNCB2Q1BVIDE2R0IiOmZhbHNlLCI4IHZDUFUgMzJHQiI6ZmFsc2V9LCJjbHVzdGVyX3NpemUiOnsiMSI6dHJ1ZSwiMiI6ZmFsc2UsIjQiOmZhbHNlLCI4IjpmYWxzZSwiMTYiOmZhbHNlLCIzMiI6ZmFsc2UsIjY0IjpmYWxzZSwiMTI4IjpmYWxzZSwic2VydmVybGVzcyI6ZmFsc2UsInVuZGVmaW5lZCI6ZmFsc2V9LCJtZXRyaWMiOiJob3QiLCJxdWVyaWVzIjpbdHJ1ZSx0cnVlLHRydWUsdHJ1ZSx0cnVlLHRydWUsdHJ1ZSx0cnVlLHRydWUsdHJ1ZSx0cnVlLHRydWUsdHJ1ZSx0cnVlLHRydWUsdHJ1ZSx0cnVlLHRydWUsdHJ1ZSx0cnVlLHRydWUsdHJ1ZSx0cnVlLHRydWUsdHJ1ZSx0cnVlLHRydWUsdHJ1ZSx0cnVlLHRydWUsdHJ1ZSx0cnVlLHRydWUsdHJ1ZSx0cnVlLHRydWUsdHJ1ZSx0cnVlLHRydWUsdHJ1ZSx0cnVlLHRydWUsdHJ1ZV19).
|
||||
See the following benchmark results:
|
||||
|
||||
- [JSONBench: the comparison of VictoriaLogs with Elasticsearch, MongoDB, DuckDB and PostgreSQL](https://jsonbench.com/#eyJzeXN0ZW0iOnsiQ2xpY2tIb3VzZSAobHo0KSI6ZmFsc2UsIkNsaWNrSG91c2UgKHpzdGQpIjpmYWxzZSwiRHVja0RCIjp0cnVlLCJFbGFzdGljc2VhcmNoIChubyBzb3VyY2UsIGJlc3QgY29tcHJlc3Npb24pIjpmYWxzZSwiRWxhc3RpY3NlYXJjaCAobm8gc291cmNlLCBkZWZhdWx0KSI6ZmFsc2UsIkVsYXN0aWNzZWFyY2ggKGJlc3QgY29tcHJlc3Npb24pIjpmYWxzZSwiRWxhc3RpY3NlYXJjaCAoZGVmYXVsdCkiOnRydWUsIkVsYXN0aWNzZWFyY2giOmZhbHNlLCJNb25nb0RCIChzbmFwcHksIGNvdmVyZWQgaW5kZXgpIjpmYWxzZSwiTW9uZ29EQiAoenN0ZCwgY292ZXJlZCBpbmRleCkiOmZhbHNlLCJNb25nb0RCIChzbmFwcHkpIjpmYWxzZSwiTW9uZ29EQiAoenN0ZCkiOnRydWUsIlBvc3RncmVTUUwgKGx6NCkiOnRydWUsIlBvc3RncmVTUUwgKHBnbHopIjpmYWxzZSwiVmljdG9yaWFMb2dzIjp0cnVlfSwic2NhbGUiOjEwMDAwMDAwMDAsIm1ldHJpYyI6ImhvdCIsInF1ZXJpZXMiOlt0cnVlLHRydWUsdHJ1ZSx0cnVlLHRydWVdfQ==). The benchmark can be reproduced by running `main.sh` file inside `victorialogs` directory of the [JSONBench repository](https://github.com/ClickHouse/JSONBench).
|
||||
- [ClickBench: the comparison of VictoriaLogs with Elasticsearch, MongoDB, TimescaleDB, PostgreSQL, MySQL and SQLite](https://benchmark.clickhouse.com/#eyJzeXN0ZW0iOnsiQWxsb3lEQiI6ZmFsc2UsIkFsbG95REIgKHR1bmVkKSI6ZmFsc2UsIkF0aGVuYSAocGFydGl0aW9uZWQpIjpmYWxzZSwiQXRoZW5hIChzaW5nbGUpIjpmYWxzZSwiQXVyb3JhIGZvciBNeVNRTCI6ZmFsc2UsIkF1cm9yYSBmb3IgUG9zdGdyZVNRTCI6ZmFsc2UsIkJ5Q29uaXR5IjpmYWxzZSwiQnl0ZUhvdXNlIjpmYWxzZSwiY2hEQiAoRGF0YUZyYW1lKSI6ZmFsc2UsImNoREIgKFBhcnF1ZXQsIHBhcnRpdGlvbmVkKSI6ZmFsc2UsImNoREIiOmZhbHNlLCJDaXR1cyI6ZmFsc2UsIkNsaWNrSG91c2UgQ2xvdWQgKGF3cykiOmZhbHNlLCJDbGlja0hvdXNlIENsb3VkIChhenVyZSkiOmZhbHNlLCJDbGlja0hvdXNlIENsb3VkIChnY3ApIjpmYWxzZSwiQ2xpY2tIb3VzZSAoZGF0YSBsYWtlLCBwYXJ0aXRpb25lZCkiOmZhbHNlLCJDbGlja0hvdXNlIChkYXRhIGxha2UsIHNpbmdsZSkiOmZhbHNlLCJDbGlja0hvdXNlIChQYXJxdWV0LCBwYXJ0aXRpb25lZCkiOmZhbHNlLCJDbGlja0hvdXNlIChQYXJxdWV0LCBzaW5nbGUpIjpmYWxzZSwiQ2xpY2tIb3VzZSAod2ViKSI6ZmFsc2UsIkNsaWNrSG91c2UiOmZhbHNlLCJDbGlja0hvdXNlICh0dW5lZCkiOmZhbHNlLCJDbGlja0hvdXNlICh0dW5lZCwgbWVtb3J5KSI6ZmFsc2UsIkNsb3VkYmVycnkiOmZhbHNlLCJDcmF0ZURCIjpmYWxzZSwiQ3J1bmNoeSBCcmlkZ2UgZm9yIEFuYWx5dGljcyAoUGFycXVldCkiOmZhbHNlLCJEYXRhYmVuZCI6ZmFsc2UsIkRhdGFGdXNpb24gKFBhcnF1ZXQsIHBhcnRpdGlvbmVkKSI6ZmFsc2UsIkRhdGFGdXNpb24gKFBhcnF1ZXQsIHNpbmdsZSkiOmZhbHNlLCJBcGFjaGUgRG9yaXMiOmZhbHNlLCJEcmlsbCI6ZmFsc2UsIkRydWlkIjpmYWxzZSwiRHVja0RCIChEYXRhRnJhbWUpIjpmYWxzZSwiRHVja0RCIChtZW1vcnkpIjpmYWxzZSwiRHVja0RCIChQYXJxdWV0LCBwYXJ0aXRpb25lZCkiOmZhbHNlLCJEdWNrREIiOmZhbHNlLCJFbGFzdGljc2VhcmNoIjp0cnVlLCJFbGFzdGljc2VhcmNoICh0dW5lZCkiOmZhbHNlLCJHbGFyZURCIjpmYWxzZSwiR3JlZW5wbHVtIjpmYWxzZSwiSGVhdnlBSSI6ZmFsc2UsIkh5ZHJhIjpmYWxzZSwiSW5mb2JyaWdodCI6ZmFsc2UsIktpbmV0aWNhIjpmYWxzZSwiTWFyaWFEQiBDb2x1bW5TdG9yZSI6ZmFsc2UsIk1hcmlhREIiOmZhbHNlLCJNb25ldERCIjpmYWxzZSwiTW9uZ29EQiI6dHJ1ZSwiTW90aGVyRHVjayI6ZmFsc2UsIk15U1FMIChNeUlTQU0pIjpmYWxzZSwiTXlTUUwiOnRydWUsIk9jdG9TUUwiOmZhbHNlLCJPeGxhIjpmYWxzZSwiUGFuZGFzIChEYXRhRnJhbWUpIjpmYWxzZSwiUGFyYWRlREIgKFBhcnF1ZXQsIHBhcnRpdGlvbmVkKSI6ZmFsc2UsIlBhcmFkZURCIChQYXJxdWV0LCBzaW5nbGUpIjpmYWxzZSwicGdfZHVja2RiIChNb3RoZXJEdWNrIGVuYWJsZWQpIjpmYWxzZSwicGdfZHVja2RiIjpmYWxzZSwiUGlub3QiOmZhbHNlLCJQb2xhcnMgKERhdGFGcmFtZSkiOmZhbHNlLCJQb2xhcnMgKFBhcnF1ZXQpIjpmYWxzZSwiUG9zdGdyZVNRTCAodHVuZWQpIjpmYWxzZSwiUG9zdGdyZVNRTCI6dHJ1ZSwiUXVlc3REQiI6ZmFsc2UsIlJlZHNoaWZ0IjpmYWxzZSwiU2VsZWN0REIiOmZhbHNlLCJTaW5nbGVTdG9yZSI6ZmFsc2UsIlNub3dmbGFrZSI6ZmFsc2UsIlNwYXJrIjpmYWxzZSwiU1FMaXRlIjp0cnVlLCJTdGFyUm9ja3MiOmZhbHNlLCJUYWJsZXNwYWNlIjpmYWxzZSwiVGVtYm8gT0xBUCAoY29sdW1uYXIpIjpmYWxzZSwiVGltZXNjYWxlIENsb3VkIjpmYWxzZSwiVGltZXNjYWxlREIgKG5vIGNvbHVtbnN0b3JlKSI6ZmFsc2UsIlRpbWVzY2FsZURCIjp0cnVlLCJUaW55YmlyZCAoRnJlZSBUcmlhbCkiOmZhbHNlLCJVbWJyYSI6ZmFsc2UsIlZpY3RvcmlhTG9ncyI6dHJ1ZX0sInR5cGUiOnsiQyI6dHJ1ZSwiY29sdW1uLW9yaWVudGVkIjp0cnVlLCJQb3N0Z3JlU1FMIGNvbXBhdGlibGUiOnRydWUsIm1hbmFnZWQiOnRydWUsImdjcCI6dHJ1ZSwic3RhdGVsZXNzIjp0cnVlLCJKYXZhIjp0cnVlLCJDKysiOnRydWUsIk15U1FMIGNvbXBhdGlibGUiOnRydWUsInJvdy1vcmllbnRlZCI6dHJ1ZSwiQ2xpY2tIb3VzZSBkZXJpdmF0aXZlIjp0cnVlLCJlbWJlZGRlZCI6dHJ1ZSwic2VydmVybGVzcyI6dHJ1ZSwiZGF0YWZyYW1lIjp0cnVlLCJhd3MiOnRydWUsImF6dXJlIjp0cnVlLCJhbmFseXRpY2FsIjp0cnVlLCJSdXN0Ijp0cnVlLCJzZWFyY2giOnRydWUsImRvY3VtZW50Ijp0cnVlLCJHbyI6dHJ1ZSwic29tZXdoYXQgUG9zdGdyZVNRTCBjb21wYXRpYmxlIjp0cnVlLCJEYXRhRnJhbWUiOnRydWUsInBhcnF1ZXQiOnRydWUsInRpbWUtc2VyaWVzIjp0cnVlfSwibWFjaGluZSI6eyIxNiB2Q1BVIDEyOEdCIjpmYWxzZSwiOCB2Q1BVIDY0R0IiOmZhbHNlLCJzZXJ2ZXJsZXNzIjpmYWxzZSwiMTZhY3UiOmZhbHNlLCJjNmEuNHhsYXJnZSwgNTAwZ2IgZ3AyIjp0cnVlLCJMIjpmYWxzZSwiTSI6ZmFsc2UsIlMiOmZhbHNlLCJYUyI6ZmFsc2UsImM2YS5tZXRhbCwgNTAwZ2IgZ3AyIjpmYWxzZSwiMTkyR0IiOmZhbHNlLCIyNEdCIjpmYWxzZSwiMzYwR0IiOmZhbHNlLCI0OEdCIjpmYWxzZSwiNzIwR0IiOmZhbHNlLCI5NkdCIjpmYWxzZSwiZGV2IjpmYWxzZSwiNzA4R0IiOmZhbHNlLCJjNW4uNHhsYXJnZSwgNTAwZ2IgZ3AyIjpmYWxzZSwiQW5hbHl0aWNzLTI1NkdCICg2NCB2Q29yZXMsIDI1NiBHQikiOmZhbHNlLCJjNS40eGxhcmdlLCA1MDBnYiBncDIiOmZhbHNlLCJjNmEuNHhsYXJnZSwgMTUwMGdiIGdwMiI6dHJ1ZSwiY2xvdWQiOmZhbHNlLCJkYzIuOHhsYXJnZSI6ZmFsc2UsInJhMy4xNnhsYXJnZSI6ZmFsc2UsInJhMy40eGxhcmdlIjpmYWxzZSwicmEzLnhscGx1cyI6ZmFsc2UsIlMyIjpmYWxzZSwiUzI0IjpmYWxzZSwiMlhMIjpmYWxzZSwiM1hMIjpmYWxzZSwiNFhMIjpmYWxzZSwiWEwiOmZhbHNlLCJMMSAtIDE2Q1BVIDMyR0IiOmZhbHNlLCJjNmEuNHhsYXJnZSwgNTAwZ2IgZ3AzIjpmYWxzZSwiMTYgdkNQVSA2NEdCIjpmYWxzZSwiNCB2Q1BVIDE2R0IiOmZhbHNlLCI4IHZDUFUgMzJHQiI6ZmFsc2V9LCJjbHVzdGVyX3NpemUiOnsiMSI6dHJ1ZSwiMiI6ZmFsc2UsIjQiOmZhbHNlLCI4IjpmYWxzZSwiMTYiOmZhbHNlLCIzMiI6ZmFsc2UsIjY0IjpmYWxzZSwiMTI4IjpmYWxzZSwic2VydmVybGVzcyI6ZmFsc2UsInVuZGVmaW5lZCI6ZmFsc2V9LCJtZXRyaWMiOiJob3QiLCJxdWVyaWVzIjpbdHJ1ZSx0cnVlLHRydWUsdHJ1ZSx0cnVlLHRydWUsdHJ1ZSx0cnVlLHRydWUsdHJ1ZSx0cnVlLHRydWUsdHJ1ZSx0cnVlLHRydWUsdHJ1ZSx0cnVlLHRydWUsdHJ1ZSx0cnVlLHRydWUsdHJ1ZSx0cnVlLHRydWUsdHJ1ZSx0cnVlLHRydWUsdHJ1ZSx0cnVlLHRydWUsdHJ1ZSx0cnVlLHRydWUsdHJ1ZSx0cnVlLHRydWUsdHJ1ZSx0cnVlLHRydWUsdHJ1ZSx0cnVlLHRydWUsdHJ1ZV19). The benchmark can be reproduced by running `benchmark.sh` file inside `victorialogs` directory of the [ClickBench repository](https://github.com/ClickHouse/ClickBench/).
|
||||
|
||||
Here is a [benchmark suite](https://github.com/VictoriaMetrics/VictoriaMetrics/tree/master/deployment/logs-benchmark) for comparing data ingestion performance
|
||||
and resource usage between VictoriaLogs and Elasticsearch or Loki.
|
||||
|
||||
@@ -26,7 +26,7 @@ clients:
|
||||
Substitute `localhost:9428` address inside `clients` with the real TCP address of VictoriaLogs.
|
||||
|
||||
VictoriaLogs uses [log streams](https://docs.victoriametrics.com/victorialogs/keyconcepts/#stream-fields) defined at the client side,
|
||||
e.g. at Promtail, Grafana Agent or Grafana Allow. Sometimes it may be needed overriding the set of these fields. This can be done via `_stream_fields`
|
||||
e.g. at Promtail, Grafana Agent or Grafana Alloy. Sometimes it may be needed overriding the set of these fields. This can be done via `_stream_fields`
|
||||
query arg. For example, the following config instructs using only the `instance` and `job` labels as log stream fields, while other labels
|
||||
will be stored as [usual log fields](https://docs.victoriametrics.com/victorialogs/keyconcepts/#data-model):
|
||||
|
||||
|
||||
@@ -11,6 +11,15 @@ aliases:
|
||||
---
|
||||
Please find the changelog for VictoriaMetrics Anomaly Detection below.
|
||||
|
||||
## v1.20.0
|
||||
Released: 2025-03-03
|
||||
|
||||
- FEATURE: The `scale` argument is now a [common argument](https://docs.victoriametrics.com/anomaly-detection/components/models/#scale), previously supported only by [`ProphetModel`](https://docs.victoriametrics.com/anomaly-detection/components/models/#prophet) and [`OnlineQuantileModel`](https://docs.victoriametrics.com/anomaly-detection/components/models/#online-seasonal-quantile). Additionally, `scale` is now **two-sided**, represented as `[scale_lb, scale_ub]`. The previous format (`scale: x`) remains supported and will be automatically converted to `scale: [x, x]`.
|
||||
|
||||
- FEATURE: Introduced a post-processing step to clip `yhat`, `yhat_lower`, and `yhat_upper` to the configured `data_range` [values](https://docs.victoriametrics.com/anomaly-detection/components/reader/?highlight=data_range#config-parameters) in `VmReader`, if defined. This feature is disabled by default for backward compatibility. It can be enabled for models that generate predictions and estimates, such as [`ProphetModel`](https://docs.victoriametrics.com/anomaly-detection/components/models/#prophet), by setting the [common argument](https://docs.victoriametrics.com/anomaly-detection/components/models/#clip-predictions) `clip_predictions` to `True`.
|
||||
|
||||
- IMPROVEMENT: Introduced the `anomaly_score_outside_data_range` [parameter](https://docs.victoriametrics.com/anomaly-detection/components/models/#score-outside-data-range) to allow overriding the default anomaly score (`1.01`) assigned when input values (`y`) fall outside the defined `data_range` (data domain violation). It improves flexibility for alerting rules and enables clearer visual distinction between different anomaly scenarios. Override can be configured at the **service level** (`settings`) or per **model instance** (`models.model_xxx`), with model-level values taking priority. If not explicitly set, the default anomaly score remains `1.01` for backward compatibility.
|
||||
|
||||
## v1.19.2
|
||||
Released: 2025-01-27
|
||||
|
||||
|
||||
@@ -93,16 +93,74 @@ To visualize and interact with both [self-monitoring metrics](https://docs.victo
|
||||
|
||||
|
||||
## Choosing the right model for vmanomaly
|
||||
Selecting the best model for `vmanomaly` depends on the data's nature and the [types of anomalies](https://victoriametrics.com/blog/victoriametrics-anomaly-detection-handbook-chapter-2/#categories-of-anomalies) to detect. For instance, [Z-score](https://docs.victoriametrics.com/anomaly-detection/components/models#z-score) is suitable for data without trends or seasonality, while more complex patterns might require models like [Prophet](https://docs.victoriametrics.com/anomaly-detection/components/models#prophet).
|
||||
Selecting the best model for `vmanomaly` depends on the data's nature and the [types of anomalies](https://victoriametrics.com/blog/victoriametrics-anomaly-detection-handbook-chapter-2/#categories-of-anomalies) to detect. For instance, [Z-score](https://docs.victoriametrics.com/anomaly-detection/components/models#online-z-score) is suitable for data without trends or seasonality, while more complex patterns might require models like [Prophet](https://docs.victoriametrics.com/anomaly-detection/components/models#prophet).
|
||||
|
||||
Also, it's possible to auto-tune the most important params of selected model class {{% available_from "v1.12.0" anomaly %}}, find [the details here](https://docs.victoriametrics.com/anomaly-detection/components/models#autotuned).
|
||||
Also, there is an option to auto-tune the most important (hyper)parameters of selected model class {{% available_from "v1.12.0" anomaly %}}, find [the details here](https://docs.victoriametrics.com/anomaly-detection/components/models#autotuned).
|
||||
|
||||
Please refer to [respective blogpost on anomaly types and alerting heuristics](https://victoriametrics.com/blog/victoriametrics-anomaly-detection-handbook-chapter-2/) for more details.
|
||||
|
||||
Still not 100% sure what to use? We are [here to help](https://docs.victoriametrics.com/anomaly-detection/#get-in-touch).
|
||||
|
||||
## Incorporating domain knowledge
|
||||
|
||||
Anomaly detection models can significantly improve when incorporating business-specific assumptions about the data and what constitutes an anomaly. `vmanomaly` supports various [business-side configuration parameters](https://docs.victoriametrics.com/anomaly-detection/components/models/#common-args) across all built-in models to **reduce [false positives](https://victoriametrics.com/blog/victoriametrics-anomaly-detection-handbook-chapter-1/#false-positive)** and **align model behavior with business needs**, for example:
|
||||
|
||||
- **Setting `detection_direction`** – use [`detection_direction`](https://docs.victoriametrics.com/anomaly-detection/components/models/#detection-direction) to specify whether anomalies occur **above or below expectations**:
|
||||
- Set to `above_expected` for metrics like error rates, where spikes indicate anomalies.
|
||||
- Set to `below_expected` for metrics like customer satisfaction scores or SLAs, where drops indicate anomalies.
|
||||
|
||||
- **Defining a `data_range`** – configure [`data_range`](https://docs.victoriametrics.com/anomaly-detection/components/reader/?highlight=data_range#config-parameters) for the model’s input query to **automatically assign anomaly scores > 1** for values (`y`) that fall outside the defined range.
|
||||
|
||||
- **Filtering minor fluctuations with `min_dev_from_expected`** – use [`min_dev_from_expected`](https://docs.victoriametrics.com/anomaly-detection/components/models/#minimal-deviation-from-expected) to **ignore insignificant deviations** and prevent small fluctuations from triggering [false positives](https://victoriametrics.com/blog/victoriametrics-anomaly-detection-handbook-chapter-1/#false-positive).
|
||||
|
||||
- **Applying `scale` for asymmetric confidence adjustments** – use [`scale`](https://docs.victoriametrics.com/anomaly-detection/components/models/#scale) to adjust confidence intervals **differently for spikes and drops**, ensuring more appropriate anomaly detection.
|
||||
|
||||
**Example:**
|
||||
|
||||
Consider a metric tracking the percentage of HTTP 4xx status codes for a specific endpoint. Hypothetical business expectations for anomaly detection may be defined as follows:
|
||||
|
||||
- **Expected data range**: The percentage naturally falls between `0%` and `100%` (`[0, 1]`).
|
||||
- **Threshold-based anomaly detection**: If the error rate exceeds `5%`, it should be **automatically flagged as an anomaly** ([anomaly score](#what-is-anomaly-score) > 1), encouraging an incident investigation.
|
||||
- **Regime shift detection**: A **continuous increase** in error rates (e.g., from `1.5%` to `3%`) should also be considered **anomalous**, as regime change may indicate underlying system problem, e.g. with a new release.
|
||||
- **Avoiding false positives**: **Small, infrequent deviations** (e.g., from `1%` to `1.3%`) should **not** trigger alerts to **prevent unnecessary SRE escalations**. Let it be on the level of 0.5%.
|
||||
|
||||
Then, the following config may be used to benefit from incorporating domain knowledge into model behavior:
|
||||
|
||||
```yaml
|
||||
# other sections, like writer, monitoring ...
|
||||
schedulers:
|
||||
periodic_http:
|
||||
class: periodic
|
||||
fit_every: 12w
|
||||
fit_window: 1w
|
||||
infer_every: 1m
|
||||
# other schedulers ...
|
||||
reader:
|
||||
# other reader args, like datasource_url, tenant_id ...
|
||||
queries:
|
||||
percentage_4xx:
|
||||
expr: respective_metricsQL_expr
|
||||
data_range: [0, 0.05] # to automatically trigger anomaly score > 1 for error rates > 5%
|
||||
step: 1m
|
||||
models:
|
||||
# other models ...
|
||||
zscore: # let it be online Z-score, for simplicity
|
||||
class: zscore_online # online model update itself each infer call, resulting in resource-efficient setups
|
||||
z_threshold: 3.0
|
||||
schedulers: ['periodic_http']
|
||||
queries: ['percentage_4xx']
|
||||
detection_direction: 'above_expected' # as interested only in spikes, drops are OK
|
||||
min_dev_from_expected: 0.005 # <0.5% deviations vs expected values should be neglected, generating anomaly score == 0
|
||||
# to align predictions to be within [0, 5%] interval, defined in reader.queries.percentage_4xx.data_range
|
||||
clip_predictions: True
|
||||
# specify output series produced by vmanomaly to be written to VictoriaMetrics in `writer`
|
||||
provide_series: ['anomaly_score', 'y', 'yhat', 'yhat_lower', 'yhat_upper']
|
||||
```
|
||||
|
||||
## Alert generation in vmanomaly
|
||||
While `vmanomaly` detects anomalies and produces scores, it *does not directly generate alerts*. The anomaly scores are written back to VictoriaMetrics, where an external alerting tool, like [`vmalert`](https://docs.victoriametrics.com/vmalert), can be used to create alerts based on these scores for integrating it with your alerting management system.
|
||||
While `vmanomaly` detects anomalies and produces scores, it *does not directly generate alerts*. The anomaly scores are written back to VictoriaMetrics, where respective alerting tool, like [`vmalert`](https://docs.victoriametrics.com/vmalert), can be used to create alerts based on these scores for integrating it with your alerting management system. See an example diagram of how `vmanomaly` integrates into observability pipeline for anomaly detection on `node_exporter` metrics:
|
||||
|
||||
<img src="https://docs.victoriametrics.com/anomaly-detection/guides/guide-vmanomaly-vmalert/guide-vmanomaly-vmalert_overview.webp" alt="node_exporter_example_diagram" style="width:60%"/>
|
||||
|
||||
## Preventing alert fatigue
|
||||
Produced anomaly scores are designed in such a way that values from 0.0 to 1.0 indicate non-anomalous data, while a value greater than 1.0 is generally classified as an anomaly. However, there are no perfect models for anomaly detection, that's why reasonable defaults expressions like `anomaly_score > 1` may not work 100% of the time. However, anomaly scores, produced by `vmanomaly` are written back as metrics to VictoriaMetrics, where tools like [`vmalert`](https://docs.victoriametrics.com/vmalert) can use [MetricsQL](https://docs.victoriametrics.com/metricsql/) expressions to fine-tune alerting thresholds and conditions, balancing between avoiding [false negatives](https://victoriametrics.com/blog/victoriametrics-anomaly-detection-handbook-chapter-1/#false-negative) and reducing [false positives](https://victoriametrics.com/blog/victoriametrics-anomaly-detection-handbook-chapter-1/#false-positive).
|
||||
@@ -166,7 +224,7 @@ services:
|
||||
# ...
|
||||
vmanomaly:
|
||||
container_name: vmanomaly
|
||||
image: victoriametrics/vmanomaly:v1.19.2
|
||||
image: victoriametrics/vmanomaly:v1.20.0
|
||||
# ...
|
||||
ports:
|
||||
- "8490:8490"
|
||||
@@ -339,7 +397,7 @@ For **horizontal** scalability, `vmanomaly` can be deployed as multiple independ
|
||||
|
||||
- Splitting by **queries** [defined in the reader section](https://docs.victoriametrics.com/anomaly-detection/components/reader#vm-reader) and assigning each subset to a separate service instance should be used when having *a single query returning a large number of timeseries*. This can be further split by applying global MetricsQL filters using the `extra_filters` [parameter in the reader](https://docs.victoriametrics.com/anomaly-detection/components/reader?highlight=extra_filters#vm-reader). See example below.
|
||||
|
||||
- Spliting by **models** should be used when running multiple models on the same query. This is commonly done to reduce false positives by alerting only if multiple models detect an anomaly. See the `queries` argument in the [model configuration](https://docs.victoriametrics.com/anomaly-detection/components/models#queries). Additionally, this approach is useful when you just have a large set of resource-intensive independent models.
|
||||
- Spliting by **models** should be used when running multiple models on the same query. This is commonly done to reduce [false positives](https://victoriametrics.com/blog/victoriametrics-anomaly-detection-handbook-chapter-1/#false-positive) by alerting only if multiple models detect an anomaly. See the `queries` argument in the [model configuration](https://docs.victoriametrics.com/anomaly-detection/components/models#queries). Additionally, this approach is useful when you just have a large set of resource-intensive independent models.
|
||||
|
||||
- Splitting by **schedulers** should be used when the same models needs to be trained or inferred under different schedules. Refer to the `schedulers` argument in the [model section](https://docs.victoriametrics.com/anomaly-detection/components/models#schedulers) and the `scheduler` [component documentation](https://docs.victoriametrics.com/anomaly-detection/components/scheduler).
|
||||
|
||||
@@ -373,7 +431,7 @@ options:
|
||||
Here’s an example of using the config splitter to divide configurations based on the `extra_filters` argument from the reader section:
|
||||
|
||||
```sh
|
||||
docker pull victoriametrics/vmanomaly:v1.19.2 && docker image tag victoriametrics/vmanomaly:v1.19.2 vmanomaly
|
||||
docker pull victoriametrics/vmanomaly:v1.20.0 && docker image tag victoriametrics/vmanomaly:v1.20.0 vmanomaly
|
||||
```
|
||||
|
||||
```sh
|
||||
|
||||
@@ -1,15 +1,17 @@
|
||||
---
|
||||
weight: 1
|
||||
title: VictoriaMetrics Anomaly Detection Quick Start
|
||||
title: Quick Start
|
||||
menu:
|
||||
docs:
|
||||
parent: "anomaly-detection"
|
||||
identifier: "vmanomaly-quick-start"
|
||||
weight: 1
|
||||
title: Quick Start
|
||||
aliases:
|
||||
- /anomaly-detection/QuickStart.html
|
||||
---
|
||||
For a broader overview please visit the [navigation page](https://docs.victoriametrics.com/anomaly-detection/).
|
||||
|
||||
## How to install and run vmanomaly
|
||||
|
||||
> To run `vmanomaly`, you need to have VictoriaMetrics Enterprise license. You can get a trial license key [**here**](https://victoriametrics.com/products/enterprise/trial/).
|
||||
@@ -19,15 +21,13 @@ The following options are available:
|
||||
- [To run Docker image](#docker)
|
||||
- [To run in Kubernetes with Helm charts](#kubernetes-with-helm-charts)
|
||||
|
||||
> **Note**: Starting from [v1.13.0](https://docs.victoriametrics.com/anomaly-detection/changelog/#v1130) there is a mode to keep anomaly detection models on host filesystem after `fit` stage (instead of keeping them in-memory by default); This may lead to **noticeable reduction of RAM used** on bigger setups. See instructions [here](https://docs.victoriametrics.com/anomaly-detection/faq/#on-disk-mode).
|
||||
|
||||
> **Note**: Starting from [v1.16.0](https://docs.victoriametrics.com/anomaly-detection/changelog/#v1160), a similar optimization is available for data read from VictoriaMetrics TSDB. See instructions [here](https://docs.victoriametrics.com/anomaly-detection/faq/#on-disk-mode).
|
||||
> **Note**: There is a mode {{% available_from "v1.13.0" anomaly %}} to keep anomaly detection models on host filesystem after `fit` stage (instead of keeping them in-memory by default); This may lead to **noticeable reduction of RAM used** on bigger setups. Similar optimization {{% available_from "v1.16.0" anomaly %}} can be set for data read from VictoriaMetrics TSDB. See instructions [here](https://docs.victoriametrics.com/anomaly-detection/faq/#on-disk-mode).
|
||||
|
||||
### Command-line arguments
|
||||
|
||||
The `vmanomaly` service supports several command-line arguments to configure its behavior, including options for licensing, logging levels, and more. These arguments can be passed when starting the service via Docker or any other setup. Below is the list of available options:
|
||||
|
||||
> **Note**: Starting from [v1.18.5](https://docs.victoriametrics.com/anomaly-detection/changelog/#v1185) `vmanomaly` support running on config *directories*, see the `config` positional arg description in help message below.
|
||||
> **Note**: `vmanomaly` support {{% available_from "v1.18.5" anomaly %}} running on config *directories*, see the `config` positional arg description in help message below.
|
||||
|
||||
```shellhelp
|
||||
usage: vmanomaly.py [-h] [--license STRING | --licenseFile PATH] [--license.forceOffline] [--loggerLevel {INFO,DEBUG,ERROR,WARNING,FATAL}] [--watch] config [config ...]
|
||||
@@ -51,6 +51,7 @@ options:
|
||||
```
|
||||
|
||||
You can specify these options when running `vmanomaly` to fine-tune logging levels or handle licensing configurations, as per your requirements.
|
||||
|
||||
### Licensing
|
||||
|
||||
The license key can be passed via the following command-line flags: `--license`, `--licenseFile`, `--license.forceOffline`
|
||||
@@ -94,20 +95,29 @@ groups:
|
||||
```
|
||||
### Docker
|
||||
|
||||
> To run `vmanomaly`, you need to have VictoriaMetrics Enterprise license. You can get a trial license key [**here**](https://victoriametrics.com/products/enterprise/trial/).
|
||||
> To run `vmanomaly`, you need to have VictoriaMetrics Enterprise license. You can get a trial license key [**here**](https://victoriametrics.com/products/enterprise/trial/). <br><br>
|
||||
> Due to the upcoming [DockerHub pull limits](https://docs.docker.com/docker-hub/usage/pulls), an additional image registry, **Quay.io**, has been introduced for VictoriaMetrics images, including [`vmanomaly`](https://quay.io/repository/victoriametrics/vmanomaly). If you encounter pull rate limits, switch from:
|
||||
> ```
|
||||
> docker pull victoriametrics/vmanomaly:vX.Y.Z
|
||||
> ```
|
||||
> to:
|
||||
> ```
|
||||
> docker pull quay.io/victoriametrics/vmanomaly:vX.Y.Z
|
||||
> ```
|
||||
|
||||
|
||||
Below are the steps to get `vmanomaly` up and running inside a Docker container:
|
||||
|
||||
1. Pull Docker image:
|
||||
|
||||
```sh
|
||||
docker pull victoriametrics/vmanomaly:v1.19.2
|
||||
docker pull victoriametrics/vmanomaly:v1.20.0
|
||||
```
|
||||
|
||||
2. (Optional step) tag the `vmanomaly` Docker image:
|
||||
|
||||
```sh
|
||||
docker image tag victoriametrics/vmanomaly:v1.19.2 vmanomaly
|
||||
docker image tag victoriametrics/vmanomaly:v1.20.0 vmanomaly
|
||||
```
|
||||
|
||||
3. Start the `vmanomaly` Docker container with a *license file*, use the command below.
|
||||
@@ -141,7 +151,7 @@ docker run -it --user 1000:1000 \
|
||||
services:
|
||||
# ...
|
||||
vmanomaly:
|
||||
image: victoriametrics/vmanomaly:v1.19.2
|
||||
image: victoriametrics/vmanomaly:v1.20.0
|
||||
volumes:
|
||||
$YOUR_LICENSE_FILE_PATH:/license
|
||||
$YOUR_CONFIG_FILE_PATH:/config.yml
|
||||
@@ -165,6 +175,10 @@ See also:
|
||||
|
||||
> To run `vmanomaly`, you need to have VictoriaMetrics Enterprise license. You can get a trial license key [**here**](https://victoriametrics.com/products/enterprise/trial/).
|
||||
|
||||
> With the forthcoming [DockerHub pull limits](https://docs.docker.com/docker-hub/usage/pulls) additional image registry was introduced (quay.io) for VictoriaMetric images, [vmanomaly images in particular](https://quay.io/repository/victoriametrics/vmanomaly).
|
||||
If hitting pull limits, try switching your `docker pull quay.io/victoriametrics/vmanomaly:vX.Y.Z` to `docker pull quay.io/victoriametrics/vmanomaly:vX.Y.Z`
|
||||
```
|
||||
|
||||
You can run `vmanomaly` in Kubernetes environment
|
||||
with [these Helm charts](https://github.com/VictoriaMetrics/helm-charts/blob/master/charts/victoria-metrics-anomaly/README.md).
|
||||
|
||||
@@ -219,20 +233,22 @@ writer:
|
||||
### Recommended steps
|
||||
|
||||
**Schedulers**:
|
||||
- Define how often to run and make inferences in the [scheduler](https://docs.victoriametrics.com/anomaly-detection/components/scheduler/) section of a config file.
|
||||
- Configure the **inference frequency** in the [scheduler](https://docs.victoriametrics.com/anomaly-detection/components/scheduler/) section of the configuration file.
|
||||
- Ensure that `infer_every` aligns with your **minimum required alerting frequency**.
|
||||
- For example, if receiving **alerts every 15 minutes** is sufficient (when `anomaly_score > 1`), set `infer_every` to match `reader.sampling_period` or override it per query via `reader.queries.query_xxx.step` for an optimal setup.
|
||||
|
||||
**Reader**:
|
||||
- Setup the datasource to read data from in the [reader](https://docs.victoriametrics.com/anomaly-detection/components/reader/) section. Include tenant ID if using a [cluster version of VictoriaMetrics](https://docs.victoriametrics.com/cluster-victoriametrics/) for reading the data.
|
||||
- Define queries for input data using [MetricsQL](https://docs.victoriametrics.com/metricsql/) under `reader.queries` section.
|
||||
- Setup the datasource to read data from in the [reader](https://docs.victoriametrics.com/anomaly-detection/components/reader/) section. Include tenant ID if using a [cluster version of VictoriaMetrics](https://docs.victoriametrics.com/cluster-victoriametrics/) (`multitenant` value {{% available_from "v1.16.2" anomaly %}} can be also used here).
|
||||
- Define queries for input data using [MetricsQL](https://docs.victoriametrics.com/metricsql/) under `reader.queries` section. Note, it's possible to override reader-level arguments at query level for increased flexibility, e.g. specifying per-query timezone, data frequency, data range, etc.
|
||||
|
||||
**Writer**:
|
||||
- Specify where and how to store anomaly detection metrics in the [writer](https://docs.victoriametrics.com/anomaly-detection/components/writer/) section.
|
||||
- Include tenant ID if using a [cluster version of VictoriaMetrics](https://docs.victoriametrics.com/cluster-victoriametrics/) for writing the results.
|
||||
- Adding `for` label to `metric_format` argument is recommended for smoother visual experience in the [anomaly score dashboard](https://docs.victoriametrics.com/anomaly-detection/presets/#default).
|
||||
- Adding `for` label to `metric_format` argument is recommended for smoother visual experience in the [anomaly score dashboard](https://docs.victoriametrics.com/anomaly-detection/presets/#default). Please refer to `metric_format` argument description [here](https://docs.victoriametrics.com/anomaly-detection/components/writer/?highlight=metric_format#config-parameters).
|
||||
|
||||
**Models**:
|
||||
- Configure built-in models parameters according to your needs in the [models](https://docs.victoriametrics.com/anomaly-detection/components/models/) section.
|
||||
- (Optionally) Develop or integrate your [custom models](https://docs.victoriametrics.com/anomaly-detection/components/models/#custom-model-guide) with `vmanomaly`.
|
||||
- Configure built-in models parameters according to your needs in the [models](https://docs.victoriametrics.com/anomaly-detection/components/models/) section. Where possible, incorporate [domain knowledge](https://docs.victoriametrics.com/anomaly-detection/faq/#incorporating-domain-knowledge) for optimal results.
|
||||
- (Optional) Develop or integrate your [custom models](https://docs.victoriametrics.com/anomaly-detection/components/models/#custom-model-guide) with `vmanomaly`.
|
||||
- Adding `y` to `provide_series` arg values is recommended for smoother visual experience in the [anomaly score dashboard](https://docs.victoriametrics.com/anomaly-detection/presets/#default). Also, other `vmanomaly` [output](https://docs.victoriametrics.com/anomaly-detection/components/models#vmanomaly-output) can be used in `provide_series`. <br>**Note:** Only [univariate models](https://docs.victoriametrics.com/anomaly-detection/components/models/#univariate-models) support the generation of such output.
|
||||
|
||||
## Check also
|
||||
|
||||
@@ -1,41 +1,68 @@
|
||||
In the dynamic and complex world of system monitoring, [VictoriaMetrics Anomaly Detection](https://victoriametrics.com/products/enterprise/anomaly-detection/) (or shortly, `vmanomaly`), being a part of our [Enterprise offering](https://victoriametrics.com/products/enterprise/), stands as a pivotal tool for achieving advanced observability. It empowers SREs and DevOps teams by automating the identification of abnormal behavior in time-series data. It goes beyond traditional threshold-based alerting, utilizing machine learning techniques to not only detect anomalies but also minimize false positives, thus reducing alert fatigue. By providing simplified alerting mechanisms atop of [unified anomaly scores](https://docs.victoriametrics.com/anomaly-detection/components/models/#vmanomaly-output), it enables teams to spot and address potential issues faster, ensuring system reliability and operational efficiency.
|
||||
In today's fast-paced and complex landscape of system monitoring, [VictoriaMetrics Anomaly Detection](https://victoriametrics.com/products/enterprise/anomaly-detection/) (`vmanomaly`), part of our [Enterprise offering](https://victoriametrics.com/products/enterprise/), serves as a **powerful observability tool** for SREs and DevOps teams. It **automates the detection of anomalies in time-series data**, reducing manual efforts required to identify abnormal system behavior.
|
||||
|
||||
Unlike traditional threshold-based alerting, which relies on **raw metric values** and requires constant tuning and maintenance of thresholds and alerting rules, `vmanomaly` introduces a **unified, interpretable [anomaly score](https://docs.victoriametrics.com/anomaly-detection/faq/#what-is-anomaly-score)** - a **de-trended, de-seasonalized metric** generated through machine learning. This approach eliminates the need for frequent manual adjustments by enabling **stable, long-term static thresholds (as simple as `anomaly_score > 1`)** that remain effective over time through continuous model retraining.
|
||||
|
||||
By shifting to anomaly-based detection, teams can **identify and respond to potential issues faster**, enhancing system reliability and operational efficiency while significantly **reducing the engineering effort spent on maintaining alerting rules**.
|
||||
|
||||
|
||||
## What does it do?
|
||||
- Designed to periodically scan new data points across selected metrics, it forecasts unified [anomaly scores](https://docs.victoriametrics.com/anomaly-detection/faq/#what-is-anomaly-score).
|
||||
- Scores are recorded back to VictoriaMetrics TSDB for utilization in subsequent applications, such as alerting services.
|
||||
- Simplified alerting rules can be established and observability insights received, enhancing your operational efficiency.
|
||||
|
||||
`vmanomaly` is designed to **periodically analyze new data points** across selected metrics, generating a **unified metric** called [anomaly score](https://docs.victoriametrics.com/anomaly-detection/faq/#what-is-anomaly-score).
|
||||
|
||||
Key functions:
|
||||
- **Automated anomaly detection** – continuously scans time-series data to identify deviations from expected behavior.
|
||||
- **Seamless integration** – anomaly scores are stored in VictoriaMetrics TSDB for use in **alerting, visualization, and downstream analytics**.
|
||||
|
||||
The diagram below illustrates how `vmanomaly` fits into an observability setup, such as detecting anomalies in metrics collected by `node_exporter`:
|
||||
|
||||
<img src="https://docs.victoriametrics.com/anomaly-detection/guides/guide-vmanomaly-vmalert/guide-vmanomaly-vmalert_overview.webp" alt="node_exporter_example_diagram" style="width:60%"/>
|
||||
|
||||
## How does it work?
|
||||
At its core, VictoriaMetrics Anomaly Detection autonomously re-trains either pre-defined machine learning models or custom models tailored to your business needs on your data.
|
||||
|
||||
- ML models are employed to calculate anomaly scores for newly collected data points, as per a predefined schedule.
|
||||
- Alerts can be triggered based on simplified thresholds (i.e. anomaly_score > 1) that simplify and automate your observability setup.
|
||||
- Ongoing evaluations, presented either as specific point estimates or as ranges of confidence intervals, are designed to integrate seamlessly with downstream applications.
|
||||
VictoriaMetrics Anomaly Detection **continuously re-fit and apply machine learning models** - either [built-in](https://docs.victoriametrics.com/anomaly-detection/components/models/#built-in-models) or [custom](https://docs.victoriametrics.com/anomaly-detection/components/models/#custom-model-guide), specific to your business needs — on your [input](https://docs.victoriametrics.com/anomaly-detection/components/reader) data. This ensures that the default cut-off threshold (`anomaly score == 1`), which differentiates **normal** (`≤ 1`) from **anomalous** (`> 1`) data points, remains **relevant over time**.
|
||||
|
||||
## Practical Guides and Installation
|
||||
- **Automated anomaly scoring** - ML models calculate [anomaly scores](https://docs.victoriametrics.com/anomaly-detection/faq/#what-is-anomaly-score) for new data points based on a predefined [schedule](https://docs.victoriametrics.com/anomaly-detection/components/scheduler/).
|
||||
- **Simplified alerting** - alerts can be triggered using **straightforward thresholds** (e.g., `anomaly_score > 1`), reducing complexity in observability setups.
|
||||
- **Additional model outputs** - beyond anomaly scores, models provide [supplementary outputs](https://docs.victoriametrics.com/anomaly-detection/components/models/#vmanomaly-output), including:
|
||||
- **Point estimates** (`yhat`)
|
||||
- **Confidence intervals** (`[yhat_lower, yhat_upper]`)
|
||||
These outputs integrate seamlessly into downstream applications, making it easier to **visually inspect anomalies**, e.g. in respective [Grafana dashboards](https://docs.victoriametrics.com/anomaly-detection/presets/#grafana-dashboard).
|
||||
|
||||
Get started with VictoriaMetrics Anomaly Detection efficiently by following our guides and installation options:
|
||||
<img src="https://docs.victoriametrics.com/anomaly-detection/components/vmanomaly-components.webp" alt="node_exporter_example_diagram" style="width:80%"/>
|
||||
|
||||
## Key benefits
|
||||
|
||||
`vmanomaly` is designed to **reduce MTTR (Mean Time to Resolution)** in observability workflows by **automating anomaly detection** and **eliminating the need for manual threshold tuning**. It is particularly beneficial for:
|
||||
|
||||
- **Reducing alerting rule maintenance** – shifts from manually maintaining static thresholds on raw metric values to a **stable anomaly score threshold** that remains **reliable and interpretable over time**.
|
||||
|
||||
- **Handling complex metrics** – effectively detects anomalies in **trending, seasonal, or dynamically scaling data**, where **fixed thresholds and simpler models usually fail**.
|
||||
|
||||
- **Detecting anomalies in interconnected metrics** – supports **[multivariate anomaly detection](http://docs.victoriametrics.com/anomaly-detection/components/models#multivariate-models)**, identifying patterns across **related metrics** instead of treating them in isolation as [univariate metrics](http://docs.victoriametrics.com/anomaly-detection/components/models#univariate-models).
|
||||
|
||||
## Practical guides and installation
|
||||
|
||||
Get started with VictoriaMetrics Anomaly Detection by following our guides and installation options:
|
||||
|
||||
- **Quickstart**: Learn how to quickly set up `vmanomaly` by following the [Quickstart Guide](https://docs.victoriametrics.com/anomaly-detection/quickstart/).
|
||||
- **Integration**: Integrate anomaly detection into your existing observability stack. Find detailed steps [here](https://docs.victoriametrics.com/anomaly-detection/guides/guide-vmanomaly-vmalert/).
|
||||
- **Anomaly Detection Presets**: Enable anomaly detection on predefined sets of metrics that require frequent static threshold changes for alerting. Learn more [here](https://docs.victoriametrics.com/anomaly-detection/presets/).
|
||||
- **Anomaly Detection Presets**: Enable anomaly detection on predefined sets of metrics. Learn more [here](https://docs.victoriametrics.com/anomaly-detection/presets/).
|
||||
|
||||
- **Installation Options**: Choose the installation method that best fits your infrastructure:
|
||||
- **Docker Installation**: Ideal for containerized environments. Follow the [Docker Installation Guide](https://docs.victoriametrics.com/anomaly-detection/quickstart/#docker).
|
||||
- **Helm Chart Installation**: Recommended for Kubernetes deployments. See our [Helm charts](https://github.com/VictoriaMetrics/helm-charts/tree/master/charts/victoria-metrics-anomaly).
|
||||
|
||||
- **Self-Monitoring**: Ensure `vmanomaly` is functioning optimally with built-in self-monitoring capabilities. Use the provided Grafana dashboards and alerting rules to track service health and operational metrics. Find the complete docs [here](https://docs.victoriametrics.com/anomaly-detection/self-monitoring/).
|
||||
- **Self-Monitoring**: Ensure `vmanomaly` is functioning optimally, using provided Grafana dashboards and alerting rules to track service health and operational metrics. Find the guide [here](https://docs.victoriametrics.com/anomaly-detection/self-monitoring/).
|
||||
|
||||
> **Note**: starting from [v1.5.0](https://docs.victoriametrics.com/anomaly-detection/changelog/#v150) `vmanomaly` requires a [license key](https://docs.victoriametrics.com/anomaly-detection/quickstart/#licensing) to run. You can obtain a trial license key [**here**](https://victoriametrics.com/products/enterprise/trial/).
|
||||
|
||||
## Key Components
|
||||
Explore the integral components that configure VictoriaMetrics Anomaly Detection:
|
||||
* [Explore components and their interation](https://docs.victoriametrics.com/anomaly-detection/components/)
|
||||
- [Models](https://docs.victoriametrics.com/anomaly-detection/components/models/)
|
||||
- [Reader](https://docs.victoriametrics.com/anomaly-detection/components/reader/)
|
||||
- [Scheduler](https://docs.victoriametrics.com/anomaly-detection/components/scheduler/)
|
||||
- [Writer](https://docs.victoriametrics.com/anomaly-detection/components/writer/)
|
||||
- [Monitoring](https://docs.victoriametrics.com/anomaly-detection/components/monitoring/)
|
||||
Explore the [integral components](https://docs.victoriametrics.com/anomaly-detection/components/) that define VictoriaMetrics Anomaly Detection:
|
||||
- [Models](https://docs.victoriametrics.com/anomaly-detection/components/models/)
|
||||
- [Reader](https://docs.victoriametrics.com/anomaly-detection/components/reader/)
|
||||
- [Scheduler](https://docs.victoriametrics.com/anomaly-detection/components/scheduler/)
|
||||
- [Writer](https://docs.victoriametrics.com/anomaly-detection/components/writer/)
|
||||
- [Monitoring](https://docs.victoriametrics.com/anomaly-detection/components/monitoring/)
|
||||
|
||||
## Deep Dive into Anomaly Detection
|
||||
Enhance your knowledge with our handbook on Anomaly Detection & Root Cause Analysis and stay updated:
|
||||
|
||||
@@ -1,5 +1,5 @@
|
||||
---
|
||||
title: VictoriaMetrics Anomaly Detection
|
||||
title: Anomaly Detection
|
||||
weight: 50
|
||||
menu:
|
||||
docs:
|
||||
|
||||
@@ -226,7 +226,7 @@ models:
|
||||
queries: ['normal_behavior'] # use the default where it's not needed
|
||||
```
|
||||
|
||||
### Group By
|
||||
### Group by
|
||||
|
||||
> **Note**: The `groupby` argument works only in combination with [multivariate models](#multivariate-models).
|
||||
|
||||
@@ -264,6 +264,135 @@ models:
|
||||
groupby: [host]
|
||||
```
|
||||
|
||||
### Scale
|
||||
|
||||
Previously available only to [ProphetModel](#prophet) and [OnlineQuantileModel](#online-seasonal-quantile), the `scale` {{% available_from "v1.20.0" anomaly %}} parameter is now applicable to all models that support generating predictions (`yhat`, `yhat_lower`, `yhat_upper`). Also, it is **two-sided** now, represented as a list of two positive float values, allowing separate scaling for the intervals `[yhat, yhat_upper]` and `[yhat_lower, yhat]`. The new margins are calculated as:
|
||||
|
||||
- **Upper margin:** `|yhat_upper - yhat| * scale_upper`
|
||||
- **Lower margin:** `|yhat - yhat_lower| * scale_lower`
|
||||
|
||||
For backward compatibility, the previous format (`scale: x`) remains supported and will be automatically converted to `scale: [x, x]`.
|
||||
|
||||
For example, setting `scale: [1.2, 0.75]` for particular model will:
|
||||
- **Increase** the width of the lower confidence interval by **20%**.
|
||||
- **Decrease** the width of the upper confidence boundary by **25%**.
|
||||
|
||||
The most common **use case** is when there is a preference to **widen one side** to blacklist smaller false positives (which otherwise would have [anomaly scores](https://docs.victoriametrics.com/anomaly-detection/faq/#how-is-anomaly-score-calculated) **only slightly higher than 1.0**, still making such data points **anomalous**), while **tightening the other side** to avoid missing true positives due to an overly loose margin (leading to [anomaly scores](https://docs.victoriametrics.com/anomaly-detection/faq/#how-is-anomaly-score-calculated) being slightly less than 1.0, making such data points **non-anomalous**).
|
||||
|
||||
```yaml
|
||||
# other components like reader, writer, schedulers, monitoring ...
|
||||
models:
|
||||
zscore_no_scale:
|
||||
class: 'zscore' # or 'model.zscore.ZscoreModel' until v1.13.0
|
||||
z_threshold: 3
|
||||
# if not set, equals to [1.0, 1.0], meaning no scaling is applied
|
||||
# scale: [1.0, 1.0]
|
||||
zscore_scaled:
|
||||
class: 'zscore' # or 'model.zscore.ZscoreModel' until v1.13.0
|
||||
z_threshold: 3
|
||||
# vs `zscore_no_scale`, increase lower confidence interval width by 1.2x, decrease upper confidence width by 25%
|
||||
scale: [1.2, 0.75]
|
||||
```
|
||||
|
||||
### Clip predictions
|
||||
|
||||
A post-processing step to **clip model predictions** (`yhat`, `yhat_lower`, and `yhat_upper` series) to the configured [`data_range` values](https://docs.victoriametrics.com/anomaly-detection/components/reader/?highlight=data_range#config-parameters) in `VmReader` is available.
|
||||
|
||||
This behavior is controlled by the boolean argument `clip_predictions` {{% available_from "v1.20.0" anomaly %}}:
|
||||
- **Disabled by default** for backward compatibility.
|
||||
- **Works** for models that generate predictions and estimates (e.g., [`ProphetModel`](#prophet)) by setting `clip_predictions` to `True` for respective model in `models` section.
|
||||
|
||||
The primary use case is to **align domain knowledge** about data behavior (defined via `data_range`) with what is shown in visualizations, such as in the [Grafana dashboard](https://docs.victoriametrics.com/anomaly-detection/presets/#grafana-dashboard). This ensures that predictions (`yhat`, `yhat_lower`, `yhat_upper`) are plotted consistently alongside real metric values (`y`) and remain within reasonable expected bounds.
|
||||
|
||||
> Note: This parameter does not impact the generation of anomaly scores > 1 for datapoints where `y` falls outside the defined `data_range`.
|
||||
|
||||
```yaml
|
||||
# other components like writer, schedulers, monitoring ...
|
||||
reader:
|
||||
# ...
|
||||
queries:
|
||||
q1_clipped:
|
||||
expr: 'q1_metricsql'
|
||||
data_range: [0, "inf"]
|
||||
q2_no_clip:
|
||||
expr: 'q2_metricsql'
|
||||
# if no data range defined, it will be implicitly converted to ["-inf", "inf"]
|
||||
models:
|
||||
zscore_mixed:
|
||||
class: 'zscore' # or 'model.zscore.ZscoreModel' until v1.13.0
|
||||
z_threshold: 3
|
||||
clip_predictions: True
|
||||
queries: [
|
||||
# `yhat`, `yhat_lower`, `yhat_upper` will be within [0, inf]
|
||||
# for all `zscore_mixed` instances that are fit on series returned by `q1_clipped` query
|
||||
# anomaly scores > 1 will still be produced for `y` outside of data_range
|
||||
'q1_clipped',
|
||||
# there will be no (explicit) clip of `yhat`, `yhat_lower`, `yhat_upper`
|
||||
# for all `zscore_mixed` instances that are fit on series returned by `q2_no_clip` query
|
||||
# even when `clip_predictions` arg is set, because data_range was not set for `q2_no_clip`
|
||||
'q2_no_clip',
|
||||
]
|
||||
zscore_no_clip:
|
||||
class: 'zscore' # or 'model.zscore.ZscoreModel' until v1.13.0
|
||||
z_threshold: 3
|
||||
# if not set, by default resolved to `clip_predictions: False`
|
||||
queries: [
|
||||
# `yhat`, `yhat_lower`, `yhat_upper` won't be clipped to [0, inf]
|
||||
# even though `data_range` for `q1_clipped` is set
|
||||
# however, anomaly scores > 1 will still be produced for y outside of data_range
|
||||
'q1_clipped',
|
||||
# there will be no (explicit) clip of yhat, yhat_lower, yhat_upper
|
||||
# for all `zscore_mixed` instances that are fit on series returned by `q2_no_clip` query
|
||||
# as `clip_predictions` arg is not set, regardless of data_range for `q2_no_clip`
|
||||
'q2_no_clip',
|
||||
]
|
||||
```
|
||||
|
||||
### Score outside data range
|
||||
|
||||
The `anomaly_score_outside_data_range` {{% available_from "v1.20.0" anomaly %}} parameter allows overriding the default **anomaly score (`1.01`)** assigned when actual values (`y`) fall **outside the defined `data_range` if defined in [reader](https://docs.victoriametrics.com/anomaly-detection/components/reader/)**. This provides greater flexibility for **alerting rule configurations** and enables **clearer visual differentiation** between different types of anomalies:
|
||||
|
||||
- By default, `y` values **outside `data_range`** trigger an anomaly score of `1.01`, which serves as a basic alerting rule.
|
||||
- However, some users may require **higher anomaly scores** (e.g., `> 1.2`) to **trigger alerts reliably** in their monitoring setups.
|
||||
|
||||
**How it works**
|
||||
- If **not set**, the **default value (`1.01`)** is used for backward compatibility.
|
||||
- If defined at the **service level** (`settings`), it applies to all models **unless overridden at the model level**.
|
||||
- If set **per model**, it takes **priority over the global setting**.
|
||||
|
||||
**Example (override)**
|
||||
|
||||
```yaml
|
||||
settings:
|
||||
# other parameters ...
|
||||
# all the models in `models` section will inherit this value unless overridden at the model level
|
||||
anomaly_score_outside_data_range: 1.2
|
||||
|
||||
models:
|
||||
model_score_override:
|
||||
class: 'zscore_online'
|
||||
# explicitly set, takes priority over `settings`'s value
|
||||
anomaly_score_outside_data_range: 1.5
|
||||
model_score_from_settings_level:
|
||||
class: 'zscore_online'
|
||||
# inherits from `settings`, will be `1.2`, same as setting
|
||||
# anomaly_score_outside_data_range: 1.2
|
||||
```
|
||||
|
||||
**Example (default vs custom)**
|
||||
|
||||
```yaml
|
||||
models:
|
||||
model_default_score:
|
||||
class: 'zscore_online'
|
||||
# default anomaly score (1.01) is applied when y is outside data_range, same as setting
|
||||
# anomaly_score_outside_data_range: 1.01
|
||||
model_higher_out_of_data_range_score:
|
||||
class: 'zscore_online'
|
||||
# explicitly set, takes priority over `settings`'s value
|
||||
anomaly_score_outside_data_range: 3.0
|
||||
```
|
||||
|
||||
|
||||
## Model types
|
||||
|
||||
@@ -276,7 +405,7 @@ Each of these models can be of type
|
||||
- [Rolling](#rolling-models)
|
||||
- [Non-rolling](#non-rolling-models)
|
||||
|
||||
Moreover, starting from [v1.15.0](https://docs.victoriametrics.com/anomaly-detection/changelog/#v1150), there exist **[online (incremental) models](#online-models)** subclass. Please refer to the [correspondent section](#online-models) for more details.
|
||||
Moreover, {{% available_from "v1.15.0" anomaly %}}, there exist **[online (incremental) models](#online-models)** subclass. Please refer to the [correspondent section](#online-models) for more details.
|
||||
|
||||
### Univariate Models
|
||||
|
||||
@@ -299,7 +428,7 @@ For a multivariate type, **one shared model** is fit/used for inference on **all
|
||||
|
||||
For example, if you have some **multivariate** model to use 3 [MetricQL queries](https://docs.victoriametrics.com/metricsql/), each returning 5 time series, there will be one shared model created in total. Once fit, this model will expect **exactly 15 time series with exact same labelsets as an input**. This model will produce **one shared [output](#vmanomaly-output)**.
|
||||
|
||||
> **Note:** Starting from [v1.16.0](https://docs.victoriametrics.com/anomaly-detection/changelog#v1160), N models — one for each unique combination of label values specified in the `groupby` [common argument](#group-by) — can be trained. This allows for context separation (e.g., one model per host, region, or other relevant grouping label), leading to improved accuracy and faster training. See an example [here](#group-by).
|
||||
> **Note:** {{% available_from "v1.16.0" anomaly %}}, N models — one for each unique combination of label values specified in the `groupby` [common argument](#group-by) — can be trained. This allows for context separation (e.g., one model per host, region, or other relevant grouping label), leading to improved accuracy and faster training. See an example [here](#group-by).
|
||||
|
||||
If during an inference, you got a **different amount of series** or some series having a **new labelset** (not present in any of fitted models), the inference will be skipped until you get a model, trained particularly for such labelset during forthcoming re-fit step.
|
||||
|
||||
@@ -386,16 +515,16 @@ Every other model that isn't [online](#online-models). Offline models are comple
|
||||
## Built-in Models
|
||||
|
||||
### Overview
|
||||
VictoriaMetrics Anomaly Detection models support 2 groups of parameters:
|
||||
Built-in models support 2 groups of arguments:
|
||||
|
||||
- **`vmanomaly`-specific** arguments - please refer to *Parameters specific for vmanomaly* and *Default model parameters* subsections for each of the models below.
|
||||
- Arguments to **inner model** (say, [Facebook's Prophet](https://facebook.github.io/prophet/docs/quick_start#python-api)), passed in a `args` argument as key-value pairs, that will be directly given to the model during initialization to allow granular control. Optional.
|
||||
- Arguments to **inner model** (say, [Facebook's Prophet](https://facebook.github.io/prophet/docs/quick_start#python-api)), passed inside `args` argument as key-value pairs, that will be directly given to the model during initialization to allow granular control. Optional.
|
||||
|
||||
> **Note**: For users who may not be familiar with Python data types such as `list[dict]`, a [dictionary](https://www.w3schools.com/python/python_dictionaries.asp) in Python is a data structure that stores data values in key-value pairs. This structure allows for efficient data retrieval and management.
|
||||
|
||||
|
||||
**Models**:
|
||||
* [AutoTuned](#autotuned) - designed to take the cognitive load off the user, allowing any of built-in models below to be re-tuned for best params on data seen during each `fit` phase of the algorithm. Tradeoff is between increased computational time and optimized results / simpler maintenance.
|
||||
* [AutoTuned](#autotuned) - designed to take the cognitive load off the user, allowing any of built-in models below to be re-tuned for best hyperparameters on data seen during each `fit` phase of the algorithm. Tradeoff is between increased computational time and optimized results / simpler maintenance.
|
||||
* [Prophet](#prophet) - the most versatile one for production usage, especially for complex data ([trends](https://victoriametrics.com/blog/victoriametrics-anomaly-detection-handbook-chapter-1/#trend), [change points](https://victoriametrics.com/blog/victoriametrics-anomaly-detection-handbook-chapter-2/#novelties), [multi-seasonality](https://victoriametrics.com/blog/victoriametrics-anomaly-detection-handbook-chapter-1/#seasonality))
|
||||
* [Z-score](#z-score) - useful for initial testing and for simpler data ([de-trended](https://victoriametrics.com/blog/victoriametrics-anomaly-detection-handbook-chapter-1/#trend) data without strict [seasonality](https://victoriametrics.com/blog/victoriametrics-anomaly-detection-handbook-chapter-1/#seasonality) and with anomalies of similar magnitude as your "normal" data)
|
||||
* [Online Z-score](#online-z-score) - [online](#online-models) alternative to [Z-score](#z-score) model with exact same behavior and use cases.
|
||||
@@ -418,7 +547,7 @@ Tuning hyperparameters of a model can be tricky and often requires in-depth know
|
||||
* `tuned_class_name` (string) - Built-in model class to tune, i.e. `model.zscore.ZscoreModel` (or `zscore`with class alias support{{% available_from "v1.13.0" anomaly %}}).
|
||||
* `optimization_params` (dict) - Optimization parameters for unsupervised model tuning. Control % of found anomalies, as well as a tradeoff between time spent and the accuracy. The more `timeout` and `n_trials` are, the better model configuration can be found for `tuned_class_name`, but the longer it takes and vice versa. Set `n_jobs` to `-1` to use all the CPUs available, it makes sense if only you have a big dataset to train on during `fit` calls, otherwise overhead isn't worth it.
|
||||
- `anomaly_percentage` (float) - Expected percentage of anomalies that can be seen in training data, from (0, 0.5) interval.
|
||||
- `optimized_business_params` (list[string]) - Starting from [v1.15.0](https://docs.victoriametrics.com/anomaly-detection/changelog/#v1150) this argument allows particular business-specific parameters such as [`detection_direction`](https://docs.victoriametrics.com/anomaly-detection/components/models/#detection-direction) or [`min_dev_from_expected`](https://docs.victoriametrics.com/anomaly-detection/components/models/#minimal-deviation-from-expected) to remain **unchanged during optimizations, retaining their default values**. I.e. setting `optimized_business_params` to `['detection_direction']` will allow to optimize only `detection_direction` business-specific arg, while `min_dev_from_expected` will retain its default value (0.0). By default and if not set, will be equal to `[]` (empty list), meaning no business params will be optimized. **A recommended option is to leave it empty** for more stable results and increased convergence (less iterations needed for a good result).
|
||||
- `optimized_business_params` (list[string]) - {{% available_from "v1.15.0" anomaly %}} this argument allows particular business-specific parameters such as [`detection_direction`](https://docs.victoriametrics.com/anomaly-detection/components/models/#detection-direction) or [`min_dev_from_expected`](https://docs.victoriametrics.com/anomaly-detection/components/models/#minimal-deviation-from-expected) to remain **unchanged during optimizations, retaining their default values**. I.e. setting `optimized_business_params` to `['detection_direction']` will allow to optimize only `detection_direction` business-specific arg, while `min_dev_from_expected` will retain its default value (0.0). By default and if not set, will be equal to `[]` (empty list), meaning no business params will be optimized. **A recommended option is to leave it empty** for more stable results and increased convergence (less iterations needed for a good result).
|
||||
- `seed` (int) - Random seed for reproducibility and deterministic nature of underlying optimizations.
|
||||
- `n_splits` (int) - How many folds to create for hyperparameter tuning out of your data. The higher, the longer it takes but the better the results can be. Defaults to 3.
|
||||
- `n_trials` (int) - How many trials to sample from hyperparameter search space. The higher, the longer it takes but the better the results can be. Defaults to 128.
|
||||
@@ -453,19 +582,17 @@ models:
|
||||
### [Prophet](https://facebook.github.io/prophet/)
|
||||
`vmanomaly` uses the Facebook Prophet implementation for time series forecasting, with detailed usage provided in the [Prophet library documentation](https://facebook.github.io/prophet/docs/quick_start#python-api). All original Prophet parameters are supported and can be directly passed to the model via `args` argument.
|
||||
|
||||
|
||||
> **Note**: `ProphetModel` is a [univariate](#univariate-models), [non-rolling](#non-rolling-models), [offline](#offline-models) model.
|
||||
|
||||
|
||||
> **Note**: Starting with [v1.18.2](https://docs.victoriametrics.com/anomaly-detection/changelog/#v1182), the format for `tz_seasonalities` has been updated to enhance flexibility. Previously, it accepted a list of strings (e.g., `['hod', 'minute']`). Now, it follows the same structure as custom seasonalities defined in the `seasonalities` argument (e.g., `{"name": "hod", "fourier_order": 5, "mode": "additive"}`). This change is backward-compatible, so older configurations will be automatically converted to the new format using default values.
|
||||
> **Note**: {{% available_from "v1.18.2" anomaly %}} the format for `tz_seasonalities` has been updated to enhance flexibility. Previously, it accepted a list of strings (e.g., `['hod', 'minute']`). Now, it follows the same structure as custom seasonalities defined in the `seasonalities` argument (e.g., `{"name": "hod", "fourier_order": 5, "mode": "additive"}`). This change is backward-compatible, so older configurations will be automatically converted to the new format using default values.
|
||||
|
||||
*Parameters specific for vmanomaly*:
|
||||
|
||||
- `class` (string) - model class name `"model.prophet.ProphetModel"` (or `prophet` with class alias support{{% available_from "v1.13.0" anomaly %}})
|
||||
- `seasonalities` (list[dict], optional): Additional seasonal components to include in Prophet. See Prophet’s [`add_seasonality()`](https://facebook.github.io/prophet/docs/seasonality,_holiday_effects,_and_regressors#modeling-holidays-and-special-events:~:text=modeling%20the%20cycle-,Specifying,-Custom%20Seasonalities) documentation for details.
|
||||
- `scale`{{% available_from "v1.18.0" anomaly %}} (float): Is used to adjust the margin between `yhat` and [`yhat_lower`, `yhat_upper`]. New margin = `|yhat_* - yhat_lower| * scale`. Defaults to 1 (no scaling is applied).
|
||||
- `scale`{{% available_from "v1.18.0" anomaly %}} (float): Is used to adjust the margins between `yhat` and [`yhat_lower`, `yhat_upper`]. New margin = `|yhat_* - yhat_lower| * scale`. Defaults to 1 (no scaling is applied). See `scale`[common arg](https://docs.victoriametrics.com/anomaly-detection/components/models/#scale) section for detailed instructions and 2-sided option.
|
||||
- `tz_aware`{{% available_from "v1.18.0" anomaly %}} (bool): Enables handling of timezone-aware timestamps. Default is `False`. Should be used with `tz_seasonalities` and `tz_use_cyclical_encoding` parameters.
|
||||
- `tz_seasonalities`{{% available_from "v1.18.0" anomaly %}} (list[dict]): Specifies timezone-aware seasonal components. Requires `tz_aware=True`. Supported options include `minute`, `hod` (hour of day), `dow` (day of week), and `month` (month of year). Starting with [v1.18.2](https://docs.victoriametrics.com/anomaly-detection/changelog/#v1182), users can configure additional parameters for each seasonality, such as `fourier_order`, `prior_scale`, and `mode`. For more details, please refer to the **Timezone-unaware** configuration example below.
|
||||
- `tz_seasonalities`{{% available_from "v1.18.0" anomaly %}} (list[dict]): Specifies timezone-aware seasonal components. Requires `tz_aware=True`. Supported options include `minute`, `hod` (hour of day), `dow` (day of week), and `month` (month of year). {{% available_from "v1.18.2" anomaly %}} users can configure additional parameters for each seasonality, such as `fourier_order`, `prior_scale`, and `mode`. For more details, please refer to the **Timezone-unaware** configuration example below.
|
||||
- `tz_use_cyclical_encoding`{{% available_from "v1.18.0" anomaly %}} (bool): If set to `True`, applies [cyclical encoding technique](https://www.kaggle.com/code/avanwyk/encoding-cyclical-features-for-deep-learning) to timezone-aware seasonalities. Should be used with `tz_aware=True` and `tz_seasonalities`.
|
||||
|
||||
> **Note**: Apart from standard [`vmanomaly` output](#vmanomaly-output), Prophet model can provide additional metrics.
|
||||
@@ -489,6 +616,17 @@ models:
|
||||
your_desired_alias_for_a_model:
|
||||
class: 'prophet' # or 'model.prophet.ProphetModel' until v1.13.0
|
||||
provide_series: ['anomaly_score', 'yhat', 'yhat_lower', 'yhat_upper', 'trend']
|
||||
# Common arguments for built-in model, if not set, default to
|
||||
# See https://docs.victoriametrics.com/anomaly-detection/components/models/#common-args
|
||||
#
|
||||
# provide_series: ['anomaly_score', 'yhat', 'yhat_lower', 'yhat_upper', 'trend']
|
||||
# schedulers: [all scheduler aliases defined in `scheduler` section]
|
||||
# queries: [all query aliases defined in `reader.queries` section]
|
||||
# detection_direction: 'both' # meaning both drops and spikes will be captured
|
||||
# min_dev_from_expected: 0.0 # meaning, no minimal threshold is applied to prevent smaller anomalies
|
||||
# scale: [1.0, 1.0] # if needed, prediction intervals' width can be increased (>1) or narrowed (<1)
|
||||
# clip_predictions: False # if data_range for respective `queries` is set in reader, `yhat.*` columns will be clipped
|
||||
# anomaly_score_outside_data_range: 1.01 # auto anomaly score (1.01) if `y` (real value) is outside of data_range, if set
|
||||
seasonalities:
|
||||
- name: 'hourly'
|
||||
period: 0.04166666666
|
||||
@@ -508,6 +646,17 @@ models:
|
||||
your_desired_alias_for_a_model:
|
||||
class: 'prophet' # or 'model.prophet.ProphetModel' until v1.13.0
|
||||
provide_series: ['anomaly_score', 'yhat', 'yhat_lower', 'yhat_upper', 'trend']
|
||||
# Common arguments for built-in model, if not set, default to
|
||||
# See https://docs.victoriametrics.com/anomaly-detection/components/models/#common-args
|
||||
#
|
||||
# provide_series: ['anomaly_score', 'yhat', 'yhat_lower', 'yhat_upper', 'trend']
|
||||
# schedulers: [all scheduler aliases defined in `scheduler` section]
|
||||
# queries: [all query aliases defined in `reader.queries` section]
|
||||
# detection_direction: 'both' # meaning both drops and spikes will be captured
|
||||
# min_dev_from_expected: 0.0 # meaning, no minimal threshold is applied to prevent smaller anomalies
|
||||
# scale: [1.0, 1.0] # if needed, prediction intervals' width can be increased (>1) or narrowed (<1)
|
||||
# clip_predictions: False # if data_range for respective `queries` is set in reader, `yhat.*` columns will be clipped
|
||||
# anomaly_score_outside_data_range: 1.01 # auto anomaly score (1.01) if `y` (real value) is outside of data_range, if set
|
||||
tz_aware: True
|
||||
tz_use_cyclical_encoding: True
|
||||
tz_seasonalities: # intra-day + intra-week seasonality, no intra-year / sub-hour seasonality
|
||||
@@ -544,6 +693,17 @@ models:
|
||||
your_desired_alias_for_a_model:
|
||||
class: "zscore" # or 'model.zscore.ZscoreModel' until v1.13.0
|
||||
z_threshold: 3.5
|
||||
# Common arguments for built-in model, if not set, default to
|
||||
# See https://docs.victoriametrics.com/anomaly-detection/components/models/#common-args
|
||||
#
|
||||
# provide_series: ['anomaly_score', 'yhat', 'yhat_lower', 'yhat_upper']
|
||||
# schedulers: [all scheduler aliases defined in `scheduler` section]
|
||||
# queries: [all query aliases defined in `reader.queries` section]
|
||||
# detection_direction: 'both' # meaning both drops and spikes will be captured
|
||||
# min_dev_from_expected: 0.0 # meaning, no minimal threshold is applied to prevent smaller anomalies
|
||||
# scale: [1.0, 1.0] # if needed, prediction intervals' width can be increased (>1) or narrowed (<1)
|
||||
# clip_predictions: False # if data_range for respective `queries` is set in reader, `yhat.*` columns will be clipped
|
||||
# anomaly_score_outside_data_range: 1.01 # auto anomaly score (1.01) if `y` (real value) is outside of data_range, if set
|
||||
```
|
||||
|
||||
Resulting metrics of the model are described [here](#vmanomaly-output).
|
||||
@@ -569,6 +729,17 @@ models:
|
||||
z_threshold: 3.5
|
||||
min_n_samples_seen: 128 # i.e. calculate it as full seasonality / data freq
|
||||
provide_series: ['anomaly_score', 'yhat'] # common arg example
|
||||
# Common arguments for built-in model, if not set, default to
|
||||
# See https://docs.victoriametrics.com/anomaly-detection/components/models/#common-args
|
||||
#
|
||||
# provide_series: ['anomaly_score', 'yhat', 'yhat_lower', 'yhat_upper']
|
||||
# schedulers: [all scheduler aliases defined in `scheduler` section]
|
||||
# queries: [all query aliases defined in `reader.queries` section]
|
||||
# detection_direction: 'both' # meaning both drops and spikes will be captured
|
||||
# min_dev_from_expected: 0.0 # meaning, no minimal threshold is applied to prevent smaller anomalies
|
||||
# scale: [1.0, 1.0] # if needed, prediction intervals' width can be increased (>1) or narrowed (<1)
|
||||
# clip_predictions: False # if data_range for respective `queries` is set in reader, `yhat.*` columns will be clipped
|
||||
# anomaly_score_outside_data_range: 1.01 # auto anomaly score (1.01) if `y` (real value) is outside of data_range, if set
|
||||
```
|
||||
|
||||
Resulting metrics of the model are described [here](#vmanomaly-output).
|
||||
@@ -614,6 +785,17 @@ models:
|
||||
args:
|
||||
seasonal: 'add'
|
||||
initialization_method: 'estimated'
|
||||
# Common arguments for built-in model, if not set, default to
|
||||
# See https://docs.victoriametrics.com/anomaly-detection/components/models/#common-args
|
||||
#
|
||||
# provide_series: ['anomaly_score', 'yhat', 'yhat_lower', 'yhat_upper']
|
||||
# schedulers: [all scheduler aliases defined in `scheduler` section]
|
||||
# queries: [all query aliases defined in `reader.queries` section]
|
||||
# detection_direction: 'both' # meaning both drops and spikes will be captured
|
||||
# min_dev_from_expected: 0.0 # meaning, no minimal threshold is applied to prevent smaller anomalies
|
||||
# scale: [1.0, 1.0] # if needed, prediction intervals' width can be increased (>1) or narrowed (<1)
|
||||
# clip_predictions: False # if data_range for respective `queries` is set in reader, `yhat.*` columns will be clipped
|
||||
# anomaly_score_outside_data_range: 1.01 # auto anomaly score (1.01) if `y` (real value) is outside of data_range, if set
|
||||
```
|
||||
|
||||
|
||||
@@ -639,6 +821,17 @@ models:
|
||||
your_desired_alias_for_a_model:
|
||||
class: "mad" # or 'model.mad.MADModel' until v1.13.0
|
||||
threshold: 2.5
|
||||
# Common arguments for built-in model, if not set, default to
|
||||
# See https://docs.victoriametrics.com/anomaly-detection/components/models/#common-args
|
||||
#
|
||||
# provide_series: ['anomaly_score', 'yhat', 'yhat_lower', 'yhat_upper']
|
||||
# schedulers: [all scheduler aliases defined in `scheduler` section]
|
||||
# queries: [all query aliases defined in `reader.queries` section]
|
||||
# detection_direction: 'both' # meaning both drops and spikes will be captured
|
||||
# min_dev_from_expected: 0.0 # meaning, no minimal threshold is applied to prevent smaller anomalies
|
||||
# scale: [1.0, 1.0] # if needed, prediction intervals' width can be increased (>1) or narrowed (<1)
|
||||
# clip_predictions: False # if data_range for respective `queries` is set in reader, `yhat.*` columns will be clipped
|
||||
# anomaly_score_outside_data_range: 1.01 # auto anomaly score (1.01) if `y` (real value) is outside of data_range, if set
|
||||
```
|
||||
|
||||
Resulting metrics of the model are described [here](#vmanomaly-output).
|
||||
@@ -668,6 +861,17 @@ models:
|
||||
min_n_samples_seen: 128 # i.e. calculate it as full seasonality / data freq
|
||||
compression: 100 # higher values mean higher accuracy but higher memory usage
|
||||
provide_series: ['anomaly_score', 'yhat'] # common arg example
|
||||
# Common arguments for built-in model, if not set, default to
|
||||
# See https://docs.victoriametrics.com/anomaly-detection/components/models/#common-args
|
||||
#
|
||||
# provide_series: ['anomaly_score', 'yhat', 'yhat_lower', 'yhat_upper']
|
||||
# schedulers: [all scheduler aliases defined in `scheduler` section]
|
||||
# queries: [all query aliases defined in `reader.queries` section]
|
||||
# detection_direction: 'both' # meaning both drops and spikes will be captured
|
||||
# min_dev_from_expected: 0.0 # meaning, no minimal threshold is applied to prevent smaller anomalies
|
||||
# scale: [1.0, 1.0] # if needed, prediction intervals' width can be increased (>1) or narrowed (<1)
|
||||
# clip_predictions: False # if data_range for respective `queries` is set in reader, `yhat.*` columns will be clipped
|
||||
# anomaly_score_outside_data_range: 1.01 # auto anomaly score (1.01) if `y` (real value) is outside of data_range, if set
|
||||
```
|
||||
|
||||
Resulting metrics of the model are described [here](#vmanomaly-output).
|
||||
@@ -693,6 +897,17 @@ models:
|
||||
class: "rolling_quantile" # or 'model.rolling_quantile.RollingQuantileModel' until v1.13.0
|
||||
quantile: 0.9
|
||||
window_steps: 96
|
||||
# Common arguments for built-in model, if not set, default to
|
||||
# See https://docs.victoriametrics.com/anomaly-detection/components/models/#common-args
|
||||
#
|
||||
# provide_series: ['anomaly_score', 'yhat', 'yhat_lower', 'yhat_upper']
|
||||
# schedulers: [all scheduler aliases defined in `scheduler` section]
|
||||
# queries: [all query aliases defined in `reader.queries` section]
|
||||
# detection_direction: 'both' # meaning both drops and spikes will be captured
|
||||
# min_dev_from_expected: 0.0 # meaning, no minimal threshold is applied to prevent smaller anomalies
|
||||
# scale: [1.0, 1.0] # if needed, prediction intervals' width can be increased (>1) or narrowed (<1)
|
||||
# clip_predictions: False # if data_range for respective `queries` is set in reader, `yhat.*` columns will be clipped
|
||||
# anomaly_score_outside_data_range: 1.01 # auto anomaly score (1.01) if `y` (real value) is outside of data_range, if set
|
||||
```
|
||||
|
||||
Resulting metrics of the model are described [here](#vmanomaly-output).
|
||||
@@ -716,7 +931,7 @@ It uses the `quantiles` triplet to calculate `yhat_lower`, `yhat`, and `yhat_upp
|
||||
* `min_subseason` (str, optional) - the minimum interval to estimate quantiles for. By default not set. Note that the minimum interval should be a multiple of the seasonal interval, i.e. if seasonal_interval='2h', then min_subseason='15m' is valid, but '37m' is not.
|
||||
* `use_transform` (bool, optional) - whether to internally apply a `log1p(abs(x)) * sign(x)` transformation to the data to stabilize internal quantile estimation. Does not affect the scale of produced output (i.e. `yhat`) By default False.
|
||||
* `global_smoothing` (float, optional) - the smoothing parameter for the global quantiles. i.e. the output is a weighted average of the global and seasonal quantiles (if `seasonal_interval` and `min_subseason` args are set). Should be from `[0, 1]` interval, where 0 means no smoothing and 1 means using only global quantile values.
|
||||
* `scale` (float, optional) - the scaling factor for the `yhat_lower` and `yhat_upper` quantiles. By default 1.0 (no scaling). if > 1, increases the boundaries [`yhat_lower`, `yhat_upper`] that define "non-anomalous" points. Should be > 0.
|
||||
* `scale` (float, optional) - Is used to adjust the margins between `yhat` and [`yhat_lower`, `yhat_upper`]. New margin = `|yhat_* - yhat_lower| * scale`. Defaults to 1 (no scaling is applied). See `scale`[common arg](https://docs.victoriametrics.com/anomaly-detection/components/models/#scale) section for detailed instructions and 2-sided option.
|
||||
* `season_starts_from` (str, optional) - the start date for the seasonal adjustment, as a reference point to start counting the intervals. By default '1970-01-01'.
|
||||
* `min_n_samples_seen` (int, optional) - the minimum number of samples to be seen (`n_samples_seen_` property) before computing the anomaly score. Otherwise, the **anomaly score will be 0**, as there is not enough data to trust the model's predictions. Defaults to 16.
|
||||
* `compression` (int, optional) - the compression parameter for the underlying [t-digests](https://www.sciencedirect.com/science/article/pii/S2665963820300403). Higher values mean higher accuracy but higher memory usage. By default 100.
|
||||
@@ -737,6 +952,17 @@ models:
|
||||
season_starts_from: '2024-01-01' # interval calculation starting point, especially for uncommon seasonalities like '36h' or '12d'
|
||||
compression: 100 # higher values mean higher accuracy but higher memory usage
|
||||
provide_series: ['anomaly_score', 'yhat'] # common arg example
|
||||
# Common arguments for built-in model, if not set, default to
|
||||
# See https://docs.victoriametrics.com/anomaly-detection/components/models/#common-args
|
||||
#
|
||||
# provide_series: ['anomaly_score', 'yhat', 'yhat_lower', 'yhat_upper']
|
||||
# schedulers: [all scheduler aliases defined in `scheduler` section]
|
||||
# queries: [all query aliases defined in `reader.queries` section]
|
||||
# detection_direction: 'both' # meaning both drops and spikes will be captured
|
||||
# min_dev_from_expected: 0.0 # meaning, no minimal threshold is applied to prevent smaller anomalies
|
||||
# scale: [1.0, 1.0] # if needed, prediction intervals' width can be increased (>1) or narrowed (<1)
|
||||
# clip_predictions: False # if data_range for respective `queries` is set in reader, `yhat.*` columns will be clipped
|
||||
# anomaly_score_outside_data_range: 1.01 # auto anomaly score (1.01) if `y` (real value) is outside of data_range, if set
|
||||
```
|
||||
|
||||
Resulting metrics of the model are described [here](#vmanomaly-output).
|
||||
@@ -763,6 +989,17 @@ models:
|
||||
your_desired_alias_for_a_model:
|
||||
class: "std" # or 'model.std.StdModel' starting from v1.13.0
|
||||
period: 2
|
||||
# Common arguments for built-in model, if not set, default to
|
||||
# See https://docs.victoriametrics.com/anomaly-detection/components/models/#common-args
|
||||
#
|
||||
# provide_series: ['anomaly_score', 'yhat', 'yhat_lower', 'yhat_upper']
|
||||
# schedulers: [all scheduler aliases defined in `scheduler` section]
|
||||
# queries: [all query aliases defined in `reader.queries` section]
|
||||
# detection_direction: 'both' # meaning both drops and spikes will be captured
|
||||
# min_dev_from_expected: 0.0 # meaning, no minimal threshold is applied to prevent smaller anomalies
|
||||
# scale: [1.0, 1.0] # if needed, prediction intervals' width can be increased (>1) or narrowed (<1)
|
||||
# clip_predictions: False # if data_range for respective `queries` is set in reader, `yhat.*` columns will be clipped
|
||||
# anomaly_score_outside_data_range: 1.01 # auto anomaly score (1.01) if `y` (real value) is outside of data_range, if set
|
||||
```
|
||||
|
||||
|
||||
@@ -818,6 +1055,13 @@ models:
|
||||
n_estimators: 100
|
||||
# i.e. to assure reproducibility of produced results each time model is fit on the same input
|
||||
random_state: 42
|
||||
# Common arguments for built-in model, if not set, default to
|
||||
# See https://docs.victoriametrics.com/anomaly-detection/components/models/#common-args
|
||||
#
|
||||
# provide_series: ['anomaly_score', 'yhat', 'yhat_lower', 'yhat_upper']
|
||||
# schedulers: [all scheduler aliases defined in `scheduler` section]
|
||||
# queries: [all query aliases defined in `reader.queries` section]
|
||||
# anomaly_score_outside_data_range: 1.01 # auto anomaly score (1.01) if `y` (real value) is outside of data_range, if set
|
||||
```
|
||||
|
||||
|
||||
@@ -994,7 +1238,7 @@ monitoring:
|
||||
Let's pull the docker image for `vmanomaly`:
|
||||
|
||||
```sh
|
||||
docker pull victoriametrics/vmanomaly:v1.19.2
|
||||
docker pull victoriametrics/vmanomaly:v1.20.0
|
||||
```
|
||||
|
||||
Now we can run the docker container putting as volumes both config and model file:
|
||||
@@ -1008,7 +1252,7 @@ docker run -it \
|
||||
-v $(PWD)/license:/license \
|
||||
-v $(PWD)/custom_model.py:/vmanomaly/model/custom.py \
|
||||
-v $(PWD)/custom.yaml:/config.yaml \
|
||||
victoriametrics/vmanomaly:v1.19.2 /config.yaml \
|
||||
victoriametrics/vmanomaly:v1.20.0 /config.yaml \
|
||||
--licenseFile=/license
|
||||
```
|
||||
|
||||
|
||||
@@ -387,7 +387,7 @@ services:
|
||||
restart: always
|
||||
vmanomaly:
|
||||
container_name: vmanomaly
|
||||
image: victoriametrics/vmanomaly:v1.19.2
|
||||
image: victoriametrics/vmanomaly:v1.20.0
|
||||
depends_on:
|
||||
- "victoriametrics"
|
||||
ports:
|
||||
|
||||
@@ -18,28 +18,44 @@ See also [LTS releases](https://docs.victoriametrics.com/lts-releases/).
|
||||
|
||||
## tip
|
||||
|
||||
## [v1.113.0](https://github.com/VictoriaMetrics/VictoriaMetrics/releases/tag/v1.113.0)
|
||||
|
||||
Released at 2025-03-07
|
||||
|
||||
**Update note 1: [vmsingle](https://docs.victoriametrics.com/single-server-victoriametrics/) and [vmagent](https://docs.victoriametrics.com/vmagent/) include a fix which enforces IPv6 addresses escaping for containers discovered with [Kubernetes service-discovery](https://docs.victoriametrics.com/sd_configs/#kubernetes_sd_configs) and `role: pod` which do not have exposed ports defined. This means that `address` for these containers will always be wrapped in square brackets, this might affect some relabeling rules which were relying on previous behaviour.**
|
||||
**Update note 2: [vmalert](https://docs.victoriametrics.com/vmalert/) disallow using [time buckets stats pipe](https://docs.victoriametrics.com/victorialogs/logsql/#stats-by-time-buckets) in alerting or recording rules with VictoriaLogs as datasource. Time buckets used with [stats query API](https://docs.victoriametrics.com/victorialogs/querying/#querying-log-stats) may produce unexpected results for user and result into cardinality issues.**
|
||||
|
||||
**Update note 2: [vmalert](https://docs.victoriametrics.com/vmalert/) disallows using [time buckets stats pipe](https://docs.victoriametrics.com/victorialogs/logsql/#stats-by-time-buckets) in alerting or recording rules with VictoriaLogs as datasource. Time buckets used with [stats query API](https://docs.victoriametrics.com/victorialogs/querying/#querying-log-stats) may produce unexpected results for user and result into cardinality issues.**
|
||||
|
||||
**Update note 3: [vmalert](https://docs.victoriametrics.com/vmalert/) disallows specifying `eval_offset` and `eval_delay` options in the same [group](https://docs.victoriametrics.com/vmalert/#groups). The `eval_offset` option ensures the group is evaluated at the exact offset in the range of [0...interval]. However, with `eval_delay`, this behavior cannot be guaranteed without further adjusting the evaluation time, which could lead to more confusion.**
|
||||
|
||||
* FEATURE: upgrade Go builder from Go1.23.6 to Go1.24. See [Go1.24 release notes](https://tip.golang.org/doc/go1.24).
|
||||
* FEATURE: provide alternative registry for all VictoriaMetrics components at [Quay.io](https://quay.io/organization/victoriametrics).
|
||||
* FEATURE: [vmsingle](https://docs.victoriametrics.com/single-server-victoriametrics/) and `vmstorage` in [VictoriaMetrics cluster](https://docs.victoriametrics.com/cluster-victoriametrics/): add a new flag `--storage.trackMetricNamesStats` and a new HTTP API - `/api/v1/status/metric_names_stats`. It allows to track how frequent ingested [metric names](https://docs.victoriametrics.com/keyconcepts/#structure-of-a-metric) are used during [querying](https://docs.victoriametrics.com/keyconcepts/#query-data). See [this issue](https://github.com/VictoriaMetrics/VictoriaMetrics/issues/4458) for details and related [docs](https://docs.victoriametrics.com/#track-ingested-metrics-usage)
|
||||
* FEATURE: [data ingestion](https://docs.victoriametrics.com/victorialogs/data-ingestion/): make `KeyValueList`, `ArrayValue` [OpenTelemetry protocol for metrics](https://docs.victoriametrics.com/#sending-data-via-opentelemetry) attributes label values compatible with open-telemetry-collector format. See [this issue](https://github.com/VictoriaMetrics/VictoriaMetrics/issues/8384).
|
||||
* FEATURE: [vmalert](https://docs.victoriametrics.com/vmalert/): disallow using [time buckets stats pipe](https://docs.victoriametrics.com/victorialogs/logsql/#stats-by-time-buckets) in VictoriaLogs rule expressions. Such construction produces meaningless results for [stats query API](https://docs.victoriametrics.com/victorialogs/querying/#querying-log-stats) and may lead to cardinality issues.
|
||||
* FEATURE: [vmalert](https://docs.victoriametrics.com/vmalert/): remove random sleep before a group starts when `eval_offset` is specified, because `eval_offset` already disperses the group evaluation time, serving the same purpose as the random sleep. This change also enables chaining groups, see [this doc](https://docs.victoriametrics.com/vmalert/#chaining-groups) and [this issue](https://github.com/VictoriaMetrics/VictoriaMetrics/issues/860).
|
||||
* FEATURE: [vmalert-tool](https://docs.victoriametrics.com/vmalert-tool/): add command-line flag `-httpListenPort` to specify the port used during testing. If not provided, a random unoccupied port will be assigned. See [this issue](https://github.com/VictoriaMetrics/VictoriaMetrics/issues/8393).
|
||||
* FEATURE: [vmalert-tool](https://docs.victoriametrics.com/vmalert-tool/): make the temporary storage path for unittest unique, allowing user to run multiple vmalert-tool processes on a single host simultaneously. See [this issue](https://github.com/VictoriaMetrics/VictoriaMetrics/issues/8393).
|
||||
* FEATURE: [alerts](https://github.com/VictoriaMetrics/VictoriaMetrics/blob/master/deployment/docker/rules/alerts-vmalert.yml): add alerting rule `TooHighQueryLoad` to notify user when VictoriaMetrics or vmselect weren't able to serve requests in timely manner during last 15min.
|
||||
* FEATURE: [dashboards/single](https://grafana.com/grafana/dashboards/10229) and [dashboards/cluster](https://grafana.com/grafana/dashboards/11176): add panel `Deduplication rate` that shows how many samples are [deduplicated](https://docs.victoriametrics.com/#deduplication) during merges or read queries by VictoriaMetrics components.
|
||||
* FEATURE: [dashboards/single](https://grafana.com/grafana/dashboards/10229) and [dashboards/cluster](https://grafana.com/grafana/dashboards/11176): add panel `Number of snapshots` that shows the max number of [snapshots](https://docs.victoriametrics.com/#how-to-work-with-snapshots) across vmstorage nodes. This panel should help in disk usage [troubleshooting](https://docs.victoriametrics.com/#snapshot-troubleshooting).
|
||||
* FEATURE: [dashboards/single](https://grafana.com/grafana/dashboards/10229) and [dashboards/cluster](https://grafana.com/grafana/dashboards/11176): account for samples dropped according to [relabeling config](https://docs.victoriametrics.com/#relabeling) in `Samples dropped for last 1h` panel.
|
||||
* FEATURE: [dashboards/single](https://grafana.com/grafana/dashboards/10229) and [dashboards/cluster](https://grafana.com/grafana/dashboards/11176): show number of parts in the last partition on `LSM parts max by type` panel. Before, the resulting graph could be skewed by the max number of parts across all partitions. Displaying parts for the latest partition is the correct way to show if storage is currently impacted by merge delays.
|
||||
* FEATURE: [dashboards/cluster](https://grafana.com/grafana/dashboards/11176): add panel `Partial query results` that shows the number of served [partial responses](https://docs.victoriametrics.com/cluster-victoriametrics/#cluster-availability) by vmselects.
|
||||
* FEATURE: provide alternative registry for all VictoriaMetrics components at [Quay.io](https://quay.io/organization/victoriametrics).
|
||||
* FEATURE: [vmalert-tool](https://docs.victoriametrics.com/vmalert-tool/): add command-line flag `-httpListenPort` to specify the port used during testing. If not provided, a random unoccupied port will be assigned. See [this issue](https://github.com/VictoriaMetrics/VictoriaMetrics/issues/8393).
|
||||
* FEATURE: [vmalert-tool](https://docs.victoriametrics.com/vmalert-tool/): make the temporary storage path for unittest unique, allowing user to run multiple vmalert-tool processes on a single host simultaneously. See [this issue](https://github.com/VictoriaMetrics/VictoriaMetrics/issues/8393).
|
||||
* FEATURE: [vmalert](https://docs.victoriametrics.com/vmalert/): disallow using [time buckets stats pipe](https://docs.victoriametrics.com/victorialogs/logsql/#stats-by-time-buckets) in VictoriaLogs rule expressions. Such construction produces meaningless results for [stats query API](https://docs.victoriametrics.com/victorialogs/querying/#querying-log-stats) and may lead to cardinality issues.
|
||||
|
||||
* BUGFIX: [Single-node VictoriaMetrics](https://docs.victoriametrics.com/) and [vmstorage](https://docs.victoriametrics.com/victoriametrics/): fix the incorrect caching of extMetricsIDs when a query timeout error occurs. This can lead to incorrect query results. Thanks to @changshun-shi for [the bug report issue](https://github.com/VictoriaMetrics/VictoriaMetrics/issues/8345).
|
||||
* BUGFIX: [vmctl](https://docs.victoriametrics.com/vmctl/): respect time filter when exploring time series for [influxdb mode](https://docs.victoriametrics.com/vmctl/#migrating-data-from-influxdb-1x). See [this issue](https://github.com/VictoriaMetrics/VictoriaMetrics/issues/8259) for details.
|
||||
* BUGFIX: [vmsingle](https://docs.victoriametrics.com/single-server-victoriametrics/): properly apply global relabeling configuration, defined with `-relabelConfig` flag, for metrics scrapped with `-promscrape.config`. Bug was introduces in [v1.108.0](https://github.com/VictoriaMetrics/VictoriaMetrics/releases/tag/v1.108.0). See [this issue](https://github.com/VictoriaMetrics/VictoriaMetrics/issues/8389).
|
||||
* BUGFIX: [vmbackupmanager](https://docs.victoriametrics.com/vmbackupmanager/): properly propagate an error message when applying retention policy fails. Previously, an actual error messages was discarded.
|
||||
* BUGFIX: [vmgateway](https://docs.victoriametrics.com/vmgateway): fix data query in [rate limiter](https://docs.victoriametrics.com/vmgateway/#rate-limiter). The bug was introduced in [this commit](https://github.com/VictoriaMetrics/VictoriaMetrics/commit/68bad22fd26d1436ad0236b1f3ced8604c5d851c) starting from [v1.106.0](https://github.com/VictoriaMetrics/VictoriaMetrics/releases/tag/v1.106.0).
|
||||
* BUGFIX: [vmgateway](https://docs.victoriametrics.com/vmgateway): properly apply the [rate limiter](https://docs.victoriametrics.com/vmgateway/#rate-limiter) for the `rows_inserted` limit type. Previously, the rate limit for this type was ignored.
|
||||
* BUGFIX: [vmgateway](https://docs.victoriametrics.com/vmgateway): properly handle HTTP requests with path ending with a trailing `/` when using the [rate limiter](https://docs.victoriametrics.com/vmgateway/#rate-limiter). Previously, the trailing slash was removed and caused an incorrect redirect path when visiting VMUI. Thanks to @jindov for [the bug report issue](https://github.com/VictoriaMetrics/VictoriaMetrics/issues/8439).
|
||||
* BUGFIX: [vmsingle](https://docs.victoriametrics.com/single-server-victoriametrics/) and [vmagent](https://docs.victoriametrics.com/vmagent/): properly escape IPv6 address in [Kubernetes service-discovery](https://docs.victoriametrics.com/sd_configs/#kubernetes_sd_configs) with `role: pod` for containers without exposed ports. See [this issue](https://github.com/VictoriaMetrics/VictoriaMetrics/issues/8374).
|
||||
* BUGFIX: [vmalert-tool](https://docs.victoriametrics.com/vmalert-tool/): clean up the temporary storage path when process is terminated by SIGTERM or SIGINT. Previously, unclean shut down might affect the next run.
|
||||
* BUGFIX: [vmui](https://docs.victoriametrics.com/#vmui): fix an infinite loader on the [Downsampling filters debug page](https://docs.victoriametrics.com/#vmui) when provided configuration matches no series. See [this issue](https://github.com/VictoriaMetrics/VictoriaMetrics/issues/8339).
|
||||
* BUGFIX: [MetricsQL](https://docs.victoriametrics.com/metricsql/): fix filters pushdown logic for expression like `foo{a="a"} ifnot bar{a="b"}`. Previously, filters from right operand were incorrectly propagated to the left operand and could result in empty query results even if `foo{a="a"}` matches time series. See [this issue](https://github.com/VictoriaMetrics/VictoriaMetrics/issues/8435).
|
||||
* BUGFIX: [vmsingle](https://docs.victoriametrics.com/single-server-victoriametrics/), `vmselect` in [VictoriaMetrics cluster](https://docs.victoriametrics.com/cluster-victoriametrics/): prevent possible panic for `foo @ bar` expression when first sample in `bar` starts with `NaN` or starts long after first sample in `foo`. Now, VM will try to find first non-NaN value in `bar` and could yield an error `@ modifier must return a non-NaN value` if it won't find it. See [this issue](https://github.com/VictoriaMetrics/VictoriaMetrics/issues/8444).
|
||||
* BUGFIX: [Single-node VictoriaMetrics](https://docs.victoriametrics.com/) and [vmstorage](https://docs.victoriametrics.com/victoriametrics/): prevent panic when using with rules that have zero interval: `-downsampling.period=5m:5m,0s:0s`. Such rule configuration shouldn't be rejected and cause an error when used. See [this issue](https://github.com/VictoriaMetrics/VictoriaMetrics/issues/8454).
|
||||
|
||||
## [v1.102.15](https://github.com/VictoriaMetrics/VictoriaMetrics/releases/tag/v1.102.15)
|
||||
|
||||
@@ -75,8 +91,8 @@ Released at 2025-02-21
|
||||
* FEATURE: [vmui](https://docs.victoriametrics.com/#vmui): improve numbers formatting for better readability on the `Explore Cardinality` page. See [this issue](https://github.com/VictoriaMetrics/VictoriaMetrics/issues/8318).
|
||||
* FEATURE: [vmui](https://docs.victoriametrics.com/#vmui): print full error messages for failed queries on the `Explore Cardinality` page. Before, only response status code was printed.
|
||||
* FEATURE: [vmui](https://docs.victoriametrics.com/#vmui): move values representing changes relative to the previous day to a separate column for easier sorting on the `Explore Cardinality` page.
|
||||
* FEATURE: [MetricsQL](https://docs.victoriametrics.com/metricsql/): support auto-format (prettify) for expressions that use quoted metric or label names. See [this issue](https://github.com/VictoriaMetrics/VictoriaMetrics/issues/7703) for details.
|
||||
* FEATURE: [MetricsQL](https://docs.victoriametrics.com/metricsql/): parse `$__interval` and `$__rate_interval` inside square brackets as missing square brackets. For example, `rate(m[$__interval])` is parsed as `rate(m)` instead of `rate(m[1i])`. This enables automatic detection of the lookbehind window for [rollup functions](https://docs.victoriametrics.com/metricsql/#rollup-functions) by VictoriaMetrics, which usually returns the most expected result.
|
||||
* FEATURE: [MetricsQL](https://docs.victoriametrics.com/metricsql/): support auto-format (prettify) for expressions that use quoted metric or label names. See [this issue](https://github.com/VictoriaMetrics/VictoriaMetrics/issues/7703) for details.
|
||||
|
||||
* BUGFIX: all the VictoriaMetrics components: properly override basic authorization for API endpoints protected with `authKey`. See [this issue](https://github.com/VictoriaMetrics/VictoriaMetrics/issues/7345#issuecomment-2662595807) for details.
|
||||
* BUGFIX: [vmalert](https://docs.victoriametrics.com/vmalert/): fix polluted alert messages when multiple Alertmanager instances are configured with `alert_relabel_configs`. See [this issue](https://github.com/VictoriaMetrics/VictoriaMetrics/issues/8040), and thanks to @evkuzin for [the pull request](https://github.com/VictoriaMetrics/VictoriaMetrics/pull/8258).
|
||||
|
||||
@@ -1,10 +1,9 @@
|
||||
VictoriaMetrics Cloud is a managed, easy to use monitoring solution that integrates seamlessly with
|
||||
other tools and frameworks in the Observability ecosystem such as OpenTelemetry, Grafana, Prometheus, Graphite,
|
||||
InfluxDB, OpenTSDB and DataDog - see [these docs](https://docs.victoriametrics.com/#how-to-import-time-series-data)
|
||||
for further details.
|
||||
for further details about importing time series data into VictoriaMetrics.
|
||||
|
||||
<br>
|
||||
<!--TODO: Just a test: Needs to be changed by something better!-->
|
||||
|
||||

|
||||
<br>
|
||||
@@ -13,35 +12,16 @@ for further details.
|
||||
* [Quick Start](/victoriametrics-cloud/quickstart/) documentation.
|
||||
* [Try it now](https://console.victoriametrics.cloud/signUp?utm_source=website&utm_campaign=docs_overview) with a free trial.
|
||||
|
||||
|
||||
## Use cases
|
||||
The most common use cases for VictoriaMetrics Cloud are:
|
||||
* Long-term remote storage for Prometheus metrics.
|
||||
VictoriaMetrics Cloud is designed for teams and organizations that handle any volume of metrics. The most common use cases for VictoriaMetrics Cloud are:
|
||||
* Long-term remote storage for Prometheus, OpenTelemetry and any other standardized metrics.
|
||||
* Reliable and efficient drop-in replacement for Prometheus and Graphite.
|
||||
* Easy and cost-saving enterprise managed alternative solution for Prometheus, Thanos, Mimir or Cortex.
|
||||
* Efficient replacement for InfluxDB and OpenTSDB by consuming lower amounts of RAM, CPU and disk.
|
||||
* Cost-efficient alternative for Observability services like DataDog.
|
||||
* Cost-efficient alternative for other Observability services like DataDog or Grafana Cloud.
|
||||
|
||||
## Benefits
|
||||
We run VictoriaMetrics Cloud deployments in our environment on AWS and provide easy-to-use endpoints
|
||||
for data ingestion and querying. The VictoriaMetrics team takes care of optimal configuration and software
|
||||
maintenance. This means that VictoriaMetrics Cloud allows users to run the Enterprise version of VictoriaMetrics, hosted on AWS,
|
||||
without the hustle to perform typical DevOps tasks such as:
|
||||
* Managing configuration.
|
||||
* Monitoring.
|
||||
* Logs collection.
|
||||
* Access protection.
|
||||
* Software updates.
|
||||
* Regular backups.
|
||||
* Control costs.
|
||||
|
||||
## Features
|
||||
VictoriaMetrics Cloud comes with the following features:
|
||||
* It can be used as a Managed Prometheus - just configure Prometheus or vmagent to write data to VictoriaMetrics Cloud and then use the provided endpoint as a Prometheus datasource in Grafana.
|
||||
* Built-in [Alerting & Recording](https://docs.victoriametrics.com/victoriametrics-cloud/alertmanager-setup-for-deployment/#configure-alerting-rules) rules execution.
|
||||
* Hosted [Alertmanager](https://docs.victoriametrics.com/victoriametrics-cloud/alertmanager-setup-for-deployment/) for sending notifications.
|
||||
* Every VictoriaMetrics Cloud deployment runs in an isolated environment, so deployments cannot interfere with each other.
|
||||
* VictoriaMetrics Cloud deployment can be scaled up or scaled down in a few clicks.
|
||||
* Automated backups.
|
||||
* No surprises. Select a tier and pay only for the actual used resources - compute, storage, traffic.
|
||||
Discover VictoriaMetrics Cloud Features and Benefits [here](/victoriametrics-cloud/get-started/features).
|
||||
|
||||
## Learn more
|
||||
* [VictoriaMetrics Cloud announcement](https://victoriametrics.com/blog/introduction-to-managed-monitoring/).
|
||||
|
||||
@@ -1,7 +1,6 @@
|
||||
---
|
||||
title: VictoriaMetrics Cloud Overview
|
||||
title: VictoriaMetrics Cloud
|
||||
weight: 40
|
||||
disableToc: true
|
||||
menu:
|
||||
docs:
|
||||
weight: 40
|
||||
|
||||
@@ -10,18 +10,15 @@ menu:
|
||||
---
|
||||
In this section you will find everything you need to start using [VictoriaMetrics Cloud](https://console.victoriametrics.cloud/signUp?utm_source=website&utm_campaign=docs_vm_get_started).
|
||||
|
||||
* [Overview of VictoriaMetrics Cloud](overview/)
|
||||
* [Quick Start](quickstart/)
|
||||
* [Overview of VictoriaMetrics Cloud](https://docs.victoriametrics.com/victoriametrics-cloud/get-started/overview/)
|
||||
* [Key Features & Benefits](https://docs.victoriametrics.com/victoriametrics-cloud/get-started/features/)
|
||||
* [Quick Start](https://docs.victoriametrics.com/victoriametrics-cloud/get-started/quickstart/)
|
||||
* [Guides and Best Practices](https://docs.victoriametrics.com/victoriametrics-cloud/get-started/guides/)
|
||||
|
||||
## Guides
|
||||
* [Understand Your Setup Size](/guides/understand-your-setup-size/)
|
||||
* [Alerting & recording rules with Alertmanager configuration for VictoriaMetrics Cloud deployment](/victoriametrics-cloud/alertmanager-setup-for-deployment/)
|
||||
* [Kubernetes Monitoring with VictoriaMetrics Cloud](/victoriametrics-cloud/how-to-monitor-k8s/)
|
||||
* [Setup Notifications](/victoriametrics-cloud/setup-notifications/)
|
||||
* [User Management](/victoriametrics-cloud/user-managment/)
|
||||
<details>
|
||||
<summary>Learn more about VictoriaMetrics Cloud</summary>
|
||||
|
||||
Learn more about VictoriaMetrics Cloud:
|
||||
* [VictoriaMetrics Cloud announcement](https://victoriametrics.com/blog/introduction-to-managed-monitoring/)
|
||||
* [Pricing comparison for Managed Prometheus](https://victoriametrics.com/blog/managed-prometheus-pricing/)
|
||||
* [Monitoring Proxmox VE via VictoriaMetrics Cloud and vmagent](https://victoriametrics.com/blog/proxmox-monitoring-with-dbaas/)
|
||||
|
||||
</details>
|
||||
|
||||
142
docs/victoriametrics-cloud/get-started/features.md
Normal file
142
docs/victoriametrics-cloud/get-started/features.md
Normal file
@@ -0,0 +1,142 @@
|
||||
---
|
||||
weight: 2
|
||||
title: Key Features & Benefits
|
||||
menu:
|
||||
docs:
|
||||
parent: get-started
|
||||
weight: 2
|
||||
aliases:
|
||||
- /victoriametrics-cloud/quickstart/features.html
|
||||
- /managed-victoriametrics/quickstart/features.html
|
||||
---
|
||||
|
||||
VictoriaMetrics Cloud helps optimizing your data and maximizing its value in the most reliable way. It can be used as an **Enterprise-level Managed Prometheus**: just configure Prometheus, [vmagent](https://docs.victoriametrics.com/vmagent/), an OpenTelemetry Collector or any agent to write data to VictoriaMetrics Cloud, and point Grafana to VictoriaMetrics Cloud by configuring it as a Prometheus datasource.
|
||||
|
||||
## Features
|
||||
VictoriaMetrics Cloud offers a robust suite of features designed to optimize your cloud experience. Seamless integrations, scalability and cost-saving measures, and comprehensive operational tools ensure that VictoriaMetrics Cloud can support your business needs.
|
||||
|
||||
<details>
|
||||
<summary>Integrations and Compatibility</summary>
|
||||
|
||||
* **Observability protocols**: OpenTelemetry, InfluxDB, DataDog, NewRelic, OpenTSDB & Graphite.
|
||||
* **Data visualization**: Use built-in [VictoriaMetrics UI](https://play.victoriametrics.com/) or integrate seamlessly with your current stack to query and visualize your data in [Grafana](https://grafana.com/) or [Perses](https://perses.dev).
|
||||
* [**AWS PrivateLink**](https://aws.amazon.com/privatelink/): enabling even more secure communication with VictoriaMetrics Cloud deployments directly from your VPC.
|
||||
|
||||
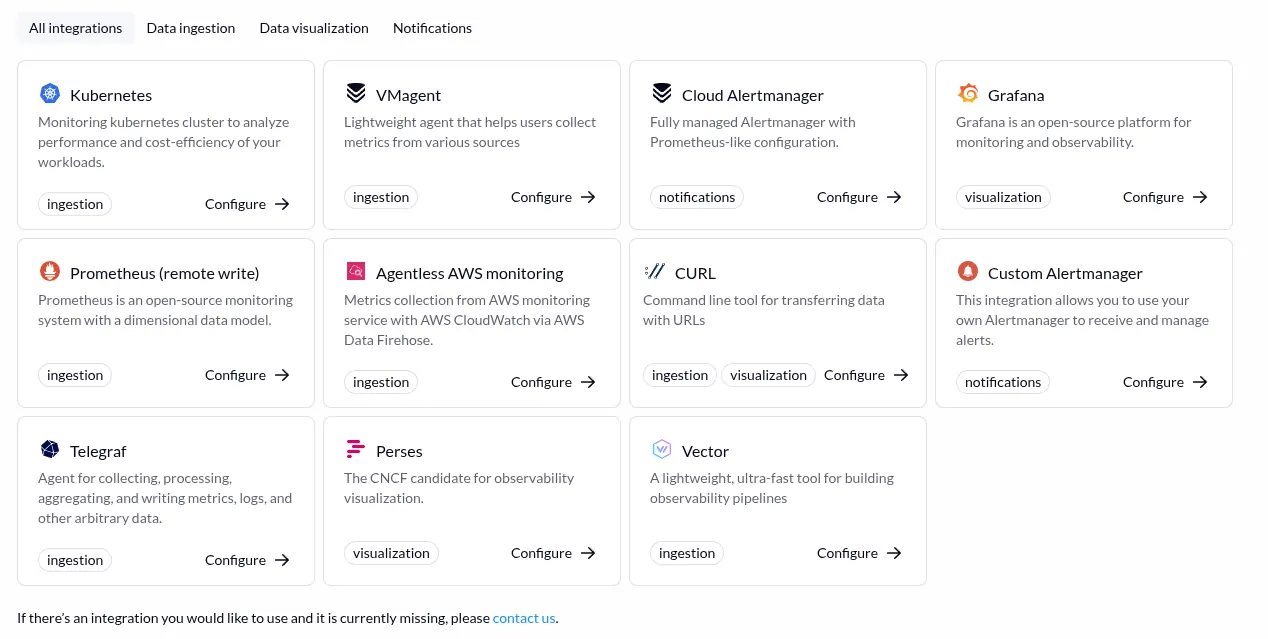
|
||||
<figcaption style="text-align: center; font-style: italic;">VictoriaMetrics Cloud Integrations</figcaption>
|
||||
|
||||
</details>
|
||||
|
||||
<details>
|
||||
<summary>Scale as you go and save costs</summary>
|
||||
|
||||
* **Easy Scaling**: VictoriaMetrics Cloud deployments can be scaled up or down with just a few clicks in line with growth and needs.
|
||||
* **Downsampling**: Lower your disk footprint (and save on storage costs!) by keeping fewer data points for historical data and speed up queries for it, while preserving high precision for your operational data.
|
||||
* **Retention filters**: Configure a custom retention period on a team (tenant) level or time series level by using label filters so that unneeded time series are wiped out freeing up storage space for new metrics data enabling additional cost savings
|
||||
* **Recording rules**: Improve query performance with recording rules, facilitating quicker data access & dashboard responsiveness.
|
||||
</details>
|
||||
|
||||
<details>
|
||||
<summary>Operations</summary>
|
||||
|
||||
* **Enterprise, managed VictoriaMetrics Solution**: Comes with all the proven features in VictoriaMetrics open source & Enterprise.
|
||||
* **Single-node** & **Cluster** configurations with automatic software version and security updates.
|
||||
* Built-in [Alerting & Recording](https://docs.victoriametrics.com/victoriametrics-cloud/alertmanager-setup-for-deployment/#configure-alerting-rules) rules execution. Define your rules & get immediate alerts as issues arise, enabling swift action & minimizing disruption to your users.
|
||||
* Hosted [Alertmanager](https://docs.victoriametrics.com/victoriametrics-cloud/alertmanager-setup-for-deployment/) for sending notifications.
|
||||
* **Isolated Deployments**: VictoriaMetrics Cloud provisions dedicated resources for your deployments, so you won’t encounter “noisy neighbors” problems as deployments do not compete for resources.
|
||||
* **Multitenancy**: Easily serve multiple teams (tenants) with one Cluster deployment by having a dedicated namespace for each team.
|
||||
* **Automated Backups**: Regular backup procedures are in place. Your data is automatically saved to a backup storage, so you can easily restore it when the need arises.
|
||||
* **High-availability** & replication.
|
||||
* **Reliability** & extraordinary performance with 99.95% SLA.
|
||||
</details>
|
||||
|
||||
## Get instant value from your data
|
||||
|
||||
VictoriaMetrics Cloud allows you to explore and optimize both your data and deployments.
|
||||
|
||||
<details>
|
||||
<summary>Query your own metrics</summary>
|
||||
|
||||
* Visualize your own data in graphs, table or json formats
|
||||
* Combine several queries at the same time
|
||||
* Prettify your queries to improve readability
|
||||
* Autocomplete to help you writing queries
|
||||
* Trace your queries to understand behavior
|
||||
|
||||
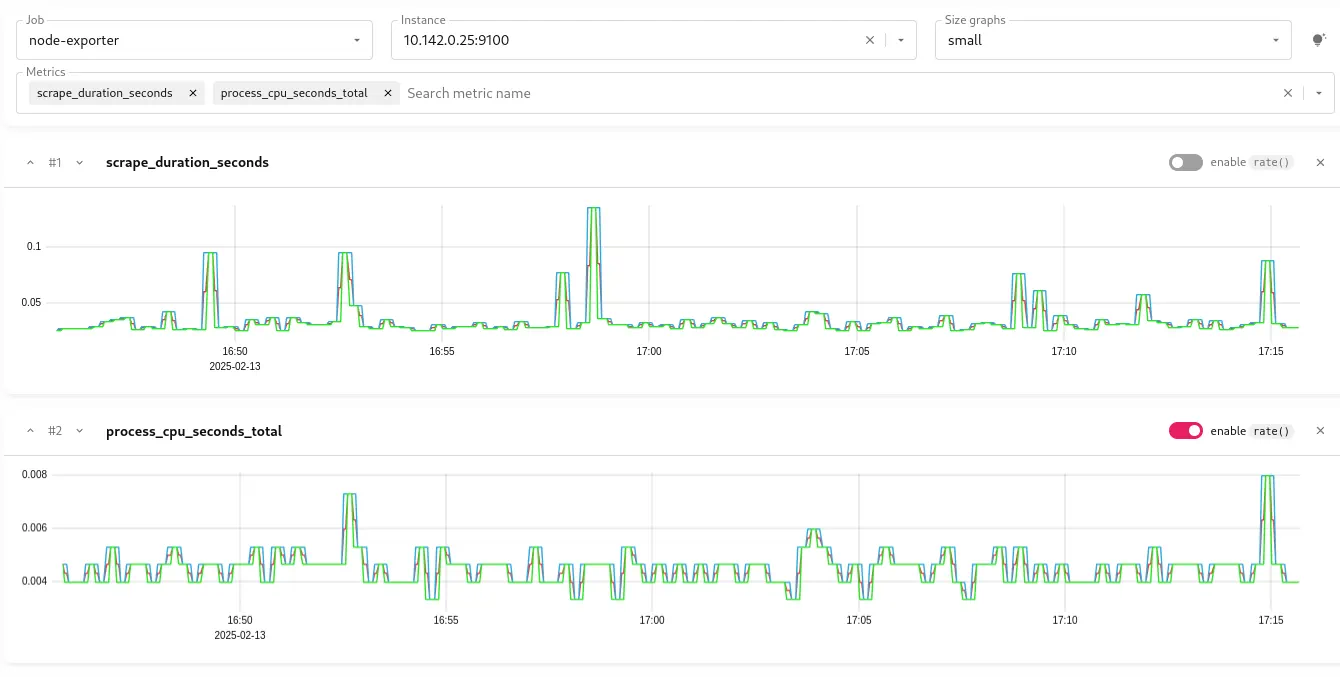
|
||||
<figcaption style="text-align: center; font-style: italic;">Query your data with VictoriaMetrics Cloud</figcaption>
|
||||
|
||||
</details>
|
||||
|
||||
<details>
|
||||
<summary>Explore valuable insights</summary>
|
||||
|
||||
* List your Prometheus metrics by Job and Instance
|
||||
* Inspect your time series data cardinality to optimize usage and costs
|
||||
* Discover top used or heaviest queries
|
||||
|
||||

|
||||
<figcaption style="text-align: center; font-style: italic;">Understand your data with VictoriaMetrics Cloud</figcaption>
|
||||
</details>
|
||||
|
||||
<details>
|
||||
<summary>Analyze, debug and learn</summary>
|
||||
|
||||
* Trace and query analyzer to debug queries
|
||||
* WITH templating for MetricsQL: functions, variables and filters
|
||||
* Debug metrics relabling with easy-to-follow examples
|
||||
|
||||
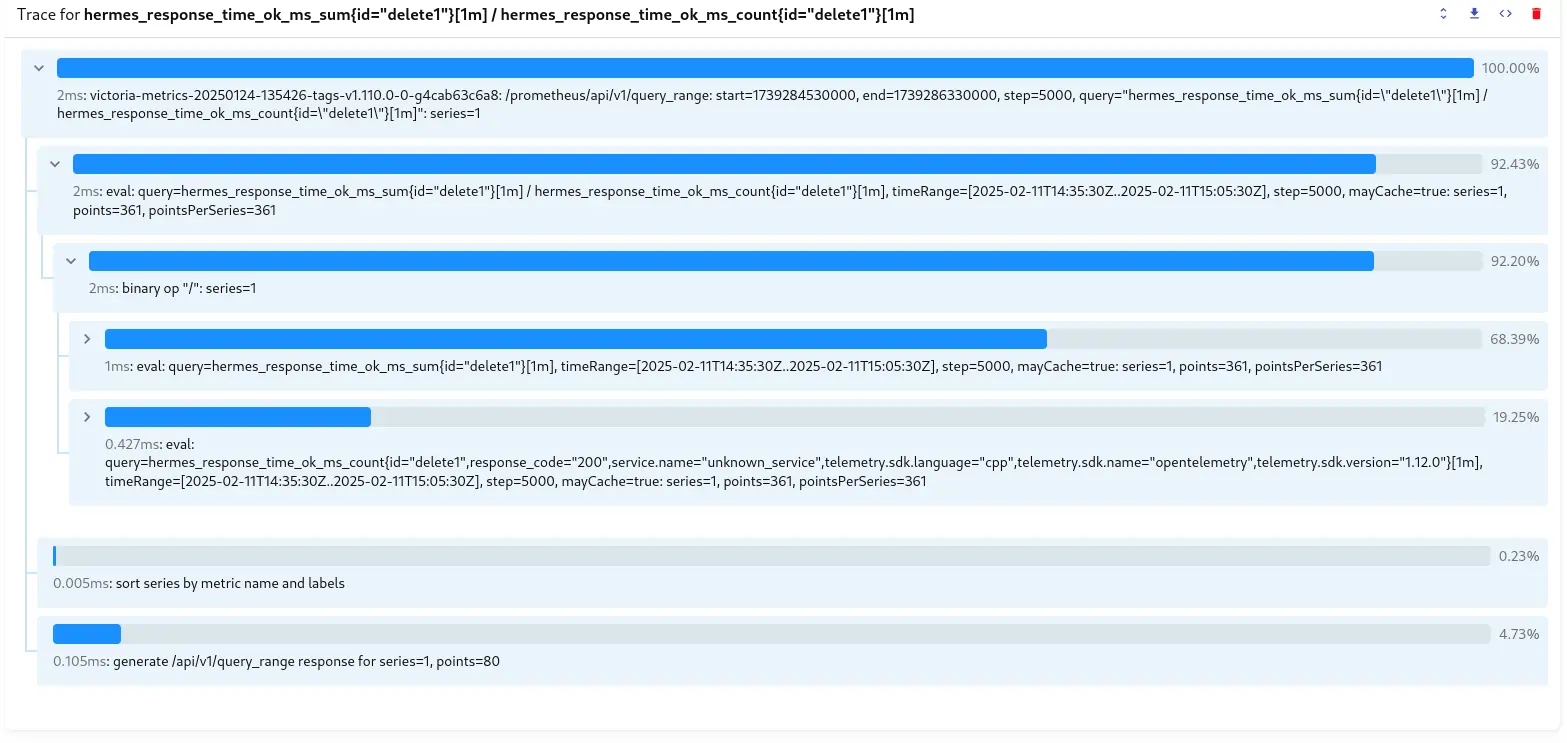
|
||||
<figcaption style="text-align: center; font-style: italic;">Debug your queries</figcaption>
|
||||
</details>
|
||||
|
||||
## Benefits
|
||||
In brief, we run VictoriaMetrics Cloud deployments in our AWS environment and provide direct endpoints
|
||||
for data ingestion and querying. The VictoriaMetrics team takes care of optimal configuration and software
|
||||
maintenance. You can think of it as having access to a **fully supported, enterprise** version of VictoriaMetrics
|
||||
that runs outside your environment, helping you to save resources and costs, without the hustle of performing
|
||||
typical DevOps tasks such as configuration management, monitoring, log collection, access protection, perform
|
||||
software and infrastructure upgrades, store backups regularly or control costs. **We take care of that**.
|
||||
|
||||
> VictoriaMetrics Cloud is able to handle larger workloads than competing solutions at a far lower cost.
|
||||
|
||||
<details>
|
||||
<summary>Easy Migration</summary>
|
||||
|
||||
* Migrate from costly & less scalable monitoring solutions such as Managed Prometheus service from AWS, GCP or Azure, InfluxDB Cloud, or your on-premises setup.
|
||||
* Get higher data resolution with much higher cardinality.
|
||||
* Run more complex queries.
|
||||
|
||||
</details>
|
||||
|
||||
<details>
|
||||
<summary>Enterprise level support</summary>
|
||||
|
||||
Includes all VictoriaMetrics Enterprise Features Plus:
|
||||
|
||||
* Business days & hours support
|
||||
* 8 hours response time for system impaired issues
|
||||
|
||||
</details>
|
||||
|
||||
<details>
|
||||
<summary>Cost-efficient Scaling</summary>
|
||||
|
||||
* Only pay for the resources that you actually use (compute, disk and network).
|
||||
* Downsampling and retention filters features enable additional cost-savings.
|
||||
|
||||
</details>
|
||||
|
||||
<details>
|
||||
<summary>Ease of Budgeting</summary>
|
||||
|
||||
**No invoice surprises**: pick a tier at a fixed price. Our pricing model protects you from surprise overages coming from unexpected changes in workload such as spikes in data ingestion rate, cardinality explosions or accidental heavy queries.
|
||||
</details>
|
||||
|
||||
|
||||
<details>
|
||||
<summary>Ease of use</summary>
|
||||
|
||||
The VictoriaMetrics team takes care of optimal configuration and handles all software maintenance, so you can focus on the monitoring.
|
||||
</details>
|
||||
|
||||
BIN
docs/victoriametrics-cloud/get-started/features_cardinality.webp
Normal file
BIN
docs/victoriametrics-cloud/get-started/features_cardinality.webp
Normal file

Binary file not shown.
|
After Width: | Height: | Size: 32 KiB |

Binary file not shown.
|
After Width: | Height: | Size: 48 KiB |
BIN
docs/victoriametrics-cloud/get-started/features_query.webp
Normal file
BIN
docs/victoriametrics-cloud/get-started/features_query.webp
Normal file

Binary file not shown.
|
After Width: | Height: | Size: 32 KiB |
BIN
docs/victoriametrics-cloud/get-started/features_traces.webp
Normal file
BIN
docs/victoriametrics-cloud/get-started/features_traces.webp
Normal file

Binary file not shown.
|
After Width: | Height: | Size: 52 KiB |
19
docs/victoriametrics-cloud/get-started/guides.md
Normal file
19
docs/victoriametrics-cloud/get-started/guides.md
Normal file
@@ -0,0 +1,19 @@
|
||||
---
|
||||
weight: 4
|
||||
title: Guides and Best Practices
|
||||
menu:
|
||||
docs:
|
||||
parent: get-started
|
||||
weight: 4
|
||||
aliases:
|
||||
- /victoriametrics-cloud/quickstart/best-practices.html
|
||||
- /managed-victoriametrics/quickstart/best-practices.html
|
||||
---
|
||||
|
||||
Here you can find some guides and best practices:
|
||||
|
||||
* [Understand Your Setup Size](https://docs.victoriametrics.com/guides/understand-your-setup-size/)
|
||||
* [Alerting & recording rules with Alertmanager configuration for VictoriaMetrics Cloud deployment](https://docs.victoriametrics.com/victoriametrics-cloud/alertmanager-setup-for-deployment/)
|
||||
* [Kubernetes Monitoring with VictoriaMetrics Cloud](https://docs.victoriametrics.com/victoriametrics-cloud/how-to-monitor-k8s/)
|
||||
* [Setup Notifications](https://docs.victoriametrics.com/victoriametrics-cloud/setup-notifications/)
|
||||
* [User Management](https://docs.victoriametrics.com/victoriametrics-cloud/user-managment/)
|
||||
@@ -49,9 +49,9 @@ please refer to the [VictoriaMetrics Cloud documentation](https://docs.victoriam
|
||||
* `vmalert` execute queries against remote datasource which has reliability risks because of the network.
|
||||
It is recommended to configure alerts thresholds and rules expressions with the understanding that network
|
||||
requests may fail;
|
||||
* by default, rules execution is sequential within one group, but persistence of execution results to remote
|
||||
* `vmalert` executes rules within a group sequentially, but persistence of execution results to remote
|
||||
storage is asynchronous. Hence, user shouldn't rely on chaining of recording rules when result of previous
|
||||
recording rule is reused in the next one;
|
||||
recording rule is reused in the next one. See how to chain groups [here](https://docs.victoriametrics.com/vmalert/#chaining-groups).
|
||||
|
||||
## QuickStart
|
||||
|
||||
@@ -138,7 +138,8 @@ name: <string>
|
||||
# Group will be evaluated at the exact offset in the range of [0...interval].
|
||||
# E.g. for Group with `interval: 1h` and `eval_offset: 5m` the evaluation will
|
||||
# start at 5th minute of the hour. See https://github.com/VictoriaMetrics/VictoriaMetrics/issues/3409
|
||||
# `eval_offset` can't be bigger than `interval`.
|
||||
# `interval` must be specified if `eval_offset` is used, and `eval_offset` cannot exceed `interval`.
|
||||
# `eval_offset` cannot be used with `eval_delay`, as group will be executed at the exact offset and `eval_delay` is ignored.
|
||||
[ eval_offset: <duration> ]
|
||||
|
||||
# Optional
|
||||
@@ -952,7 +953,7 @@ Sensitive info is stripped from the `curl` examples - see [security](#security)
|
||||
|
||||
### Never-firing alerts
|
||||
|
||||
vmalert can detect{{% available_from "v1.90.0" %}} if alert's expression doesn't match any time series in runtime
|
||||
vmalert can detect{{% available_from "v1.91.0" %}} if alert's expression doesn't match any time series in runtime
|
||||
starting from [v1.91](https://docs.victoriametrics.com/changelog/#v1910). This problem usually happens
|
||||
when alerting expression selects time series which aren't present in the datasource (i.e. wrong `job` label)
|
||||
or there is a typo in the series selector (i.e. `env=prod`). Such alerting rules will be marked with special icon in
|
||||
@@ -1460,7 +1461,7 @@ The shortlist of configuration flags is the following:
|
||||
-rule.defaultRuleType string
|
||||
Default type for rule expressions, can be overridden by type parameter inside the rule group. Supported values: "graphite", "prometheus" and "vlogs". (default: "prometheus")
|
||||
-rule.evalDelay time
|
||||
Adjustment of the time parameter for rule evaluation requests to compensate intentional data delay from the datasource.Normally, should be equal to `-search.latencyOffset` (cmd-line flag configured for VictoriaMetrics single-node or vmselect). (default 30s)
|
||||
Adjustment of the time parameter for rule evaluation requests to compensate intentional data delay from the datasource.Normally, should be equal to `-search.latencyOffset` (cmd-line flag configured for VictoriaMetrics single-node or vmselect). This doesn't apply to groups with eval_offset specified. (default 30s)
|
||||
-rule.maxResolveDuration duration
|
||||
Limits the maxiMum duration for automatic alert expiration, which by default is 4 times evaluationInterval of the parent group
|
||||
-rule.resendDelay duration
|
||||
@@ -1554,6 +1555,62 @@ Please note, `params` are used only for executing rules expressions (requests to
|
||||
If there would be a conflict between URL params set in `datasource.url` flag and params in group definition
|
||||
the latter will have higher priority.
|
||||
|
||||
### Chaining groups
|
||||
|
||||
For chaining groups, they must be executed in a specific order, and the next group should be executed after
|
||||
the results from previous group are available in the datasource.
|
||||
In `vmalert`, user can specify `eval_offset` to achieve that{{% available_from "v1.113.0" %}}.
|
||||
|
||||
For example:
|
||||
```yaml
|
||||
groups:
|
||||
- name: BaseGroup
|
||||
interval: 1m
|
||||
eval_offset: 10s
|
||||
rules:
|
||||
- record: http_server_request_duration_seconds:sum_rate:5m:http_get
|
||||
expr: |
|
||||
sum without(instance, pod) (
|
||||
rate(
|
||||
http_server_request_duration_seconds{
|
||||
http_request_method="GET"
|
||||
}[5m]
|
||||
)
|
||||
)
|
||||
- record: http_server_request_duration_seconds:sum_rate:5m:http_post
|
||||
expr: |
|
||||
sum without(instance, pod) (
|
||||
rate(
|
||||
http_server_request_duration_seconds{
|
||||
http_request_method="POST"
|
||||
}[5m]
|
||||
)
|
||||
)
|
||||
- name: TopGroup
|
||||
interval: 1m
|
||||
eval_offset: 40s
|
||||
rules:
|
||||
- record: http_server_request_duration_seconds:sum_rate:5m:merged
|
||||
expr: |
|
||||
http_server_request_duration_seconds:sum_rate:5m:http_get
|
||||
or
|
||||
http_server_request_duration_seconds:sum_rate:5m:http_post
|
||||
```
|
||||
|
||||
This configuration ensures that rules in `BaseGroup` are exectuted at(assuming vmalert starts at `12:00:00`):
|
||||
```
|
||||
[12:00:10, 12:01:10, 12:02:10, 12:03:10...]
|
||||
```
|
||||
while rules in group `TopGroup` are exectuted at:
|
||||
```
|
||||
[12:00:40, 12:01:40, 12:02:40, 12:03:40...]
|
||||
```
|
||||
As a result, `TopGroup` always gets the latest results of `BaseGroup`.
|
||||
|
||||
By default, the `eval_offset` values should be at least 30 seconds apart to accommodate the
|
||||
`-search.latencyOffset(default 30s)` command-line flag at vmselect or VictoriaMetrics single-node.
|
||||
The mininum `eval_offset` gap can be adjusted accordingly with `-search.latencyOffset`.
|
||||
|
||||
### Notifier configuration file
|
||||
|
||||
Notifier also supports configuration via file specified with flag `notifier.config`:
|
||||
|
||||
2
go.mod
2
go.mod
@@ -15,7 +15,7 @@ require (
|
||||
github.com/VictoriaMetrics/easyproto v0.1.4
|
||||
github.com/VictoriaMetrics/fastcache v1.12.2
|
||||
github.com/VictoriaMetrics/metrics v1.35.2
|
||||
github.com/VictoriaMetrics/metricsql v0.84.0
|
||||
github.com/VictoriaMetrics/metricsql v0.84.1
|
||||
github.com/aws/aws-sdk-go-v2 v1.36.1
|
||||
github.com/aws/aws-sdk-go-v2/config v1.29.6
|
||||
github.com/aws/aws-sdk-go-v2/feature/s3/manager v1.17.61
|
||||
|
||||
8
go.sum
8
go.sum
@@ -43,8 +43,8 @@ github.com/VictoriaMetrics/fastcache v1.12.2/go.mod h1:AmC+Nzz1+3G2eCPapF6UcsnkT
|
||||
github.com/VictoriaMetrics/metrics v1.34.0/go.mod h1:r7hveu6xMdUACXvB8TYdAj8WEsKzWB0EkpJN+RDtOf8=
|
||||
github.com/VictoriaMetrics/metrics v1.35.2 h1:Bj6L6ExfnakZKYPpi7mGUnkJP4NGQz2v5wiChhXNyWQ=
|
||||
github.com/VictoriaMetrics/metrics v1.35.2/go.mod h1:r7hveu6xMdUACXvB8TYdAj8WEsKzWB0EkpJN+RDtOf8=
|
||||
github.com/VictoriaMetrics/metricsql v0.84.0 h1:rVZapkXHiM4dR979La3tk8u2equ57Insbr1+Hm6yUew=
|
||||
github.com/VictoriaMetrics/metricsql v0.84.0/go.mod h1:1g4hdCwlbJZ851PU9VN65xy9Rdlzupo6fx3SNZ8Z64U=
|
||||
github.com/VictoriaMetrics/metricsql v0.84.1 h1:ts0fJBcmClFRmO7Ibn/YG2ctT698aX/TxPbTfax8eTA=
|
||||
github.com/VictoriaMetrics/metricsql v0.84.1/go.mod h1:1g4hdCwlbJZ851PU9VN65xy9Rdlzupo6fx3SNZ8Z64U=
|
||||
github.com/VividCortex/ewma v1.2.0 h1:f58SaIzcDXrSy3kWaHNvuJgJ3Nmz59Zji6XoJR/q1ow=
|
||||
github.com/VividCortex/ewma v1.2.0/go.mod h1:nz4BbCtbLyFDeC9SUHbtcT5644juEuWfUAUnGx7j5l4=
|
||||
github.com/alecthomas/units v0.0.0-20240927000941-0f3dac36c52b h1:mimo19zliBX/vSQ6PWWSL9lK8qwHozUj03+zLoEB8O0=
|
||||
@@ -130,8 +130,8 @@ github.com/edsrzf/mmap-go v1.2.0 h1:hXLYlkbaPzt1SaQk+anYwKSRNhufIDCchSPkUD6dD84=
|
||||
github.com/edsrzf/mmap-go v1.2.0/go.mod h1:19H/e8pUPLicwkyNgOykDXkJ9F0MHE+Z52B8EIth78Q=
|
||||
github.com/emicklei/go-restful/v3 v3.11.0 h1:rAQeMHw1c7zTmncogyy8VvRZwtkmkZ4FxERmMY4rD+g=
|
||||
github.com/emicklei/go-restful/v3 v3.11.0/go.mod h1:6n3XBCmQQb25CM2LCACGz8ukIrRry+4bhvbpWn3mrbc=
|
||||
github.com/envoyproxy/go-control-plane/envoy v1.32.3 h1:hVEaommgvzTjTd4xCaFd+kEQ2iYBtGxP6luyLrx6uOk=
|
||||
github.com/envoyproxy/go-control-plane/envoy v1.32.3/go.mod h1:F6hWupPfh75TBXGKA++MCT/CZHFq5r9/uwt/kQYkZfE=
|
||||
github.com/envoyproxy/go-control-plane/envoy v1.32.3 h1:c1EIw4vwYCaovxRZtyycws8aX6dJ9W2p+4bCi7mcDgw=
|
||||
github.com/envoyproxy/go-control-plane/envoy v1.32.3/go.mod h1:c955gQjaXHsMxMjHjEZ7nwIzMJYxXpN+sJIGufsSbg4=
|
||||
github.com/envoyproxy/protoc-gen-validate v1.1.0 h1:tntQDh69XqOCOZsDz0lVJQez/2L6Uu2PdjCQwWCJ3bM=
|
||||
github.com/envoyproxy/protoc-gen-validate v1.1.0/go.mod h1:sXRDRVmzEbkM7CVcM06s9shE/m23dg3wzjl0UWqJ2q4=
|
||||
github.com/ergochat/readline v0.1.3 h1:/DytGTmwdUJcLAe3k3VJgowh5vNnsdifYT6uVaf4pSo=
|
||||
|
||||
@@ -479,7 +479,7 @@ func isProtectedByAuthFlag(path string) bool {
|
||||
return strings.HasSuffix(path, "/config") || strings.HasSuffix(path, "/reload") ||
|
||||
strings.HasSuffix(path, "/resetRollupResultCache") || strings.HasSuffix(path, "/delSeries") || strings.HasSuffix(path, "/delete_series") ||
|
||||
strings.HasSuffix(path, "/force_merge") || strings.HasSuffix(path, "/force_flush") || strings.HasSuffix(path, "/snapshot") ||
|
||||
strings.HasPrefix(path, "/snapshot/")
|
||||
strings.HasPrefix(path, "/snapshot/") || strings.HasSuffix(path, "/admin/status/metric_names_stats/reset")
|
||||
}
|
||||
|
||||
// CheckAuthFlag checks whether the given authKey is set and valid
|
||||
|
||||
@@ -1,40 +1,11 @@
|
||||
package pb
|
||||
|
||||
import (
|
||||
"encoding/base64"
|
||||
"encoding/json"
|
||||
"fmt"
|
||||
"math"
|
||||
"strconv"
|
||||
)
|
||||
|
||||
// FormatString returns string reperesentation for av.
|
||||
func (av *AnyValue) FormatString() string {
|
||||
if av == nil {
|
||||
return ""
|
||||
}
|
||||
switch {
|
||||
case av.StringValue != nil:
|
||||
return *av.StringValue
|
||||
case av.BoolValue != nil:
|
||||
return strconv.FormatBool(*av.BoolValue)
|
||||
case av.IntValue != nil:
|
||||
return strconv.FormatInt(*av.IntValue, 10)
|
||||
case av.DoubleValue != nil:
|
||||
return float64AsString(*av.DoubleValue)
|
||||
case av.ArrayValue != nil:
|
||||
jsonStr, _ := json.Marshal(av.ArrayValue.Values)
|
||||
return string(jsonStr)
|
||||
case av.KeyValueList != nil:
|
||||
jsonStr, _ := json.Marshal(av.KeyValueList.Values)
|
||||
return string(jsonStr)
|
||||
case av.BytesValue != nil:
|
||||
return base64.StdEncoding.EncodeToString(*av.BytesValue)
|
||||
default:
|
||||
return ""
|
||||
}
|
||||
}
|
||||
|
||||
func float64AsString(f float64) string {
|
||||
if math.IsInf(f, 0) || math.IsNaN(f) {
|
||||
return fmt.Sprintf("json: unsupported value: %s", strconv.FormatFloat(f, 'g', -1, 64))
|
||||
|
||||
65
lib/protoparser/opentelemetry/pb/helpers.qtpl
Normal file
65
lib/protoparser/opentelemetry/pb/helpers.qtpl
Normal file
@@ -0,0 +1,65 @@
|
||||
{% import (
|
||||
"strconv"
|
||||
"encoding/base64"
|
||||
)%}
|
||||
|
||||
{% stripspace %}
|
||||
{% func (kvl *KeyValueList) FormatString() %}
|
||||
{% if len(kvl.Values) > 0 %}
|
||||
{
|
||||
{% for i, v := range kvl.Values %}
|
||||
{%q= v.Key %}: {%s= v.Value.FormatString(false) %}
|
||||
{% if i + 1 < len(kvl.Values) %},{% endif %}
|
||||
{% endfor %}
|
||||
}
|
||||
{% else %}
|
||||
{}
|
||||
{% endif %}
|
||||
{% endfunc %}
|
||||
{% endstripspace %}
|
||||
|
||||
{% stripspace %}
|
||||
{% func (av *ArrayValue) FormatString() %}
|
||||
{% if len(av.Values) > 0 %}
|
||||
[
|
||||
{% for i, v := range av.Values %}
|
||||
{%s= v.FormatString(false) %}
|
||||
{% if i + 1 < len(av.Values) %},{% endif %}
|
||||
{% endfor %}
|
||||
]
|
||||
{% else %}
|
||||
[]
|
||||
{% endif %}
|
||||
{% endfunc %}
|
||||
{% endstripspace %}
|
||||
|
||||
{% stripspace %}
|
||||
{% func (av *AnyValue) FormatString(toplevel bool) %}
|
||||
{% if av == nil %}
|
||||
{% if !toplevel %}
|
||||
null
|
||||
{% endif %}
|
||||
{% return %}
|
||||
{% endif %}
|
||||
{% switch %}
|
||||
{% case av.StringValue != nil %}
|
||||
{% if toplevel %}
|
||||
{%s= *av.StringValue %}
|
||||
{% else %}
|
||||
{%q= *av.StringValue %}
|
||||
{% endif %}
|
||||
{% case av.BoolValue != nil %}
|
||||
{%s= strconv.FormatBool(*av.BoolValue) %}
|
||||
{% case av.IntValue != nil %}
|
||||
{%dl= *av.IntValue %}
|
||||
{% case av.DoubleValue != nil %}
|
||||
{%s= float64AsString(*av.DoubleValue) %}
|
||||
{% case av.ArrayValue != nil %}
|
||||
{%s= av.ArrayValue.FormatString() %}
|
||||
{% case av.KeyValueList != nil %}
|
||||
{%s= av.KeyValueList.FormatString() %}
|
||||
{% case av.BytesValue != nil %}
|
||||
{%s= base64.StdEncoding.EncodeToString(*av.BytesValue) %}
|
||||
{% endswitch %}
|
||||
{% endfunc %}
|
||||
{% endstripspace %}
|
||||
221
lib/protoparser/opentelemetry/pb/helpers.qtpl.go
Normal file
221
lib/protoparser/opentelemetry/pb/helpers.qtpl.go
Normal file
@@ -0,0 +1,221 @@
|
||||
// Code generated by qtc from "helpers.qtpl". DO NOT EDIT.
|
||||
// See https://github.com/valyala/quicktemplate for details.
|
||||
|
||||
//line lib/protoparser/opentelemetry/pb/helpers.qtpl:1
|
||||
package pb
|
||||
|
||||
//line lib/protoparser/opentelemetry/pb/helpers.qtpl:1
|
||||
import (
|
||||
"encoding/base64"
|
||||
"strconv"
|
||||
)
|
||||
|
||||
//line lib/protoparser/opentelemetry/pb/helpers.qtpl:7
|
||||
import (
|
||||
qtio422016 "io"
|
||||
|
||||
qt422016 "github.com/valyala/quicktemplate"
|
||||
)
|
||||
|
||||
//line lib/protoparser/opentelemetry/pb/helpers.qtpl:7
|
||||
var (
|
||||
_ = qtio422016.Copy
|
||||
_ = qt422016.AcquireByteBuffer
|
||||
)
|
||||
|
||||
//line lib/protoparser/opentelemetry/pb/helpers.qtpl:7
|
||||
func (kvl *KeyValueList) StreamFormatString(qw422016 *qt422016.Writer) {
|
||||
//line lib/protoparser/opentelemetry/pb/helpers.qtpl:8
|
||||
if len(kvl.Values) > 0 {
|
||||
//line lib/protoparser/opentelemetry/pb/helpers.qtpl:8
|
||||
qw422016.N().S(`{`)
|
||||
//line lib/protoparser/opentelemetry/pb/helpers.qtpl:10
|
||||
for i, v := range kvl.Values {
|
||||
//line lib/protoparser/opentelemetry/pb/helpers.qtpl:11
|
||||
qw422016.N().Q(v.Key)
|
||||
//line lib/protoparser/opentelemetry/pb/helpers.qtpl:11
|
||||
qw422016.N().S(`:`)
|
||||
//line lib/protoparser/opentelemetry/pb/helpers.qtpl:11
|
||||
qw422016.N().S(v.Value.FormatString(false))
|
||||
//line lib/protoparser/opentelemetry/pb/helpers.qtpl:12
|
||||
if i+1 < len(kvl.Values) {
|
||||
//line lib/protoparser/opentelemetry/pb/helpers.qtpl:12
|
||||
qw422016.N().S(`,`)
|
||||
//line lib/protoparser/opentelemetry/pb/helpers.qtpl:12
|
||||
}
|
||||
//line lib/protoparser/opentelemetry/pb/helpers.qtpl:13
|
||||
}
|
||||
//line lib/protoparser/opentelemetry/pb/helpers.qtpl:13
|
||||
qw422016.N().S(`}`)
|
||||
//line lib/protoparser/opentelemetry/pb/helpers.qtpl:15
|
||||
} else {
|
||||
//line lib/protoparser/opentelemetry/pb/helpers.qtpl:15
|
||||
qw422016.N().S(`{}`)
|
||||
//line lib/protoparser/opentelemetry/pb/helpers.qtpl:17
|
||||
}
|
||||
//line lib/protoparser/opentelemetry/pb/helpers.qtpl:18
|
||||
}
|
||||
|
||||
//line lib/protoparser/opentelemetry/pb/helpers.qtpl:18
|
||||
func (kvl *KeyValueList) WriteFormatString(qq422016 qtio422016.Writer) {
|
||||
//line lib/protoparser/opentelemetry/pb/helpers.qtpl:18
|
||||
qw422016 := qt422016.AcquireWriter(qq422016)
|
||||
//line lib/protoparser/opentelemetry/pb/helpers.qtpl:18
|
||||
kvl.StreamFormatString(qw422016)
|
||||
//line lib/protoparser/opentelemetry/pb/helpers.qtpl:18
|
||||
qt422016.ReleaseWriter(qw422016)
|
||||
//line lib/protoparser/opentelemetry/pb/helpers.qtpl:18
|
||||
}
|
||||
|
||||
//line lib/protoparser/opentelemetry/pb/helpers.qtpl:18
|
||||
func (kvl *KeyValueList) FormatString() string {
|
||||
//line lib/protoparser/opentelemetry/pb/helpers.qtpl:18
|
||||
qb422016 := qt422016.AcquireByteBuffer()
|
||||
//line lib/protoparser/opentelemetry/pb/helpers.qtpl:18
|
||||
kvl.WriteFormatString(qb422016)
|
||||
//line lib/protoparser/opentelemetry/pb/helpers.qtpl:18
|
||||
qs422016 := string(qb422016.B)
|
||||
//line lib/protoparser/opentelemetry/pb/helpers.qtpl:18
|
||||
qt422016.ReleaseByteBuffer(qb422016)
|
||||
//line lib/protoparser/opentelemetry/pb/helpers.qtpl:18
|
||||
return qs422016
|
||||
//line lib/protoparser/opentelemetry/pb/helpers.qtpl:18
|
||||
}
|
||||
|
||||
//line lib/protoparser/opentelemetry/pb/helpers.qtpl:22
|
||||
func (av *ArrayValue) StreamFormatString(qw422016 *qt422016.Writer) {
|
||||
//line lib/protoparser/opentelemetry/pb/helpers.qtpl:23
|
||||
if len(av.Values) > 0 {
|
||||
//line lib/protoparser/opentelemetry/pb/helpers.qtpl:23
|
||||
qw422016.N().S(`[`)
|
||||
//line lib/protoparser/opentelemetry/pb/helpers.qtpl:25
|
||||
for i, v := range av.Values {
|
||||
//line lib/protoparser/opentelemetry/pb/helpers.qtpl:26
|
||||
qw422016.N().S(v.FormatString(false))
|
||||
//line lib/protoparser/opentelemetry/pb/helpers.qtpl:27
|
||||
if i+1 < len(av.Values) {
|
||||
//line lib/protoparser/opentelemetry/pb/helpers.qtpl:27
|
||||
qw422016.N().S(`,`)
|
||||
//line lib/protoparser/opentelemetry/pb/helpers.qtpl:27
|
||||
}
|
||||
//line lib/protoparser/opentelemetry/pb/helpers.qtpl:28
|
||||
}
|
||||
//line lib/protoparser/opentelemetry/pb/helpers.qtpl:28
|
||||
qw422016.N().S(`]`)
|
||||
//line lib/protoparser/opentelemetry/pb/helpers.qtpl:30
|
||||
} else {
|
||||
//line lib/protoparser/opentelemetry/pb/helpers.qtpl:30
|
||||
qw422016.N().S(`[]`)
|
||||
//line lib/protoparser/opentelemetry/pb/helpers.qtpl:32
|
||||
}
|
||||
//line lib/protoparser/opentelemetry/pb/helpers.qtpl:33
|
||||
}
|
||||
|
||||
//line lib/protoparser/opentelemetry/pb/helpers.qtpl:33
|
||||
func (av *ArrayValue) WriteFormatString(qq422016 qtio422016.Writer) {
|
||||
//line lib/protoparser/opentelemetry/pb/helpers.qtpl:33
|
||||
qw422016 := qt422016.AcquireWriter(qq422016)
|
||||
//line lib/protoparser/opentelemetry/pb/helpers.qtpl:33
|
||||
av.StreamFormatString(qw422016)
|
||||
//line lib/protoparser/opentelemetry/pb/helpers.qtpl:33
|
||||
qt422016.ReleaseWriter(qw422016)
|
||||
//line lib/protoparser/opentelemetry/pb/helpers.qtpl:33
|
||||
}
|
||||
|
||||
//line lib/protoparser/opentelemetry/pb/helpers.qtpl:33
|
||||
func (av *ArrayValue) FormatString() string {
|
||||
//line lib/protoparser/opentelemetry/pb/helpers.qtpl:33
|
||||
qb422016 := qt422016.AcquireByteBuffer()
|
||||
//line lib/protoparser/opentelemetry/pb/helpers.qtpl:33
|
||||
av.WriteFormatString(qb422016)
|
||||
//line lib/protoparser/opentelemetry/pb/helpers.qtpl:33
|
||||
qs422016 := string(qb422016.B)
|
||||
//line lib/protoparser/opentelemetry/pb/helpers.qtpl:33
|
||||
qt422016.ReleaseByteBuffer(qb422016)
|
||||
//line lib/protoparser/opentelemetry/pb/helpers.qtpl:33
|
||||
return qs422016
|
||||
//line lib/protoparser/opentelemetry/pb/helpers.qtpl:33
|
||||
}
|
||||
|
||||
//line lib/protoparser/opentelemetry/pb/helpers.qtpl:37
|
||||
func (av *AnyValue) StreamFormatString(qw422016 *qt422016.Writer, toplevel bool) {
|
||||
//line lib/protoparser/opentelemetry/pb/helpers.qtpl:38
|
||||
if av == nil {
|
||||
//line lib/protoparser/opentelemetry/pb/helpers.qtpl:39
|
||||
if !toplevel {
|
||||
//line lib/protoparser/opentelemetry/pb/helpers.qtpl:39
|
||||
qw422016.N().S(`null`)
|
||||
//line lib/protoparser/opentelemetry/pb/helpers.qtpl:41
|
||||
}
|
||||
//line lib/protoparser/opentelemetry/pb/helpers.qtpl:42
|
||||
return
|
||||
//line lib/protoparser/opentelemetry/pb/helpers.qtpl:43
|
||||
}
|
||||
//line lib/protoparser/opentelemetry/pb/helpers.qtpl:44
|
||||
switch {
|
||||
//line lib/protoparser/opentelemetry/pb/helpers.qtpl:45
|
||||
case av.StringValue != nil:
|
||||
//line lib/protoparser/opentelemetry/pb/helpers.qtpl:46
|
||||
if toplevel {
|
||||
//line lib/protoparser/opentelemetry/pb/helpers.qtpl:47
|
||||
qw422016.N().S(*av.StringValue)
|
||||
//line lib/protoparser/opentelemetry/pb/helpers.qtpl:48
|
||||
} else {
|
||||
//line lib/protoparser/opentelemetry/pb/helpers.qtpl:49
|
||||
qw422016.N().Q(*av.StringValue)
|
||||
//line lib/protoparser/opentelemetry/pb/helpers.qtpl:50
|
||||
}
|
||||
//line lib/protoparser/opentelemetry/pb/helpers.qtpl:51
|
||||
case av.BoolValue != nil:
|
||||
//line lib/protoparser/opentelemetry/pb/helpers.qtpl:52
|
||||
qw422016.N().S(strconv.FormatBool(*av.BoolValue))
|
||||
//line lib/protoparser/opentelemetry/pb/helpers.qtpl:53
|
||||
case av.IntValue != nil:
|
||||
//line lib/protoparser/opentelemetry/pb/helpers.qtpl:54
|
||||
qw422016.N().DL(*av.IntValue)
|
||||
//line lib/protoparser/opentelemetry/pb/helpers.qtpl:55
|
||||
case av.DoubleValue != nil:
|
||||
//line lib/protoparser/opentelemetry/pb/helpers.qtpl:56
|
||||
qw422016.N().S(float64AsString(*av.DoubleValue))
|
||||
//line lib/protoparser/opentelemetry/pb/helpers.qtpl:57
|
||||
case av.ArrayValue != nil:
|
||||
//line lib/protoparser/opentelemetry/pb/helpers.qtpl:58
|
||||
qw422016.N().S(av.ArrayValue.FormatString())
|
||||
//line lib/protoparser/opentelemetry/pb/helpers.qtpl:59
|
||||
case av.KeyValueList != nil:
|
||||
//line lib/protoparser/opentelemetry/pb/helpers.qtpl:60
|
||||
qw422016.N().S(av.KeyValueList.FormatString())
|
||||
//line lib/protoparser/opentelemetry/pb/helpers.qtpl:61
|
||||
case av.BytesValue != nil:
|
||||
//line lib/protoparser/opentelemetry/pb/helpers.qtpl:62
|
||||
qw422016.N().S(base64.StdEncoding.EncodeToString(*av.BytesValue))
|
||||
//line lib/protoparser/opentelemetry/pb/helpers.qtpl:63
|
||||
}
|
||||
//line lib/protoparser/opentelemetry/pb/helpers.qtpl:64
|
||||
}
|
||||
|
||||
//line lib/protoparser/opentelemetry/pb/helpers.qtpl:64
|
||||
func (av *AnyValue) WriteFormatString(qq422016 qtio422016.Writer, toplevel bool) {
|
||||
//line lib/protoparser/opentelemetry/pb/helpers.qtpl:64
|
||||
qw422016 := qt422016.AcquireWriter(qq422016)
|
||||
//line lib/protoparser/opentelemetry/pb/helpers.qtpl:64
|
||||
av.StreamFormatString(qw422016, toplevel)
|
||||
//line lib/protoparser/opentelemetry/pb/helpers.qtpl:64
|
||||
qt422016.ReleaseWriter(qw422016)
|
||||
//line lib/protoparser/opentelemetry/pb/helpers.qtpl:64
|
||||
}
|
||||
|
||||
//line lib/protoparser/opentelemetry/pb/helpers.qtpl:64
|
||||
func (av *AnyValue) FormatString(toplevel bool) string {
|
||||
//line lib/protoparser/opentelemetry/pb/helpers.qtpl:64
|
||||
qb422016 := qt422016.AcquireByteBuffer()
|
||||
//line lib/protoparser/opentelemetry/pb/helpers.qtpl:64
|
||||
av.WriteFormatString(qb422016, toplevel)
|
||||
//line lib/protoparser/opentelemetry/pb/helpers.qtpl:64
|
||||
qs422016 := string(qb422016.B)
|
||||
//line lib/protoparser/opentelemetry/pb/helpers.qtpl:64
|
||||
qt422016.ReleaseByteBuffer(qb422016)
|
||||
//line lib/protoparser/opentelemetry/pb/helpers.qtpl:64
|
||||
return qs422016
|
||||
//line lib/protoparser/opentelemetry/pb/helpers.qtpl:64
|
||||
}
|
||||
59
lib/protoparser/opentelemetry/pb/helpers_test.go
Normal file
59
lib/protoparser/opentelemetry/pb/helpers_test.go
Normal file
@@ -0,0 +1,59 @@
|
||||
package pb
|
||||
|
||||
import (
|
||||
"testing"
|
||||
)
|
||||
|
||||
func strptr(v string) *string {
|
||||
return &v
|
||||
}
|
||||
|
||||
func TestFormatString(t *testing.T) {
|
||||
f := func(attr *AnyValue, expected string) {
|
||||
t.Helper()
|
||||
got := attr.FormatString(true)
|
||||
if got != expected {
|
||||
t.Fatalf("unexpected attribute string representation, got: %s, want: %s", got, expected)
|
||||
}
|
||||
}
|
||||
|
||||
f(&AnyValue{
|
||||
StringValue: strptr("test1"),
|
||||
}, `test1`)
|
||||
f(&AnyValue{
|
||||
KeyValueList: &KeyValueList{
|
||||
Values: []*KeyValue{
|
||||
{
|
||||
Key: "test1",
|
||||
Value: &AnyValue{
|
||||
StringValue: strptr("1"),
|
||||
},
|
||||
},
|
||||
{
|
||||
Key: "test2",
|
||||
Value: &AnyValue{
|
||||
StringValue: strptr("2"),
|
||||
},
|
||||
},
|
||||
},
|
||||
},
|
||||
}, `{"test1":"1","test2":"2"}`)
|
||||
f(&AnyValue{
|
||||
ArrayValue: &ArrayValue{
|
||||
Values: []*AnyValue{
|
||||
{
|
||||
StringValue: strptr("1"),
|
||||
},
|
||||
{
|
||||
ArrayValue: &ArrayValue{
|
||||
Values: []*AnyValue{
|
||||
{
|
||||
StringValue: strptr("1"),
|
||||
},
|
||||
},
|
||||
},
|
||||
},
|
||||
},
|
||||
},
|
||||
}, `["1",["1"]]`)
|
||||
}
|
||||
@@ -267,7 +267,7 @@ func appendAttributesToPromLabels(dst []prompbmarshal.Label, attributes []*pb.Ke
|
||||
for _, at := range attributes {
|
||||
dst = append(dst, prompbmarshal.Label{
|
||||
Name: sanitizeLabelName(at.Key),
|
||||
Value: at.Value.FormatString(),
|
||||
Value: at.Value.FormatString(true),
|
||||
})
|
||||
}
|
||||
return dst
|
||||
|
||||
@@ -214,6 +214,105 @@ func TestParseStream(t *testing.T) {
|
||||
},
|
||||
true,
|
||||
)
|
||||
|
||||
// Test gauge with deeply nested attributes
|
||||
f(
|
||||
[]*pb.Metric{
|
||||
{
|
||||
Name: "my-gauge",
|
||||
Unit: "",
|
||||
Gauge: &pb.Gauge{
|
||||
DataPoints: []*pb.NumberDataPoint{
|
||||
{
|
||||
Attributes: []*pb.KeyValue{
|
||||
{
|
||||
Key: "label1",
|
||||
Value: &pb.AnyValue{
|
||||
StringValue: ptrTo("value1"),
|
||||
},
|
||||
},
|
||||
{
|
||||
Key: "emptylabelvalue",
|
||||
Value: &pb.AnyValue{},
|
||||
},
|
||||
{
|
||||
Key: "emptylabel",
|
||||
},
|
||||
{
|
||||
Key: "label_array",
|
||||
Value: &pb.AnyValue{
|
||||
ArrayValue: &pb.ArrayValue{
|
||||
Values: []*pb.AnyValue{
|
||||
{
|
||||
StringValue: ptrTo("value5"),
|
||||
},
|
||||
{
|
||||
KeyValueList: &pb.KeyValueList{},
|
||||
},
|
||||
},
|
||||
},
|
||||
},
|
||||
},
|
||||
{
|
||||
Key: "nested_label",
|
||||
Value: &pb.AnyValue{
|
||||
KeyValueList: &pb.KeyValueList{
|
||||
Values: []*pb.KeyValue{
|
||||
{
|
||||
Key: "empty_value",
|
||||
},
|
||||
{
|
||||
Key: "value_top_2",
|
||||
Value: &pb.AnyValue{
|
||||
StringValue: ptrTo("valuetop"),
|
||||
},
|
||||
},
|
||||
{
|
||||
Key: "nested_kv_list",
|
||||
Value: &pb.AnyValue{
|
||||
KeyValueList: &pb.KeyValueList{
|
||||
Values: []*pb.KeyValue{
|
||||
{
|
||||
Key: "integer",
|
||||
Value: &pb.AnyValue{IntValue: ptrTo(int64(15))},
|
||||
},
|
||||
{
|
||||
Key: "doable",
|
||||
Value: &pb.AnyValue{DoubleValue: ptrTo(5.1)},
|
||||
},
|
||||
{
|
||||
Key: "string",
|
||||
Value: &pb.AnyValue{StringValue: ptrTo("value2")},
|
||||
},
|
||||
},
|
||||
},
|
||||
},
|
||||
},
|
||||
},
|
||||
},
|
||||
},
|
||||
},
|
||||
},
|
||||
IntValue: ptrTo(int64(15)),
|
||||
TimeUnixNano: uint64(15 * time.Second),
|
||||
},
|
||||
},
|
||||
},
|
||||
},
|
||||
},
|
||||
[]prompbmarshal.TimeSeries{
|
||||
newPromPBTs("my-gauge",
|
||||
15000,
|
||||
15.0,
|
||||
jobLabelValue,
|
||||
kvLabel("label1", "value1"),
|
||||
kvLabel("emptylabelvalue", ""),
|
||||
kvLabel("emptylabel", ""),
|
||||
kvLabel("label_array", `["value5",{}]`),
|
||||
kvLabel("nested_label", `{"empty_value":null,"value_top_2":"valuetop","nested_kv_list":{"integer":15,"doable":5.1,"string":"value2"}}`)),
|
||||
},
|
||||
false,
|
||||
)
|
||||
}
|
||||
|
||||
func checkParseStream(data []byte, checkSeries func(tss []prompbmarshal.TimeSeries) error) error {
|
||||
@@ -429,3 +528,7 @@ func sortLabels(labels []prompbmarshal.Label) {
|
||||
return labels[i].Name < labels[j].Name
|
||||
})
|
||||
}
|
||||
|
||||
func ptrTo[T any](v T) *T {
|
||||
return &v
|
||||
}
|
||||
|
||||
605
lib/storage/metricnamestats/tracker.go
Normal file
605
lib/storage/metricnamestats/tracker.go
Normal file
@@ -0,0 +1,605 @@
|
||||
package metricnamestats
|
||||
|
||||
import (
|
||||
"compress/gzip"
|
||||
"encoding/json"
|
||||
"errors"
|
||||
"fmt"
|
||||
"io"
|
||||
"os"
|
||||
"path/filepath"
|
||||
"sort"
|
||||
"strings"
|
||||
"sync"
|
||||
"sync/atomic"
|
||||
|
||||
"github.com/VictoriaMetrics/VictoriaMetrics/lib/bytesutil"
|
||||
"github.com/VictoriaMetrics/VictoriaMetrics/lib/fasttime"
|
||||
"github.com/VictoriaMetrics/VictoriaMetrics/lib/logger"
|
||||
)
|
||||
|
||||
const (
|
||||
// metricNameBufSize can hold up to 64 metric name values
|
||||
// max size of metric name label value is 256
|
||||
// but usual size of metric name is 16-32
|
||||
metricNameBufSize = 16 * 1024
|
||||
statItemBufSize = 1024
|
||||
// statKey + statItem + approx key-value at map in-memory size
|
||||
storeOverhead = 24 + 16 + 24
|
||||
)
|
||||
|
||||
// Tracker implements in-memory tracker for timeseries metric names
|
||||
// it tracks ingest and query requests for metric names
|
||||
// and collects statistics
|
||||
//
|
||||
// main purpose of this tracker is to provide insights about metrics that have never been queried
|
||||
type Tracker struct {
|
||||
maxSizeBytes uint64
|
||||
cachePath string
|
||||
|
||||
creationTs atomic.Uint64
|
||||
currentSizeBytes atomic.Uint64
|
||||
currentItemsCount atomic.Uint64
|
||||
|
||||
// mu protect fields below
|
||||
mu sync.RWMutex
|
||||
|
||||
store map[statKey]*statItem
|
||||
// holds batch allocations for statItems at store
|
||||
statItemBuf []statItem
|
||||
// holds batch allocations for metric names at statKey
|
||||
metricNamesBuf []byte
|
||||
|
||||
// helper for tests
|
||||
getCurrentTs func() uint64
|
||||
}
|
||||
|
||||
type statKey struct {
|
||||
accountID uint32
|
||||
projectID uint32
|
||||
metricName string
|
||||
}
|
||||
|
||||
type statItem struct {
|
||||
requestsCount atomic.Uint64
|
||||
lastRequestTs atomic.Uint64
|
||||
}
|
||||
|
||||
type recordForStore struct {
|
||||
AccountID uint32
|
||||
ProjectID uint32
|
||||
MetricName string
|
||||
RequestsCount uint64
|
||||
LastRequestTs uint64
|
||||
}
|
||||
|
||||
// MustLoadFrom inits tracker from the given on-disk path
|
||||
func MustLoadFrom(loadPath string, maxSizeBytes uint64) *Tracker {
|
||||
mt, err := loadFrom(loadPath, maxSizeBytes)
|
||||
if err != nil {
|
||||
logger.Fatalf("unexpected error at tracker state load from path=%q: %s", loadPath, err)
|
||||
}
|
||||
return mt
|
||||
}
|
||||
|
||||
func loadFrom(loadPath string, maxSizeBytes uint64) (*Tracker, error) {
|
||||
mt := &Tracker{
|
||||
maxSizeBytes: maxSizeBytes,
|
||||
cachePath: loadPath,
|
||||
getCurrentTs: fasttime.UnixTimestamp,
|
||||
}
|
||||
mt.initEmpty()
|
||||
|
||||
f, err := os.Open(loadPath)
|
||||
if err != nil && !errors.Is(err, os.ErrNotExist) {
|
||||
return nil, fmt.Errorf("cannot access file content: %w", err)
|
||||
}
|
||||
// fast path
|
||||
if f == nil {
|
||||
return mt, nil
|
||||
}
|
||||
|
||||
defer f.Close()
|
||||
|
||||
zr, err := gzip.NewReader(f)
|
||||
if err != nil {
|
||||
return nil, fmt.Errorf("cannot create new gzip reader: %w", err)
|
||||
}
|
||||
reader := json.NewDecoder(zr)
|
||||
var storedMaxSizeBytes uint64
|
||||
if err := reader.Decode(&storedMaxSizeBytes); err != nil {
|
||||
if errors.Is(err, io.EOF) {
|
||||
return mt, nil
|
||||
}
|
||||
return nil, fmt.Errorf("cannot parse maxSizeBytes: %w", err)
|
||||
}
|
||||
if storedMaxSizeBytes > maxSizeBytes {
|
||||
logger.Infof("Reseting tracker state due to changed maxSizeBytes from %d to %d.", storedMaxSizeBytes, maxSizeBytes)
|
||||
return mt, nil
|
||||
}
|
||||
var creationTs uint64
|
||||
if err := reader.Decode(&creationTs); err != nil {
|
||||
return nil, fmt.Errorf("cannot parse creation timestamp: %w", err)
|
||||
}
|
||||
mt.creationTs.Store(creationTs)
|
||||
var cnt uint64
|
||||
var size uint64
|
||||
var r recordForStore
|
||||
for {
|
||||
if err := reader.Decode(&r); err != nil {
|
||||
if errors.Is(err, io.EOF) {
|
||||
break
|
||||
}
|
||||
return nil, fmt.Errorf("cannot parse state record: %w", err)
|
||||
}
|
||||
// during cache load, there is no need to hold lock
|
||||
si := mt.nextRecordLocked()
|
||||
|
||||
si.lastRequestTs.Store(r.LastRequestTs)
|
||||
si.requestsCount.Store(r.RequestsCount)
|
||||
|
||||
key := statKey{
|
||||
projectID: r.ProjectID,
|
||||
accountID: r.AccountID,
|
||||
metricName: mt.cloneMetricNameLocked([]byte(r.MetricName)),
|
||||
}
|
||||
mt.store[key] = si
|
||||
size += uint64(len(r.MetricName)) + storeOverhead
|
||||
cnt++
|
||||
}
|
||||
if err := zr.Close(); err != nil {
|
||||
return nil, fmt.Errorf("cannot close gzip reader: %w", err)
|
||||
}
|
||||
|
||||
mt.currentSizeBytes.Store(size)
|
||||
mt.currentItemsCount.Store(cnt)
|
||||
logger.Infof("loaded state from disk, records: %d, total size: %d", cnt, size)
|
||||
return mt, nil
|
||||
}
|
||||
|
||||
func (mt *Tracker) nextRecordLocked() *statItem {
|
||||
n := len(mt.statItemBuf) + 1
|
||||
if n > cap(mt.statItemBuf) {
|
||||
// allocate a new slice instead of reallocating exist
|
||||
// it saves memory and reduces GC pressure
|
||||
mt.statItemBuf = make([]statItem, 0, statItemBufSize)
|
||||
n = 1
|
||||
}
|
||||
mt.statItemBuf = mt.statItemBuf[:n]
|
||||
st := &mt.statItemBuf[n-1]
|
||||
|
||||
return st
|
||||
}
|
||||
|
||||
// cloneMetricNameLocked uses the same idea as strings.Clone.
|
||||
// But instead of direct []byte allocation for each cloned string,
|
||||
// it allocates metricNamesBuf, copies provide metricGroup into it
|
||||
// and uses string *byte references for it via subslice.
|
||||
func (mt *Tracker) cloneMetricNameLocked(metricName []byte) string {
|
||||
idx := len(mt.metricNamesBuf)
|
||||
n := len(metricName) + len(mt.metricNamesBuf)
|
||||
if n > cap(mt.metricNamesBuf) {
|
||||
// allocate a new slice instead of reallocting exist
|
||||
// it saves memory and reduces GC pressure
|
||||
mt.metricNamesBuf = make([]byte, 0, metricNameBufSize)
|
||||
idx = 0
|
||||
}
|
||||
mt.metricNamesBuf = append(mt.metricNamesBuf, metricName...)
|
||||
return bytesutil.ToUnsafeString(mt.metricNamesBuf[idx:])
|
||||
}
|
||||
|
||||
// MustClose closes tracker and saves state on disk
|
||||
func (mt *Tracker) MustClose() {
|
||||
if mt == nil {
|
||||
return
|
||||
}
|
||||
if err := mt.saveLocked(); err != nil {
|
||||
logger.Panicf("cannot save tracker state at path=%q: %s", mt.cachePath, err)
|
||||
}
|
||||
}
|
||||
|
||||
// saveLocked stores in-memory state of tracker on disk
|
||||
func (mt *Tracker) saveLocked() error {
|
||||
// Create dir if it doesn't exist in the same manner as other caches doing
|
||||
dir, fileName := filepath.Split(mt.cachePath)
|
||||
if _, err := os.Stat(dir); err != nil {
|
||||
if !os.IsNotExist(err) {
|
||||
return fmt.Errorf("cannot stat %q: %s", dir, err)
|
||||
}
|
||||
if err := os.MkdirAll(dir, 0755); err != nil {
|
||||
return fmt.Errorf("cannot create dir %q: %s", dir, err)
|
||||
}
|
||||
}
|
||||
|
||||
// create temp directory in the same directory where original file located
|
||||
// it's needed to mitigate cross block-device rename error.
|
||||
tempDir, err := os.MkdirTemp(dir, "metricnamestats.tmp.")
|
||||
if err != nil {
|
||||
return fmt.Errorf("cannot create tempDir for state save: %w", err)
|
||||
}
|
||||
defer func() {
|
||||
if tempDir != "" {
|
||||
_ = os.RemoveAll(tempDir)
|
||||
}
|
||||
}()
|
||||
|
||||
f, err := os.Create(filepath.Join(tempDir, fileName))
|
||||
if err != nil {
|
||||
return fmt.Errorf("cannot open file for state save: %w", err)
|
||||
}
|
||||
defer f.Close()
|
||||
zw := gzip.NewWriter(f)
|
||||
writer := json.NewEncoder(zw)
|
||||
if err := writer.Encode(mt.maxSizeBytes); err != nil {
|
||||
return fmt.Errorf("cannot save encoded maxSizeBytes: %w", err)
|
||||
}
|
||||
if err := writer.Encode(mt.creationTs.Load()); err != nil {
|
||||
return fmt.Errorf("cannot save encoded creation timestamp: %w", err)
|
||||
}
|
||||
|
||||
var r recordForStore
|
||||
for sk, si := range mt.store {
|
||||
r.AccountID = sk.accountID
|
||||
r.ProjectID = sk.projectID
|
||||
r.MetricName = sk.metricName
|
||||
r.LastRequestTs = si.lastRequestTs.Load()
|
||||
r.RequestsCount = si.requestsCount.Load()
|
||||
if err := writer.Encode(r); err != nil {
|
||||
return fmt.Errorf("cannot save encoded state record: %w", err)
|
||||
}
|
||||
}
|
||||
if err := zw.Close(); err != nil {
|
||||
return fmt.Errorf("cannot flush writer state: %w", err)
|
||||
}
|
||||
// atomically save result
|
||||
if err := os.Rename(f.Name(), mt.cachePath); err != nil {
|
||||
return fmt.Errorf("cannot move temporary file %q to %q: %s", f.Name(), mt.cachePath, err)
|
||||
}
|
||||
return nil
|
||||
}
|
||||
|
||||
// TrackerMetrics holds metrics to report
|
||||
type TrackerMetrics struct {
|
||||
CurrentSizeBytes uint64
|
||||
CurrentItemsCount uint64
|
||||
MaxSizeBytes uint64
|
||||
}
|
||||
|
||||
// UpdateMetrics writes internal metrics to the provided object
|
||||
func (mt *Tracker) UpdateMetrics(dst *TrackerMetrics) {
|
||||
if mt == nil {
|
||||
return
|
||||
}
|
||||
dst.CurrentSizeBytes = mt.currentSizeBytes.Load()
|
||||
dst.CurrentItemsCount = mt.currentItemsCount.Load()
|
||||
dst.MaxSizeBytes = mt.maxSizeBytes
|
||||
}
|
||||
|
||||
// IsEmpty checks if internal state has any records
|
||||
func (mt *Tracker) IsEmpty() bool {
|
||||
return mt.currentItemsCount.Load() == 0
|
||||
}
|
||||
|
||||
// Reset cleans stats, saves cache state and executes provided func
|
||||
func (mt *Tracker) Reset(onReset func()) {
|
||||
if mt == nil {
|
||||
return
|
||||
}
|
||||
logger.Infof("reseting metric names tracker state")
|
||||
mt.mu.Lock()
|
||||
defer mt.mu.Unlock()
|
||||
mt.initEmpty()
|
||||
if err := mt.saveLocked(); err != nil {
|
||||
logger.Panicf("during Tracker reset cannot save state: %s", err)
|
||||
}
|
||||
onReset()
|
||||
}
|
||||
|
||||
func (mt *Tracker) initEmpty() {
|
||||
mt.store = make(map[statKey]*statItem)
|
||||
mt.metricNamesBuf = make([]byte, 0, metricNameBufSize)
|
||||
mt.statItemBuf = make([]statItem, 0, statItemBufSize)
|
||||
mt.currentSizeBytes.Store(0)
|
||||
mt.currentItemsCount.Store(0)
|
||||
mt.creationTs.Store(mt.getCurrentTs())
|
||||
}
|
||||
|
||||
// RegisterIngestRequest tracks metric name ingestion
|
||||
func (mt *Tracker) RegisterIngestRequest(accountID, projectID uint32, metricName []byte) {
|
||||
if mt == nil {
|
||||
return
|
||||
}
|
||||
if mt.cacheIsFull() {
|
||||
return
|
||||
}
|
||||
|
||||
sk := statKey{
|
||||
accountID: accountID,
|
||||
projectID: projectID,
|
||||
metricName: bytesutil.ToUnsafeString(metricName),
|
||||
}
|
||||
mt.mu.RLock()
|
||||
_, ok := mt.store[sk]
|
||||
mt.mu.RUnlock()
|
||||
if ok {
|
||||
return
|
||||
}
|
||||
|
||||
mt.mu.Lock()
|
||||
// key could be already ingested concurrently
|
||||
_, ok = mt.store[sk]
|
||||
if ok {
|
||||
mt.mu.Unlock()
|
||||
return
|
||||
}
|
||||
si := mt.nextRecordLocked()
|
||||
sk.metricName = mt.cloneMetricNameLocked(metricName)
|
||||
mt.store[sk] = si
|
||||
mt.mu.Unlock()
|
||||
|
||||
mt.currentSizeBytes.Add(uint64(len(metricName)) + storeOverhead)
|
||||
mt.currentItemsCount.Add(1)
|
||||
}
|
||||
|
||||
// RegisterQueryRequest tracks metric name at query request
|
||||
func (mt *Tracker) RegisterQueryRequest(accountID, projectID uint32, metricName []byte) {
|
||||
if mt == nil {
|
||||
return
|
||||
}
|
||||
mt.mu.RLock()
|
||||
key := statKey{
|
||||
accountID: accountID,
|
||||
projectID: projectID,
|
||||
metricName: bytesutil.ToUnsafeString(metricName),
|
||||
}
|
||||
si, ok := mt.store[key]
|
||||
mt.mu.RUnlock()
|
||||
if !ok {
|
||||
return
|
||||
}
|
||||
si.lastRequestTs.Store(mt.getCurrentTs())
|
||||
si.requestsCount.Add(1)
|
||||
}
|
||||
|
||||
func (mt *Tracker) cacheIsFull() bool {
|
||||
return mt.currentSizeBytes.Load() > mt.maxSizeBytes
|
||||
}
|
||||
|
||||
// GetStatsForTenant returns stats response for the tracked metrics for given tenant
|
||||
func (mt *Tracker) GetStatsForTenant(accountID, projectID uint32, limit, le int, matchPattern string) StatsResult {
|
||||
var result StatsResult
|
||||
if mt == nil {
|
||||
return result
|
||||
}
|
||||
mt.mu.RLock()
|
||||
|
||||
result = mt.getStatsLocked(limit, func(sk *statKey, si *statItem) bool {
|
||||
if sk.accountID != accountID || sk.projectID != projectID {
|
||||
return false
|
||||
}
|
||||
if le >= 0 && int(si.requestsCount.Load()) > le {
|
||||
return false
|
||||
}
|
||||
if len(matchPattern) > 0 && !strings.Contains(sk.metricName, matchPattern) {
|
||||
return false
|
||||
}
|
||||
return true
|
||||
})
|
||||
mt.mu.RUnlock()
|
||||
|
||||
result.sort()
|
||||
return result
|
||||
}
|
||||
|
||||
// GetStats returns stats response for the tracked metrics
|
||||
//
|
||||
// DeduplicateMergeRecords must be called at cluster version on returned result.
|
||||
func (mt *Tracker) GetStats(limit, le int, matchPattern string) StatsResult {
|
||||
var result StatsResult
|
||||
if mt == nil {
|
||||
return result
|
||||
}
|
||||
mt.mu.RLock()
|
||||
|
||||
result = mt.getStatsLocked(limit, func(sk *statKey, si *statItem) bool {
|
||||
if le >= 0 && int(si.requestsCount.Load()) > le {
|
||||
return false
|
||||
}
|
||||
if len(matchPattern) > 0 && !strings.Contains(sk.metricName, matchPattern) {
|
||||
return false
|
||||
}
|
||||
return true
|
||||
})
|
||||
mt.mu.RUnlock()
|
||||
|
||||
result.sort()
|
||||
return result
|
||||
}
|
||||
|
||||
func (mt *Tracker) getStatsLocked(limit int, predicate func(sk *statKey, si *statItem) bool) StatsResult {
|
||||
var result StatsResult
|
||||
|
||||
result.CollectedSinceTs = mt.creationTs.Load()
|
||||
result.TotalRecords = mt.currentItemsCount.Load()
|
||||
result.MaxSizeBytes = mt.maxSizeBytes
|
||||
result.CurrentSizeBytes = mt.currentSizeBytes.Load()
|
||||
|
||||
for sk, si := range mt.store {
|
||||
if len(result.Records) >= limit {
|
||||
return result
|
||||
}
|
||||
if predicate(&sk, si) {
|
||||
result.Records = append(result.Records, StatRecord{
|
||||
MetricName: sk.metricName,
|
||||
RequestsCount: si.requestsCount.Load(),
|
||||
LastRequestTs: si.lastRequestTs.Load(),
|
||||
})
|
||||
}
|
||||
}
|
||||
return result
|
||||
}
|
||||
|
||||
// StatsResult defines stats result for GetStats request
|
||||
type StatsResult struct {
|
||||
CollectedSinceTs uint64
|
||||
TotalRecords uint64
|
||||
MaxSizeBytes uint64
|
||||
CurrentSizeBytes uint64
|
||||
Records []StatRecord
|
||||
}
|
||||
|
||||
// StatRecord defines stat record for given metric name
|
||||
type StatRecord struct {
|
||||
MetricName string
|
||||
RequestsCount uint64
|
||||
LastRequestTs uint64
|
||||
}
|
||||
|
||||
func (sr *StatsResult) sort() {
|
||||
sort.Slice(sr.Records, func(i, j int) bool {
|
||||
return sr.Records[i].MetricName < sr.Records[j].MetricName
|
||||
})
|
||||
}
|
||||
|
||||
// DeduplicateMergeRecords performs merging duplicate records by metric name
|
||||
//
|
||||
// It is usual case for global tenant request at cluster version.
|
||||
func (sr *StatsResult) DeduplicateMergeRecords() {
|
||||
if len(sr.Records) < 2 {
|
||||
return
|
||||
}
|
||||
tmp := sr.Records[:0]
|
||||
// deduplication uses sliding indexes
|
||||
//
|
||||
// records:
|
||||
// [ 0 1 2 3 4 5 6 ]
|
||||
//
|
||||
// [ mn1, mn2, mn2, mn2, mn3, mn4, mn4 ]
|
||||
//
|
||||
// 0 1
|
||||
// 0 2
|
||||
// 2 3
|
||||
// 2 4
|
||||
// 2 5
|
||||
// 5 6
|
||||
//
|
||||
// result:
|
||||
//
|
||||
// [0,1,4,5]
|
||||
|
||||
i := 0
|
||||
j := 1
|
||||
rCurr := sr.Records[i]
|
||||
rNext := sr.Records[j]
|
||||
for {
|
||||
if rCurr.MetricName == rNext.MetricName {
|
||||
rCurr.RequestsCount += rNext.RequestsCount
|
||||
if rCurr.LastRequestTs < rNext.LastRequestTs {
|
||||
rCurr.LastRequestTs = rNext.LastRequestTs
|
||||
}
|
||||
j++
|
||||
if j >= len(sr.Records) {
|
||||
tmp = append(tmp, rCurr)
|
||||
break
|
||||
}
|
||||
} else {
|
||||
tmp = append(tmp, rCurr)
|
||||
i = j
|
||||
rCurr = sr.Records[i]
|
||||
j++
|
||||
if j >= len(sr.Records) {
|
||||
tmp = append(tmp, rNext)
|
||||
break
|
||||
}
|
||||
}
|
||||
rNext = sr.Records[j]
|
||||
}
|
||||
sr.Records = tmp
|
||||
}
|
||||
|
||||
// Sort sorts records by metric name and requests count
|
||||
func (sr *StatsResult) Sort() {
|
||||
sort.Slice(sr.Records, func(i, j int) bool {
|
||||
if sr.Records[i].RequestsCount == sr.Records[j].RequestsCount {
|
||||
return sr.Records[i].MetricName < sr.Records[j].MetricName
|
||||
}
|
||||
return sr.Records[i].RequestsCount < sr.Records[j].RequestsCount
|
||||
})
|
||||
}
|
||||
|
||||
// Merge adds records from given src
|
||||
//
|
||||
// It expected src to be sorted by metricName
|
||||
func (sr *StatsResult) Merge(src *StatsResult) {
|
||||
if sr.CollectedSinceTs < src.CollectedSinceTs {
|
||||
sr.CollectedSinceTs = src.CollectedSinceTs
|
||||
}
|
||||
sr.TotalRecords += src.TotalRecords
|
||||
sr.CurrentSizeBytes += src.CurrentSizeBytes
|
||||
sr.MaxSizeBytes += src.MaxSizeBytes
|
||||
|
||||
if len(src.Records) == 0 {
|
||||
return
|
||||
}
|
||||
if len(sr.Records) == 0 {
|
||||
sr.Records = append(sr.Records, src.Records...)
|
||||
return
|
||||
}
|
||||
// merge sorted elements into new slice
|
||||
// records:
|
||||
// [ mn1, mn2, mn3, mn4, mn6 ]
|
||||
// [ mn2, mn4, mn5 ]
|
||||
// 0
|
||||
// 0
|
||||
// [ ]
|
||||
// 1
|
||||
// 0
|
||||
// [ mn1 ]
|
||||
// 2
|
||||
// 1
|
||||
// [ mn1, mn2 ]
|
||||
// 3
|
||||
// 1
|
||||
// [ mn1, mn2, mn3 ]
|
||||
// 4
|
||||
// 2
|
||||
// [ mn1, mn2, mn3, mn4 ]
|
||||
// 4
|
||||
// -
|
||||
// [ mn1, mn2, mn3, mn4, mn5 ]
|
||||
//
|
||||
// [ mn1, mn2, mn3, mn4, mn5, mn6 ]
|
||||
i := 0
|
||||
j := 0
|
||||
// TODO: probably, we can append src records to sr instead of allocating new slice
|
||||
// it will require to perform sort on sr and probably will use more CPU, but less memory
|
||||
result := make([]StatRecord, 0, len(sr.Records))
|
||||
for {
|
||||
if i >= len(sr.Records) {
|
||||
result = append(result, src.Records[j:]...)
|
||||
break
|
||||
}
|
||||
if j >= len(src.Records) {
|
||||
result = append(result, sr.Records[i:]...)
|
||||
break
|
||||
}
|
||||
left, right := sr.Records[i], src.Records[j]
|
||||
switch {
|
||||
case left.MetricName == right.MetricName:
|
||||
left.RequestsCount += right.RequestsCount
|
||||
if left.LastRequestTs < right.LastRequestTs {
|
||||
left.LastRequestTs = right.LastRequestTs
|
||||
}
|
||||
result = append(result, left)
|
||||
i++
|
||||
j++
|
||||
case left.MetricName < right.MetricName:
|
||||
result = append(result, left)
|
||||
i++
|
||||
case left.MetricName > right.MetricName:
|
||||
result = append(result, right)
|
||||
j++
|
||||
}
|
||||
}
|
||||
sr.Records = result
|
||||
}
|
||||
564
lib/storage/metricnamestats/tracker_test.go
Normal file
564
lib/storage/metricnamestats/tracker_test.go
Normal file
@@ -0,0 +1,564 @@
|
||||
package metricnamestats
|
||||
|
||||
import (
|
||||
"path"
|
||||
"sync"
|
||||
"testing"
|
||||
|
||||
"github.com/google/go-cmp/cmp"
|
||||
"github.com/google/go-cmp/cmp/cmpopts"
|
||||
)
|
||||
|
||||
var statsResultCmpOpts = cmpopts.IgnoreFields(StatsResult{}, "CollectedSinceTs", "MaxSizeBytes", "CurrentSizeBytes")
|
||||
|
||||
func TestMetricsTracker(t *testing.T) {
|
||||
type testOp struct {
|
||||
aID uint32
|
||||
pID uint32
|
||||
o byte
|
||||
mg string
|
||||
ts uint64
|
||||
}
|
||||
type queryOpts struct {
|
||||
accountID uint32
|
||||
projectID uint32
|
||||
isTenantEmpty bool
|
||||
limit int
|
||||
lte int
|
||||
matchPattern string
|
||||
}
|
||||
cmpOpts := cmpopts.IgnoreFields(StatsResult{}, "CollectedSinceTs", "MaxSizeBytes", "CurrentSizeBytes")
|
||||
cachePath := path.Join(t.TempDir(), t.Name())
|
||||
f := func(ops []testOp, qo queryOpts, expected StatsResult) {
|
||||
t.Helper()
|
||||
expected.sort()
|
||||
mt, err := loadFrom(cachePath, 100_000)
|
||||
if err != nil {
|
||||
t.Fatalf("cannot load state from disk on init: %s", err)
|
||||
}
|
||||
for _, op := range ops {
|
||||
mt.getCurrentTs = func() uint64 {
|
||||
return op.ts
|
||||
}
|
||||
switch op.o {
|
||||
case 'i':
|
||||
mt.RegisterIngestRequest(op.aID, op.pID, []byte(op.mg))
|
||||
case 'r':
|
||||
mt.RegisterQueryRequest(op.aID, op.pID, []byte(op.mg))
|
||||
}
|
||||
}
|
||||
var got StatsResult
|
||||
if qo.isTenantEmpty {
|
||||
got = mt.GetStats(qo.limit, qo.lte, qo.matchPattern)
|
||||
got.sort()
|
||||
got.DeduplicateMergeRecords()
|
||||
} else {
|
||||
got = mt.GetStatsForTenant(qo.accountID, qo.projectID, qo.limit, qo.lte, qo.matchPattern)
|
||||
got.sort()
|
||||
}
|
||||
if !cmp.Equal(expected, got, cmpOpts) {
|
||||
t.Fatalf("unexpected GetStatsForTenant result: %s", cmp.Diff(expected, got, cmpOpts))
|
||||
}
|
||||
if err := mt.saveLocked(); err != nil {
|
||||
t.Fatalf("cannot save in-memory state: %s", err)
|
||||
}
|
||||
loadedUmt, err := loadFrom(cachePath, 100_000)
|
||||
if err != nil {
|
||||
t.Fatalf("cannot load restore state from disk: %s", err)
|
||||
}
|
||||
if qo.isTenantEmpty {
|
||||
got = loadedUmt.GetStats(qo.limit, qo.lte, qo.matchPattern)
|
||||
got.sort()
|
||||
got.DeduplicateMergeRecords()
|
||||
} else {
|
||||
got = loadedUmt.GetStatsForTenant(qo.accountID, qo.projectID, qo.limit, qo.lte, qo.matchPattern)
|
||||
got.sort()
|
||||
}
|
||||
if !cmp.Equal(expected, got, cmpOpts) {
|
||||
t.Fatalf("unexpected GetStatsForTenant result after load state from disk: %s", cmp.Diff(expected, got, cmpOpts))
|
||||
}
|
||||
mt.Reset(func() {})
|
||||
}
|
||||
|
||||
dataSet := []testOp{
|
||||
{1, 1, 'i', "metric_1", 1},
|
||||
{1, 1, 'i', "metric_1", 1},
|
||||
{1, 1, 'r', "metric_1", 1},
|
||||
{1, 1, 'i', "metric_2", 1},
|
||||
{1, 1, 'r', "metric_2", 1},
|
||||
{1, 1, 'r', "metric_2", 1},
|
||||
{15, 15, 'i', "metric_1", 1},
|
||||
{15, 15, 'i', "metric_2", 1},
|
||||
{15, 15, 'i', "metric_3", 1},
|
||||
{15, 15, 'r', "metric_3", 1},
|
||||
{15, 15, 'r', "metric_2", 1},
|
||||
}
|
||||
qOpts := queryOpts{
|
||||
limit: 100,
|
||||
lte: -1,
|
||||
}
|
||||
// query empty tenant
|
||||
expected := StatsResult{
|
||||
TotalRecords: 5,
|
||||
}
|
||||
f(dataSet, qOpts, expected)
|
||||
|
||||
// query single tenant
|
||||
qOpts = queryOpts{
|
||||
accountID: 1,
|
||||
projectID: 1,
|
||||
limit: 100,
|
||||
lte: -1,
|
||||
}
|
||||
expected = StatsResult{
|
||||
TotalRecords: 5,
|
||||
Records: []StatRecord{
|
||||
{"metric_1", 1, 1},
|
||||
{"metric_2", 2, 1},
|
||||
},
|
||||
}
|
||||
f(dataSet, qOpts, expected)
|
||||
|
||||
// query all tenants
|
||||
qOpts = queryOpts{
|
||||
isTenantEmpty: true,
|
||||
limit: 100,
|
||||
lte: -1,
|
||||
}
|
||||
expected = StatsResult{
|
||||
TotalRecords: 5,
|
||||
Records: []StatRecord{
|
||||
{"metric_1", 1, 1},
|
||||
{"metric_2", 3, 1},
|
||||
{"metric_3", 1, 1},
|
||||
},
|
||||
}
|
||||
f(dataSet, qOpts, expected)
|
||||
}
|
||||
|
||||
func TestMetricsTrackerConcurrent(t *testing.T) {
|
||||
type testOp struct {
|
||||
o byte
|
||||
mg string
|
||||
}
|
||||
const concurrency = 3
|
||||
f := func(ops []testOp, predicate int, expected StatsResult) {
|
||||
t.Helper()
|
||||
umt, err := loadFrom(t.TempDir()+t.Name(), 1024)
|
||||
if err != nil {
|
||||
t.Fatalf("cannot load: %s", err)
|
||||
}
|
||||
umt.creationTs.Store(0)
|
||||
umt.getCurrentTs = func() uint64 { return 1 }
|
||||
for _, op := range ops {
|
||||
switch op.o {
|
||||
case 'i':
|
||||
umt.RegisterIngestRequest(0, 0, []byte(op.mg))
|
||||
case 'r':
|
||||
umt.RegisterQueryRequest(0, 0, []byte(op.mg))
|
||||
}
|
||||
}
|
||||
|
||||
var wg sync.WaitGroup
|
||||
for range concurrency {
|
||||
wg.Add(1)
|
||||
go func() {
|
||||
defer wg.Done()
|
||||
for _, op := range ops {
|
||||
switch op.o {
|
||||
case 'i':
|
||||
umt.RegisterIngestRequest(0, 0, []byte(op.mg))
|
||||
case 'r':
|
||||
umt.RegisterQueryRequest(0, 0, []byte(op.mg))
|
||||
}
|
||||
}
|
||||
}()
|
||||
}
|
||||
wg.Wait()
|
||||
|
||||
got := umt.GetStats(100, predicate, "")
|
||||
got.sort()
|
||||
expected.sort()
|
||||
if !cmp.Equal(expected.Records, got.Records) {
|
||||
t.Fatalf("unexpected unusedMetricNames result: %s", cmp.Diff(expected.Records, got.Records))
|
||||
}
|
||||
}
|
||||
f([]testOp{{'i', "metric_1"}, {'r', "metric_2"}, {'r', "metric_1"}, {'i', "metric_3"}},
|
||||
0,
|
||||
StatsResult{
|
||||
Records: []StatRecord{
|
||||
{
|
||||
MetricName: "metric_3",
|
||||
},
|
||||
},
|
||||
})
|
||||
f([]testOp{{'i', "metric_1"}, {'i', "metric_2"}, {'r', "metric_2"}, {'r', "metric_2"}, {'r', "metric_1"}, {'i', "metric_3"}},
|
||||
10,
|
||||
StatsResult{
|
||||
Records: []StatRecord{
|
||||
{
|
||||
MetricName: "metric_1",
|
||||
RequestsCount: 1 + concurrency,
|
||||
LastRequestTs: 1,
|
||||
},
|
||||
{
|
||||
MetricName: "metric_2",
|
||||
RequestsCount: 2 + 2*concurrency,
|
||||
LastRequestTs: 1,
|
||||
},
|
||||
{
|
||||
MetricName: "metric_3",
|
||||
LastRequestTs: 0,
|
||||
},
|
||||
},
|
||||
})
|
||||
|
||||
}
|
||||
|
||||
func TestMetricsTrackerMaxSize(t *testing.T) {
|
||||
type testOp struct {
|
||||
o byte
|
||||
mg string
|
||||
}
|
||||
|
||||
umt, err := loadFrom(t.TempDir()+t.Name(), storeOverhead+10*2)
|
||||
if err != nil {
|
||||
t.Fatalf("cannot load tracker: %s", err)
|
||||
}
|
||||
umt.getCurrentTs = func() uint64 { return 1 }
|
||||
ops := []testOp{
|
||||
{'i', "metric_1"},
|
||||
{'r', "metric_2"},
|
||||
{'r', "metric_1"},
|
||||
{'i', "metric_2"},
|
||||
{'i', "metric_3"},
|
||||
{'i', "metric_4"},
|
||||
{'r', "metric_1"},
|
||||
{'r', "metric_2"},
|
||||
{'r', "metric_2"},
|
||||
{'r', "metric_2"},
|
||||
}
|
||||
for _, op := range ops {
|
||||
switch op.o {
|
||||
case 'i':
|
||||
umt.RegisterIngestRequest(0, 0, []byte(op.mg))
|
||||
case 'r':
|
||||
umt.RegisterQueryRequest(0, 0, []byte(op.mg))
|
||||
}
|
||||
}
|
||||
got := umt.GetStats(100, -1, "")
|
||||
got.sort()
|
||||
expected := StatsResult{
|
||||
Records: []StatRecord{
|
||||
{
|
||||
MetricName: "metric_1",
|
||||
RequestsCount: 2,
|
||||
LastRequestTs: 1,
|
||||
},
|
||||
{
|
||||
MetricName: "metric_2",
|
||||
RequestsCount: 3,
|
||||
LastRequestTs: 1,
|
||||
},
|
||||
},
|
||||
}
|
||||
|
||||
if !cmp.Equal(expected.Records, got.Records) {
|
||||
t.Fatalf("unexpected unusedMetricNames result: %s", cmp.Diff(expected.Records, got.Records))
|
||||
}
|
||||
}
|
||||
|
||||
func TestDeduplicateRecords(t *testing.T) {
|
||||
f := func(result StatsResult, expected StatsResult) {
|
||||
t.Helper()
|
||||
expected.sort()
|
||||
result.sort()
|
||||
result.DeduplicateMergeRecords()
|
||||
if !cmp.Equal(result, expected, statsResultCmpOpts) {
|
||||
t.Fatalf("unexpected deduplicate result: %s", cmp.Diff(result, expected, statsResultCmpOpts))
|
||||
}
|
||||
}
|
||||
|
||||
// single record
|
||||
dataSet := StatsResult{
|
||||
Records: []StatRecord{
|
||||
{MetricName: "mn1", RequestsCount: 10, LastRequestTs: 1},
|
||||
},
|
||||
}
|
||||
expected := StatsResult{
|
||||
Records: []StatRecord{
|
||||
{MetricName: "mn1", RequestsCount: 10, LastRequestTs: 1},
|
||||
},
|
||||
}
|
||||
f(dataSet, expected)
|
||||
|
||||
// no duplicates
|
||||
dataSet = StatsResult{
|
||||
Records: []StatRecord{
|
||||
{MetricName: "mn1", RequestsCount: 10, LastRequestTs: 1},
|
||||
{MetricName: "mn2", RequestsCount: 12, LastRequestTs: 2},
|
||||
{MetricName: "mn3", RequestsCount: 13, LastRequestTs: 3},
|
||||
{MetricName: "mn4", RequestsCount: 15, LastRequestTs: 4},
|
||||
},
|
||||
}
|
||||
expected = StatsResult{
|
||||
Records: []StatRecord{
|
||||
{MetricName: "mn1", RequestsCount: 10, LastRequestTs: 1},
|
||||
{MetricName: "mn2", RequestsCount: 12, LastRequestTs: 2},
|
||||
{MetricName: "mn3", RequestsCount: 13, LastRequestTs: 3},
|
||||
{MetricName: "mn4", RequestsCount: 15, LastRequestTs: 4},
|
||||
},
|
||||
}
|
||||
f(dataSet, expected)
|
||||
|
||||
// 2 duplicates
|
||||
dataSet = StatsResult{
|
||||
Records: []StatRecord{
|
||||
{MetricName: "mn1", RequestsCount: 10, LastRequestTs: 1},
|
||||
{MetricName: "mn1", RequestsCount: 10, LastRequestTs: 1},
|
||||
},
|
||||
}
|
||||
expected = StatsResult{
|
||||
Records: []StatRecord{
|
||||
{MetricName: "mn1", RequestsCount: 20, LastRequestTs: 1},
|
||||
},
|
||||
}
|
||||
f(dataSet, expected)
|
||||
|
||||
// duplicates on start
|
||||
dataSet = StatsResult{
|
||||
Records: []StatRecord{
|
||||
{MetricName: "mn1", RequestsCount: 10, LastRequestTs: 1},
|
||||
{MetricName: "mn1", RequestsCount: 10, LastRequestTs: 1},
|
||||
{MetricName: "mn2", RequestsCount: 12, LastRequestTs: 2},
|
||||
{MetricName: "mn3", RequestsCount: 13, LastRequestTs: 3},
|
||||
{MetricName: "mn4", RequestsCount: 15, LastRequestTs: 4},
|
||||
},
|
||||
}
|
||||
expected = StatsResult{
|
||||
Records: []StatRecord{
|
||||
{MetricName: "mn1", RequestsCount: 20, LastRequestTs: 1},
|
||||
{MetricName: "mn2", RequestsCount: 12, LastRequestTs: 2},
|
||||
{MetricName: "mn3", RequestsCount: 13, LastRequestTs: 3},
|
||||
{MetricName: "mn4", RequestsCount: 15, LastRequestTs: 4},
|
||||
},
|
||||
}
|
||||
f(dataSet, expected)
|
||||
|
||||
// duplicates on end
|
||||
dataSet = StatsResult{
|
||||
Records: []StatRecord{
|
||||
{MetricName: "mn1", RequestsCount: 10, LastRequestTs: 1},
|
||||
{MetricName: "mn2", RequestsCount: 12, LastRequestTs: 2},
|
||||
{MetricName: "mn3", RequestsCount: 13, LastRequestTs: 3},
|
||||
{MetricName: "mn4", RequestsCount: 15, LastRequestTs: 4},
|
||||
{MetricName: "mn4", RequestsCount: 15, LastRequestTs: 4},
|
||||
},
|
||||
}
|
||||
expected = StatsResult{
|
||||
Records: []StatRecord{
|
||||
{MetricName: "mn1", RequestsCount: 10, LastRequestTs: 1},
|
||||
{MetricName: "mn2", RequestsCount: 12, LastRequestTs: 2},
|
||||
{MetricName: "mn3", RequestsCount: 13, LastRequestTs: 3},
|
||||
{MetricName: "mn4", RequestsCount: 30, LastRequestTs: 4},
|
||||
},
|
||||
}
|
||||
f(dataSet, expected)
|
||||
|
||||
// duplicates start end
|
||||
dataSet = StatsResult{
|
||||
Records: []StatRecord{
|
||||
{MetricName: "mn1", RequestsCount: 10, LastRequestTs: 1},
|
||||
{MetricName: "mn1", RequestsCount: 10, LastRequestTs: 1},
|
||||
{MetricName: "mn2", RequestsCount: 12, LastRequestTs: 2},
|
||||
{MetricName: "mn3", RequestsCount: 13, LastRequestTs: 3},
|
||||
{MetricName: "mn4", RequestsCount: 15, LastRequestTs: 4},
|
||||
{MetricName: "mn4", RequestsCount: 15, LastRequestTs: 4},
|
||||
},
|
||||
}
|
||||
expected = StatsResult{
|
||||
Records: []StatRecord{
|
||||
{MetricName: "mn1", RequestsCount: 20, LastRequestTs: 1},
|
||||
{MetricName: "mn2", RequestsCount: 12, LastRequestTs: 2},
|
||||
{MetricName: "mn3", RequestsCount: 13, LastRequestTs: 3},
|
||||
{MetricName: "mn4", RequestsCount: 30, LastRequestTs: 4},
|
||||
},
|
||||
}
|
||||
f(dataSet, expected)
|
||||
|
||||
// duplicates mixed
|
||||
dataSet = StatsResult{
|
||||
Records: []StatRecord{
|
||||
{MetricName: "mn1", RequestsCount: 10, LastRequestTs: 1},
|
||||
{MetricName: "mn1", RequestsCount: 10, LastRequestTs: 1},
|
||||
{MetricName: "mn2", RequestsCount: 12, LastRequestTs: 2},
|
||||
{MetricName: "mn3", RequestsCount: 10, LastRequestTs: 2},
|
||||
{MetricName: "mn3", RequestsCount: 10, LastRequestTs: 3},
|
||||
{MetricName: "mn3", RequestsCount: 10, LastRequestTs: 3},
|
||||
{MetricName: "mn4", RequestsCount: 15, LastRequestTs: 4},
|
||||
{MetricName: "mn4", RequestsCount: 15, LastRequestTs: 4},
|
||||
{MetricName: "mn5", RequestsCount: 15, LastRequestTs: 4},
|
||||
},
|
||||
}
|
||||
expected = StatsResult{
|
||||
Records: []StatRecord{
|
||||
{MetricName: "mn1", RequestsCount: 20, LastRequestTs: 1},
|
||||
{MetricName: "mn2", RequestsCount: 12, LastRequestTs: 2},
|
||||
{MetricName: "mn3", RequestsCount: 30, LastRequestTs: 3},
|
||||
{MetricName: "mn4", RequestsCount: 30, LastRequestTs: 4},
|
||||
{MetricName: "mn5", RequestsCount: 15, LastRequestTs: 4},
|
||||
},
|
||||
}
|
||||
f(dataSet, expected)
|
||||
}
|
||||
|
||||
func TestStatsResultMerge(t *testing.T) {
|
||||
f := func(left, right StatsResult, expected StatsResult) {
|
||||
t.Helper()
|
||||
expected.sort()
|
||||
left.sort()
|
||||
right.sort()
|
||||
left.Merge(&right)
|
||||
if !cmp.Equal(left, expected, statsResultCmpOpts) {
|
||||
t.Fatalf("unexpected deduplicate result: %s", cmp.Diff(left, expected, statsResultCmpOpts))
|
||||
}
|
||||
}
|
||||
|
||||
// empty src
|
||||
dst := StatsResult{
|
||||
Records: []StatRecord{
|
||||
{MetricName: "mn1", RequestsCount: 10, LastRequestTs: 2},
|
||||
},
|
||||
}
|
||||
src := StatsResult{}
|
||||
expected := StatsResult{
|
||||
Records: []StatRecord{
|
||||
{MetricName: "mn1", RequestsCount: 10, LastRequestTs: 2},
|
||||
},
|
||||
}
|
||||
f(dst, src, expected)
|
||||
|
||||
// empty dst
|
||||
dst = StatsResult{}
|
||||
src = StatsResult{
|
||||
Records: []StatRecord{
|
||||
{MetricName: "mn1", RequestsCount: 10, LastRequestTs: 2},
|
||||
},
|
||||
}
|
||||
expected = StatsResult{
|
||||
Records: []StatRecord{
|
||||
{MetricName: "mn1", RequestsCount: 10, LastRequestTs: 2},
|
||||
},
|
||||
}
|
||||
f(dst, src, expected)
|
||||
|
||||
// all duplicates
|
||||
dst = StatsResult{
|
||||
Records: []StatRecord{
|
||||
{MetricName: "mn1", RequestsCount: 10, LastRequestTs: 2},
|
||||
{MetricName: "mn2", RequestsCount: 20, LastRequestTs: 2},
|
||||
{MetricName: "mn3", RequestsCount: 30, LastRequestTs: 2},
|
||||
},
|
||||
}
|
||||
src = StatsResult{
|
||||
Records: []StatRecord{
|
||||
{MetricName: "mn1", RequestsCount: 10, LastRequestTs: 2},
|
||||
{MetricName: "mn2", RequestsCount: 20, LastRequestTs: 2},
|
||||
{MetricName: "mn3", RequestsCount: 30, LastRequestTs: 2},
|
||||
},
|
||||
}
|
||||
expected = StatsResult{
|
||||
Records: []StatRecord{
|
||||
{MetricName: "mn1", RequestsCount: 20, LastRequestTs: 2},
|
||||
{MetricName: "mn2", RequestsCount: 40, LastRequestTs: 2},
|
||||
{MetricName: "mn3", RequestsCount: 60, LastRequestTs: 2},
|
||||
},
|
||||
}
|
||||
f(dst, src, expected)
|
||||
|
||||
// no duplicates
|
||||
dst = StatsResult{
|
||||
Records: []StatRecord{
|
||||
{MetricName: "mn1", RequestsCount: 10, LastRequestTs: 2},
|
||||
{MetricName: "mn2", RequestsCount: 20, LastRequestTs: 2},
|
||||
{MetricName: "mn3", RequestsCount: 30, LastRequestTs: 2},
|
||||
},
|
||||
}
|
||||
src = StatsResult{
|
||||
Records: []StatRecord{
|
||||
{MetricName: "mn4", RequestsCount: 10, LastRequestTs: 2},
|
||||
{MetricName: "mn5", RequestsCount: 20, LastRequestTs: 2},
|
||||
{MetricName: "mn6", RequestsCount: 30, LastRequestTs: 2},
|
||||
},
|
||||
}
|
||||
expected = StatsResult{
|
||||
Records: []StatRecord{
|
||||
{MetricName: "mn1", RequestsCount: 10, LastRequestTs: 2},
|
||||
{MetricName: "mn2", RequestsCount: 20, LastRequestTs: 2},
|
||||
{MetricName: "mn3", RequestsCount: 30, LastRequestTs: 2},
|
||||
{MetricName: "mn4", RequestsCount: 10, LastRequestTs: 2},
|
||||
{MetricName: "mn5", RequestsCount: 20, LastRequestTs: 2},
|
||||
{MetricName: "mn6", RequestsCount: 30, LastRequestTs: 2},
|
||||
},
|
||||
}
|
||||
f(dst, src, expected)
|
||||
|
||||
// mixed
|
||||
dst = StatsResult{
|
||||
Records: []StatRecord{
|
||||
{MetricName: "mn1", RequestsCount: 10, LastRequestTs: 2},
|
||||
{MetricName: "mn3", RequestsCount: 30, LastRequestTs: 2},
|
||||
{MetricName: "mn4", RequestsCount: 10, LastRequestTs: 2},
|
||||
{MetricName: "mn5", RequestsCount: 20, LastRequestTs: 2},
|
||||
},
|
||||
}
|
||||
src = StatsResult{
|
||||
Records: []StatRecord{
|
||||
{MetricName: "mn1", RequestsCount: 10, LastRequestTs: 2},
|
||||
{MetricName: "mn2", RequestsCount: 20, LastRequestTs: 2},
|
||||
{MetricName: "mn5", RequestsCount: 20, LastRequestTs: 2},
|
||||
{MetricName: "mn6", RequestsCount: 30, LastRequestTs: 2},
|
||||
},
|
||||
}
|
||||
expected = StatsResult{
|
||||
Records: []StatRecord{
|
||||
{MetricName: "mn1", RequestsCount: 20, LastRequestTs: 2},
|
||||
{MetricName: "mn2", RequestsCount: 20, LastRequestTs: 2},
|
||||
{MetricName: "mn3", RequestsCount: 30, LastRequestTs: 2},
|
||||
{MetricName: "mn4", RequestsCount: 10, LastRequestTs: 2},
|
||||
{MetricName: "mn5", RequestsCount: 40, LastRequestTs: 2},
|
||||
{MetricName: "mn6", RequestsCount: 30, LastRequestTs: 2},
|
||||
},
|
||||
}
|
||||
f(dst, src, expected)
|
||||
|
||||
// mixed
|
||||
dst = StatsResult{
|
||||
Records: []StatRecord{
|
||||
{MetricName: "mn1", RequestsCount: 10, LastRequestTs: 2},
|
||||
{MetricName: "mn3", RequestsCount: 30, LastRequestTs: 2},
|
||||
{MetricName: "mn4", RequestsCount: 10, LastRequestTs: 2},
|
||||
{MetricName: "mn5", RequestsCount: 20, LastRequestTs: 1},
|
||||
{MetricName: "mn6", RequestsCount: 30, LastRequestTs: 2},
|
||||
},
|
||||
}
|
||||
src = StatsResult{
|
||||
Records: []StatRecord{
|
||||
{MetricName: "mn1", RequestsCount: 10, LastRequestTs: 2},
|
||||
{MetricName: "mn2", RequestsCount: 20, LastRequestTs: 2},
|
||||
{MetricName: "mn5", RequestsCount: 20, LastRequestTs: 2},
|
||||
},
|
||||
}
|
||||
expected = StatsResult{
|
||||
Records: []StatRecord{
|
||||
{MetricName: "mn1", RequestsCount: 20, LastRequestTs: 2},
|
||||
{MetricName: "mn2", RequestsCount: 20, LastRequestTs: 2},
|
||||
{MetricName: "mn3", RequestsCount: 30, LastRequestTs: 2},
|
||||
{MetricName: "mn4", RequestsCount: 10, LastRequestTs: 2},
|
||||
{MetricName: "mn5", RequestsCount: 40, LastRequestTs: 2},
|
||||
{MetricName: "mn6", RequestsCount: 30, LastRequestTs: 2},
|
||||
},
|
||||
}
|
||||
f(dst, src, expected)
|
||||
|
||||
}
|
||||
57
lib/storage/metricnamestats/tracker_timing_test.go
Normal file
57
lib/storage/metricnamestats/tracker_timing_test.go
Normal file
@@ -0,0 +1,57 @@
|
||||
package metricnamestats
|
||||
|
||||
import (
|
||||
"testing"
|
||||
|
||||
"github.com/google/go-cmp/cmp"
|
||||
)
|
||||
|
||||
func BenchmarkTracker(b *testing.B) {
|
||||
b.ReportAllocs()
|
||||
mt := MustLoadFrom("testdata/"+b.Name(), 100_000_000)
|
||||
mt.getCurrentTs = func() uint64 {
|
||||
return 1
|
||||
}
|
||||
type testOp struct {
|
||||
t byte
|
||||
metricName []byte
|
||||
}
|
||||
dataSet := []testOp{
|
||||
{'i', []byte("metric_2")},
|
||||
{'i', []byte("metric_3")},
|
||||
{'i', []byte("metric_3")},
|
||||
{'i', []byte("metric_4")},
|
||||
{'r', []byte("metric_3")},
|
||||
{'r', []byte("metric_3")},
|
||||
{'r', []byte("metric_3")},
|
||||
{'i', []byte("metric_1")},
|
||||
{'r', []byte("metric_1")},
|
||||
}
|
||||
b.ResetTimer()
|
||||
for range b.N {
|
||||
for _, op := range dataSet {
|
||||
switch op.t {
|
||||
case 'i':
|
||||
mt.RegisterIngestRequest(0, 0, op.metricName)
|
||||
case 'r':
|
||||
mt.RegisterQueryRequest(0, 0, op.metricName)
|
||||
}
|
||||
}
|
||||
}
|
||||
b.StopTimer()
|
||||
got := mt.GetStats(100, -1, "")
|
||||
got.sort()
|
||||
expected := StatsResult{
|
||||
TotalRecords: 4,
|
||||
Records: []StatRecord{
|
||||
{"metric_2", 0, 0},
|
||||
{"metric_4", 0, 0},
|
||||
{"metric_1", uint64(b.N), 1},
|
||||
{"metric_3", 3 * uint64(b.N), 1},
|
||||
},
|
||||
}
|
||||
expected.sort()
|
||||
if !cmp.Equal(expected, got, statsResultCmpOpts) {
|
||||
b.Fatalf("unexpected result: %s", cmp.Diff(expected, got, statsResultCmpOpts))
|
||||
}
|
||||
}
|
||||
@@ -118,6 +118,9 @@ type Search struct {
|
||||
loops int
|
||||
|
||||
prevMetricID uint64
|
||||
|
||||
// metricGroupBuf holds metricGroup used for metric names tracker
|
||||
metricGroupBuf []byte
|
||||
}
|
||||
|
||||
func (s *Search) reset() {
|
||||
@@ -134,6 +137,7 @@ func (s *Search) reset() {
|
||||
s.needClosing = false
|
||||
s.loops = 0
|
||||
s.prevMetricID = 0
|
||||
s.metricGroupBuf = nil
|
||||
}
|
||||
|
||||
// Init initializes s from the given storage, tfss and tr.
|
||||
@@ -224,6 +228,18 @@ func (s *Search) NextMetricBlock() bool {
|
||||
// It should be automatically fixed. See indexDB.searchMetricNameWithCache for details.
|
||||
continue
|
||||
}
|
||||
// for perfomance reasons parse metricGroup conditionally
|
||||
if s.idb.s.metricsTracker != nil {
|
||||
var err error
|
||||
// MetricName must be sorted and marshalled with MetricName.Marshal()
|
||||
// it guarantees that first tag is metricGroup
|
||||
_, s.metricGroupBuf, err = unmarshalTagValue(s.metricGroupBuf[:0], s.MetricBlockRef.MetricName)
|
||||
if err != nil {
|
||||
s.err = fmt.Errorf("cannot unmarshal metricGroup from MetricBlockRef.MetricName: %w", err)
|
||||
return false
|
||||
}
|
||||
s.idb.s.metricsTracker.RegisterQueryRequest(0, 0, s.metricGroupBuf)
|
||||
}
|
||||
s.prevMetricID = tsid.MetricID
|
||||
}
|
||||
s.MetricBlockRef.BlockRef = s.ts.BlockRef
|
||||
|
||||
@@ -26,6 +26,7 @@ import (
|
||||
"github.com/VictoriaMetrics/VictoriaMetrics/lib/memory"
|
||||
"github.com/VictoriaMetrics/VictoriaMetrics/lib/querytracer"
|
||||
"github.com/VictoriaMetrics/VictoriaMetrics/lib/snapshot/snapshotutil"
|
||||
"github.com/VictoriaMetrics/VictoriaMetrics/lib/storage/metricnamestats"
|
||||
"github.com/VictoriaMetrics/VictoriaMetrics/lib/timeutil"
|
||||
"github.com/VictoriaMetrics/VictoriaMetrics/lib/uint64set"
|
||||
"github.com/VictoriaMetrics/VictoriaMetrics/lib/workingsetcache"
|
||||
@@ -165,14 +166,17 @@ type Storage struct {
|
||||
|
||||
// isReadOnly is set to true when the storage is in read-only mode.
|
||||
isReadOnly atomic.Bool
|
||||
|
||||
metricsTracker *metricnamestats.Tracker
|
||||
}
|
||||
|
||||
// OpenOptions optional args for MustOpenStorage
|
||||
type OpenOptions struct {
|
||||
Retention time.Duration
|
||||
MaxHourlySeries int
|
||||
MaxDailySeries int
|
||||
DisablePerDayIndex bool
|
||||
Retention time.Duration
|
||||
MaxHourlySeries int
|
||||
MaxDailySeries int
|
||||
DisablePerDayIndex bool
|
||||
TrackMetricNamesStats bool
|
||||
}
|
||||
|
||||
// MustOpenStorage opens storage on the given path with the given retentionMsecs.
|
||||
@@ -244,6 +248,16 @@ func MustOpenStorage(path string, opts OpenOptions) *Storage {
|
||||
s.pendingNextDayMetricIDs = &uint64set.Set{}
|
||||
|
||||
s.prefetchedMetricIDs = &uint64set.Set{}
|
||||
if opts.TrackMetricNamesStats {
|
||||
mnt := metricnamestats.MustLoadFrom(filepath.Join(s.cachePath, "metric_usage_tracker"), uint64(getMetricNamesStatsCacheSize()))
|
||||
s.metricsTracker = mnt
|
||||
if mnt.IsEmpty() {
|
||||
// metric names tracker performs attemp to track timeseries during ingestion only at tsid cache miss.
|
||||
// It allows to do not decrease storage performance.
|
||||
logger.Infof("reseting tsidCache in order to properly track metric names stats usage")
|
||||
s.tsidCache.Reset()
|
||||
}
|
||||
}
|
||||
|
||||
// Load metadata
|
||||
metadataDir := filepath.Join(path, metadataDirname)
|
||||
@@ -319,6 +333,20 @@ func getTSIDCacheSize() int {
|
||||
return maxTSIDCacheSize
|
||||
}
|
||||
|
||||
var maxMetricNamesStatsCacheSize int
|
||||
|
||||
// SetMetricNamesStatsCacheSize overrides the default size of storage/metricNamesStatsTracker
|
||||
func SetMetricNamesStatsCacheSize(size int) {
|
||||
maxMetricNamesStatsCacheSize = size
|
||||
}
|
||||
|
||||
func getMetricNamesStatsCacheSize() int {
|
||||
if maxMetricNamesStatsCacheSize <= 0 {
|
||||
return memory.Allowed() / 100
|
||||
}
|
||||
return maxMetricNamesStatsCacheSize
|
||||
}
|
||||
|
||||
func (s *Storage) getDeletedMetricIDs() *uint64set.Set {
|
||||
return s.deletedMetricIDs.Load()
|
||||
}
|
||||
@@ -561,6 +589,10 @@ type Metrics struct {
|
||||
|
||||
NextRetentionSeconds uint64
|
||||
|
||||
MetricNamesUsageTrackerSize uint64
|
||||
MetricNamesUsageTrackerSizeBytes uint64
|
||||
MetricNamesUsageTrackerSizeMaxBytes uint64
|
||||
|
||||
IndexDBMetrics IndexDBMetrics
|
||||
TableMetrics TableMetrics
|
||||
}
|
||||
@@ -655,6 +687,12 @@ func (s *Storage) UpdateMetrics(m *Metrics) {
|
||||
m.PrefetchedMetricIDsSizeBytes += uint64(prefetchedMetricIDs.SizeBytes())
|
||||
s.prefetchedMetricIDsLock.Unlock()
|
||||
|
||||
var tm metricnamestats.TrackerMetrics
|
||||
s.metricsTracker.UpdateMetrics(&tm)
|
||||
m.MetricNamesUsageTrackerSizeBytes = tm.CurrentSizeBytes
|
||||
m.MetricNamesUsageTrackerSize = tm.CurrentItemsCount
|
||||
m.MetricNamesUsageTrackerSizeMaxBytes = tm.MaxSizeBytes
|
||||
|
||||
d := s.nextRetentionSeconds()
|
||||
if d < 0 {
|
||||
d = 0
|
||||
@@ -904,6 +942,7 @@ func (s *Storage) MustClose() {
|
||||
nextDayMetricIDs := s.nextDayMetricIDs.Load()
|
||||
s.mustSaveNextDayMetricIDs(nextDayMetricIDs)
|
||||
|
||||
s.metricsTracker.MustClose()
|
||||
// Release lock file.
|
||||
fs.MustClose(s.flockF)
|
||||
s.flockF = nil
|
||||
@@ -2028,6 +2067,11 @@ func (s *Storage) add(rows []rawRow, dstMrs []*MetricRow, mrs []MetricRow, preci
|
||||
mn.sortTags()
|
||||
metricNameBuf = mn.Marshal(metricNameBuf[:0])
|
||||
|
||||
// register metric name on tsid cache miss
|
||||
// it allows to track metric names since last tsid cache reset
|
||||
// and skip index scan to fill metrics tracker
|
||||
s.metricsTracker.RegisterIngestRequest(0, 0, mn.MetricGroup)
|
||||
|
||||
// Search for TSID for the given mr.MetricNameRaw in the indexdb.
|
||||
if is.getTSIDByMetricName(&genTSID, metricNameBuf, date) {
|
||||
// Slower path - the TSID has been found in indexdb.
|
||||
@@ -2087,6 +2131,7 @@ func (s *Storage) add(rows []rawRow, dstMrs []*MetricRow, mrs []MetricRow, preci
|
||||
firstWarn = fmt.Errorf("cannot prefill next indexdb: %w", err)
|
||||
}
|
||||
}
|
||||
|
||||
if err := s.updatePerDateData(rows, dstMrs); err != nil {
|
||||
if firstWarn == nil {
|
||||
firstWarn = fmt.Errorf("cannot not update per-day index: %w", err)
|
||||
@@ -2845,3 +2890,16 @@ func (s *Storage) wasMetricIDMissingBefore(metricID uint64) bool {
|
||||
}
|
||||
return ct > deleteDeadline
|
||||
}
|
||||
|
||||
// MetricNamesStatsResponse contains metric names usage stats API response
|
||||
type MetricNamesStatsResponse = metricnamestats.StatsResult
|
||||
|
||||
// GetMetricNamesStats returns metric names usage stats with given limit and le predicate
|
||||
func (s *Storage) GetMetricNamesStats(_ *querytracer.Tracer, limit, le int, matchPattern string) MetricNamesStatsResponse {
|
||||
return s.metricsTracker.GetStats(limit, le, matchPattern)
|
||||
}
|
||||
|
||||
// ResetMetricNamesStats resets state for metric names usage tracker
|
||||
func (s *Storage) ResetMetricNamesStats(_ *querytracer.Tracer) {
|
||||
s.metricsTracker.Reset(s.tsidCache.Reset)
|
||||
}
|
||||
|
||||
@@ -2892,3 +2892,51 @@ func testGenerateMetricRowBatches(opts *batchOptions) ([][]MetricRow, *counts) {
|
||||
}
|
||||
return batches, &want
|
||||
}
|
||||
|
||||
func TestStorageMetricTracker(t *testing.T) {
|
||||
defer testRemoveAll(t)
|
||||
rng := rand.New(rand.NewSource(1))
|
||||
numRows := uint64(1000)
|
||||
minTimestamp := time.Now().UnixMilli()
|
||||
maxTimestamp := minTimestamp + 1000
|
||||
mrs := testGenerateMetricRows(rng, numRows, minTimestamp, maxTimestamp)
|
||||
|
||||
var gotMetrics Metrics
|
||||
s := MustOpenStorage(t.Name(), OpenOptions{TrackMetricNamesStats: true})
|
||||
defer s.MustClose()
|
||||
s.AddRows(mrs, defaultPrecisionBits)
|
||||
s.DebugFlush()
|
||||
s.UpdateMetrics(&gotMetrics)
|
||||
|
||||
var sr Search
|
||||
tr := TimeRange{
|
||||
MinTimestamp: minTimestamp,
|
||||
MaxTimestamp: maxTimestamp,
|
||||
}
|
||||
|
||||
// check stats for metrics with 0 requests count
|
||||
mus := s.GetMetricNamesStats(nil, 10_000, 0, "")
|
||||
if len(mus.Records) != int(numRows) {
|
||||
t.Fatalf("unexpected Stats records count=%d, want %d records", len(mus.Records), numRows)
|
||||
}
|
||||
|
||||
// search query for all ingested metrics
|
||||
tfs := NewTagFilters()
|
||||
if err := tfs.Add(nil, []byte("metric_.+"), false, true); err != nil {
|
||||
t.Fatalf("unexpected error at tfs add: %s", err)
|
||||
}
|
||||
|
||||
sr.Init(nil, s, []*TagFilters{tfs}, tr, 1e5, noDeadline)
|
||||
for sr.NextMetricBlock() {
|
||||
}
|
||||
sr.MustClose()
|
||||
|
||||
mus = s.GetMetricNamesStats(nil, 10_000, 0, "")
|
||||
if len(mus.Records) != 0 {
|
||||
t.Fatalf("unexpected Stats records count=%d; want 0 records", len(mus.Records))
|
||||
}
|
||||
mus = s.GetMetricNamesStats(nil, 10_000, 1, "")
|
||||
if len(mus.Records) != int(numRows) {
|
||||
t.Fatalf("unexpected Stats records count=%d, want %d records", len(mus.Records), numRows)
|
||||
}
|
||||
}
|
||||
|
||||
5
vendor/github.com/VictoriaMetrics/metricsql/optimizer.go
generated
vendored
5
vendor/github.com/VictoriaMetrics/metricsql/optimizer.go
generated
vendored
@@ -149,6 +149,11 @@ func getCommonLabelFilters(e Expr) []LabelFilter {
|
||||
// {f1} unless on(f1, f2) {f2} -> {f1}
|
||||
// {f1} unless on(f3) {f2} -> {}
|
||||
return TrimFiltersByGroupModifier(lfsLeft, t)
|
||||
case "ifnot":
|
||||
// remove right from left, so filter in left can be pushed down to right.
|
||||
// {f1} ifnot `any` -> {f1}
|
||||
// see https://github.com/VictoriaMetrics/VictoriaMetrics/issues/8435
|
||||
return TrimFiltersByGroupModifier(lfsLeft, t)
|
||||
default:
|
||||
switch strings.ToLower(t.JoinModifier.Op) {
|
||||
case "group_left":
|
||||
|
||||
2
vendor/modules.txt
vendored
2
vendor/modules.txt
vendored
@@ -119,7 +119,7 @@ github.com/VictoriaMetrics/fastcache
|
||||
# github.com/VictoriaMetrics/metrics v1.35.2
|
||||
## explicit; go 1.17
|
||||
github.com/VictoriaMetrics/metrics
|
||||
# github.com/VictoriaMetrics/metricsql v0.84.0
|
||||
# github.com/VictoriaMetrics/metricsql v0.84.1
|
||||
## explicit; go 1.13
|
||||
github.com/VictoriaMetrics/metricsql
|
||||
github.com/VictoriaMetrics/metricsql/binaryop
|
||||
|
||||
Reference in New Issue
Block a user